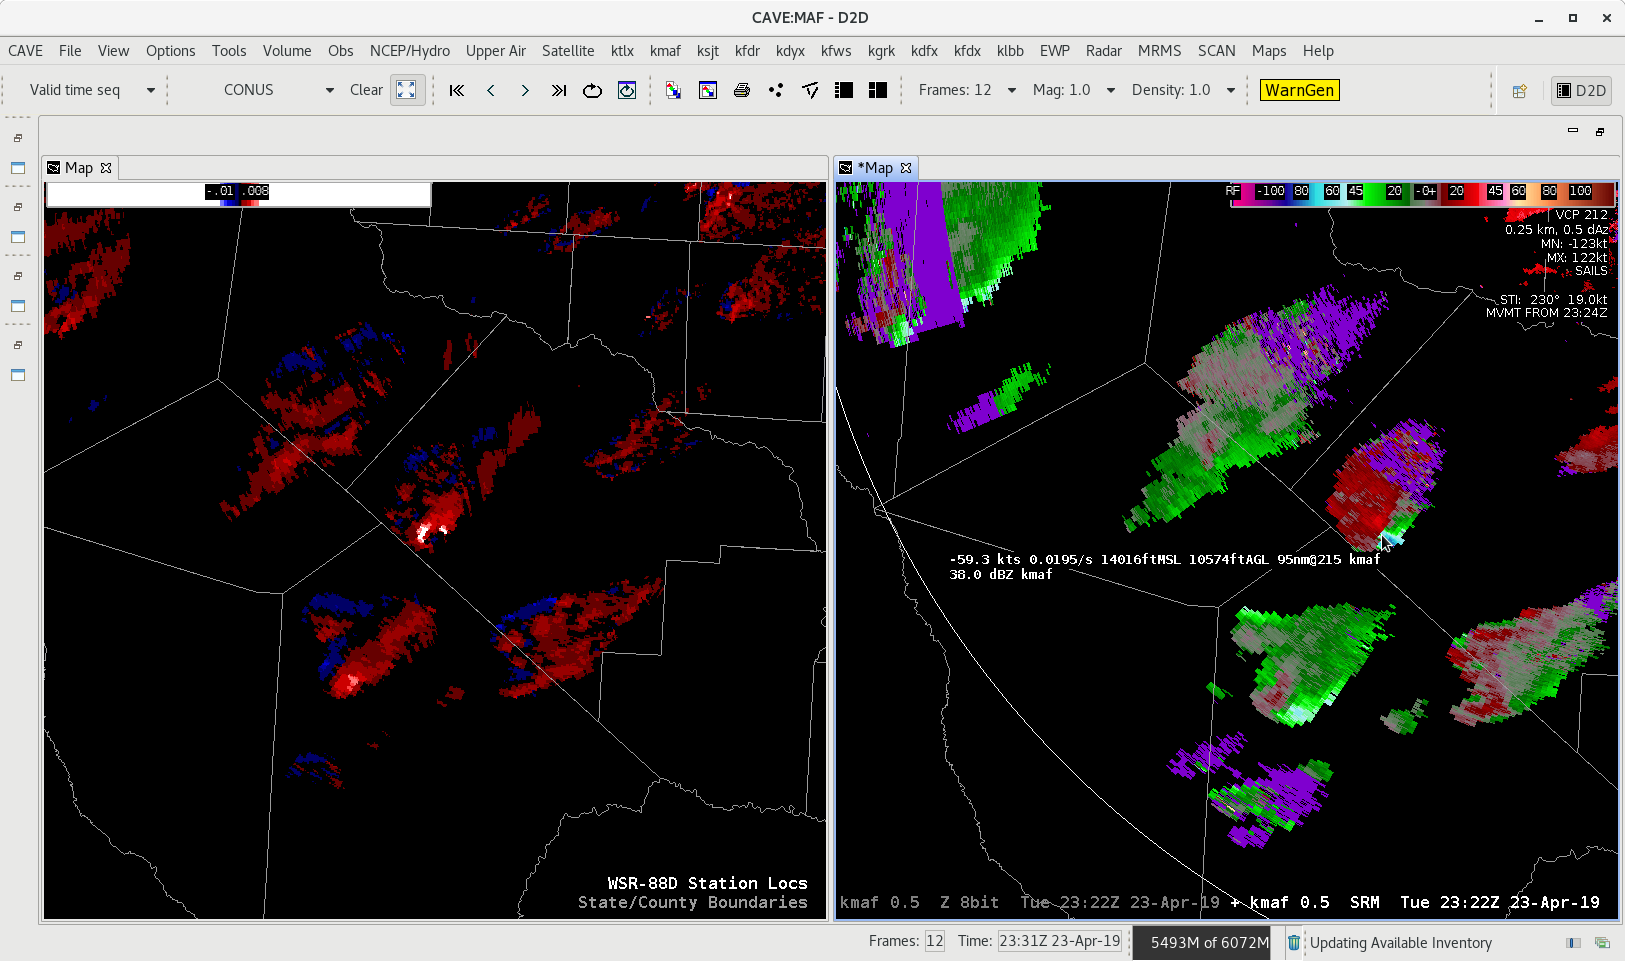
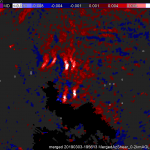
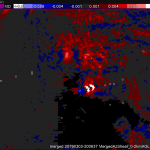
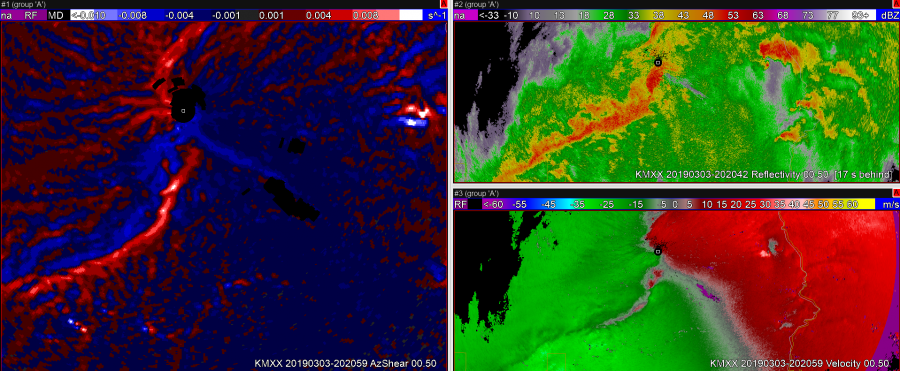
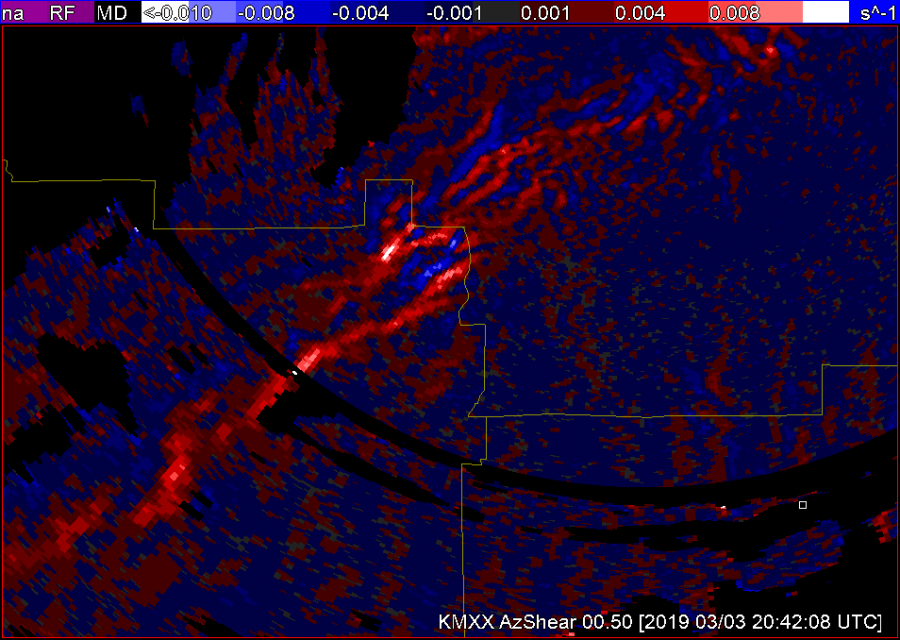
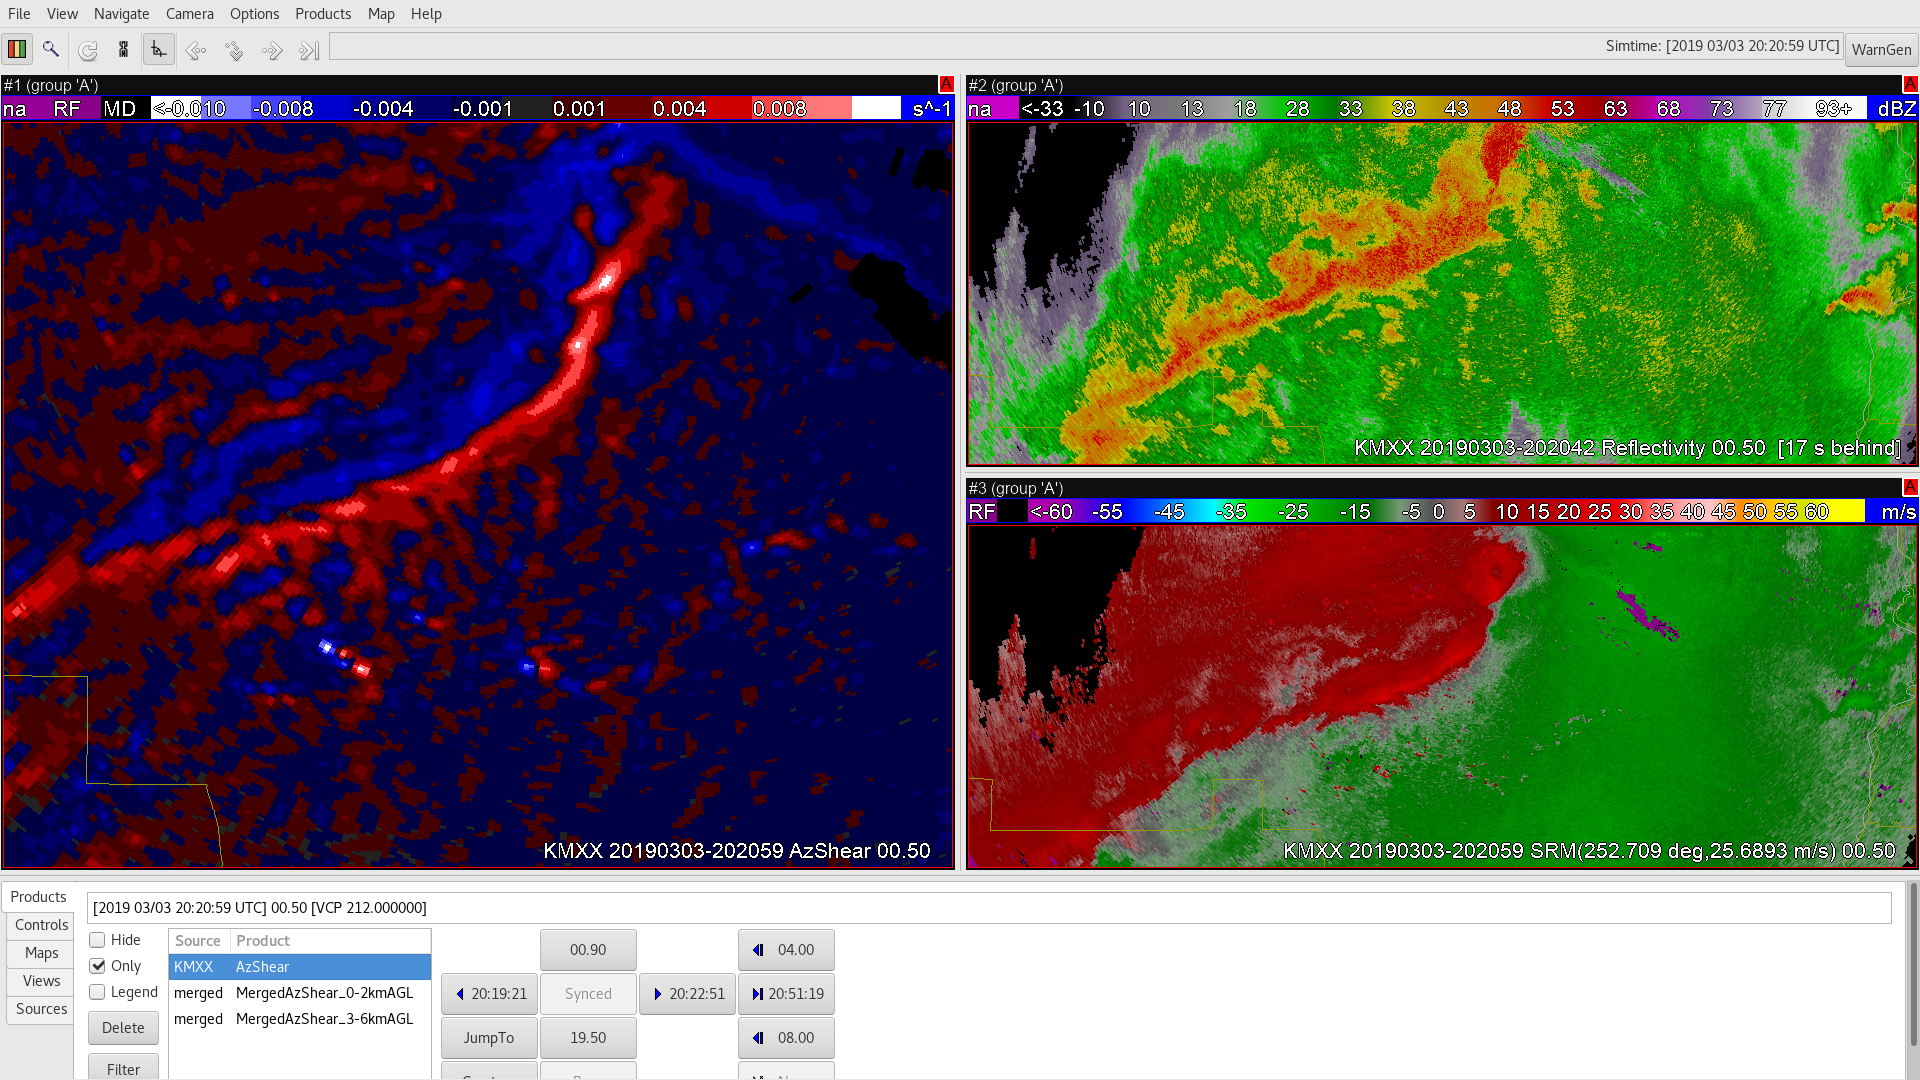
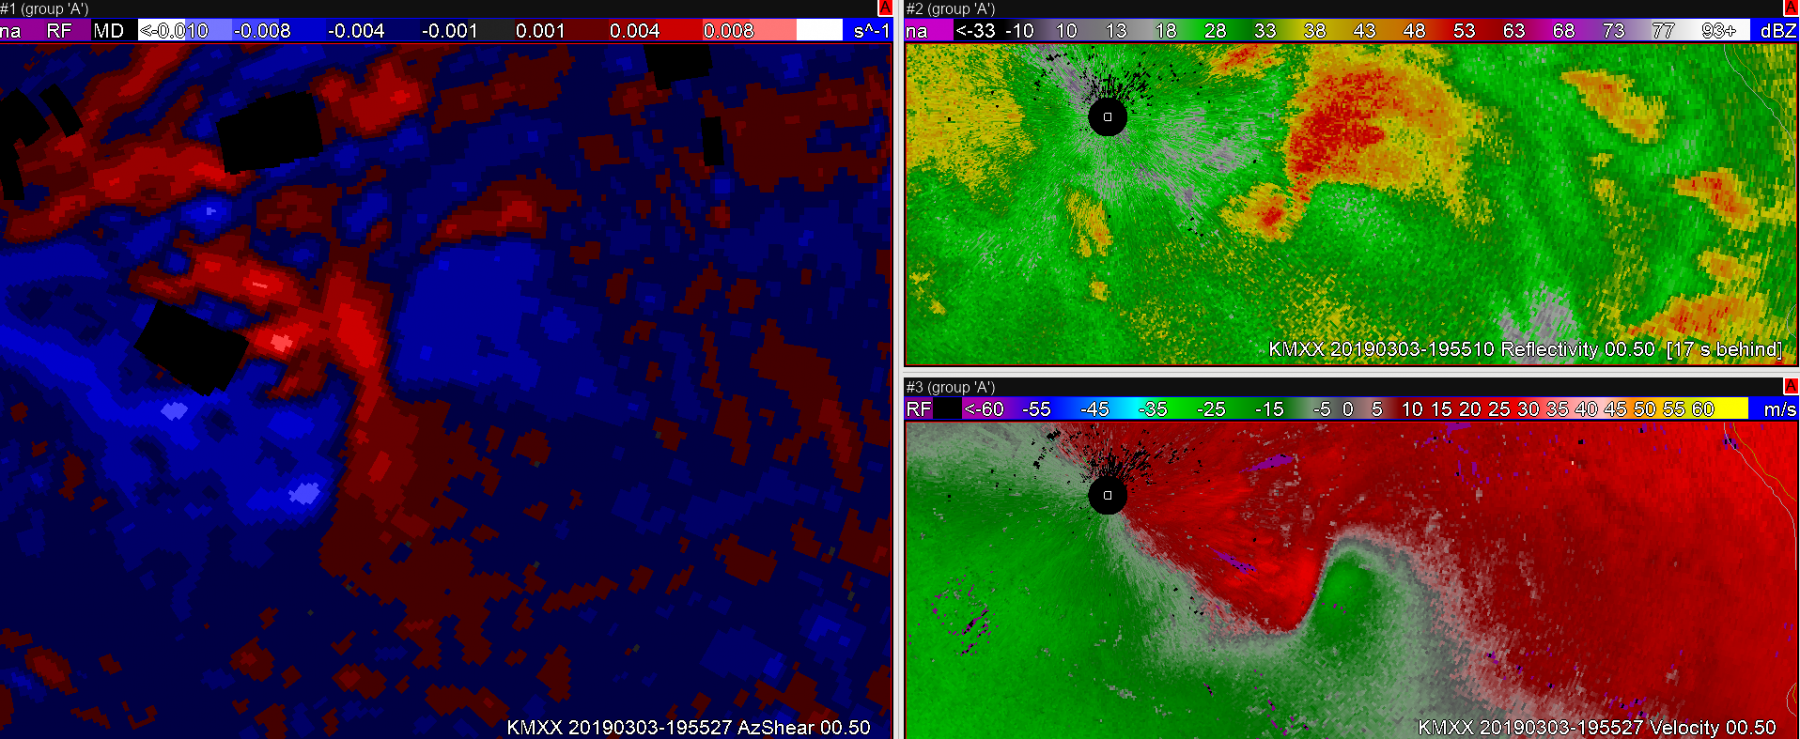
One usefulness of the upper tilts in the Single Radar AzShear product is to be able to check and dismiss any erroneous data in the 0.5 degree tilt. In the image below you can see some speckled erroneous data in the 0.5 degree tilt ahead of the main line of storms. It could appear at a quick glance to be small spin ups in the AzShear data, but just quickly looking at the Velocity or Reflectivity shows that this is erroneous data.
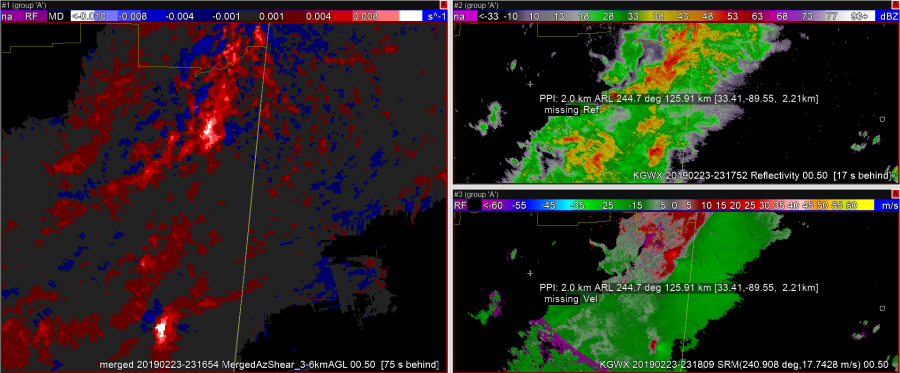
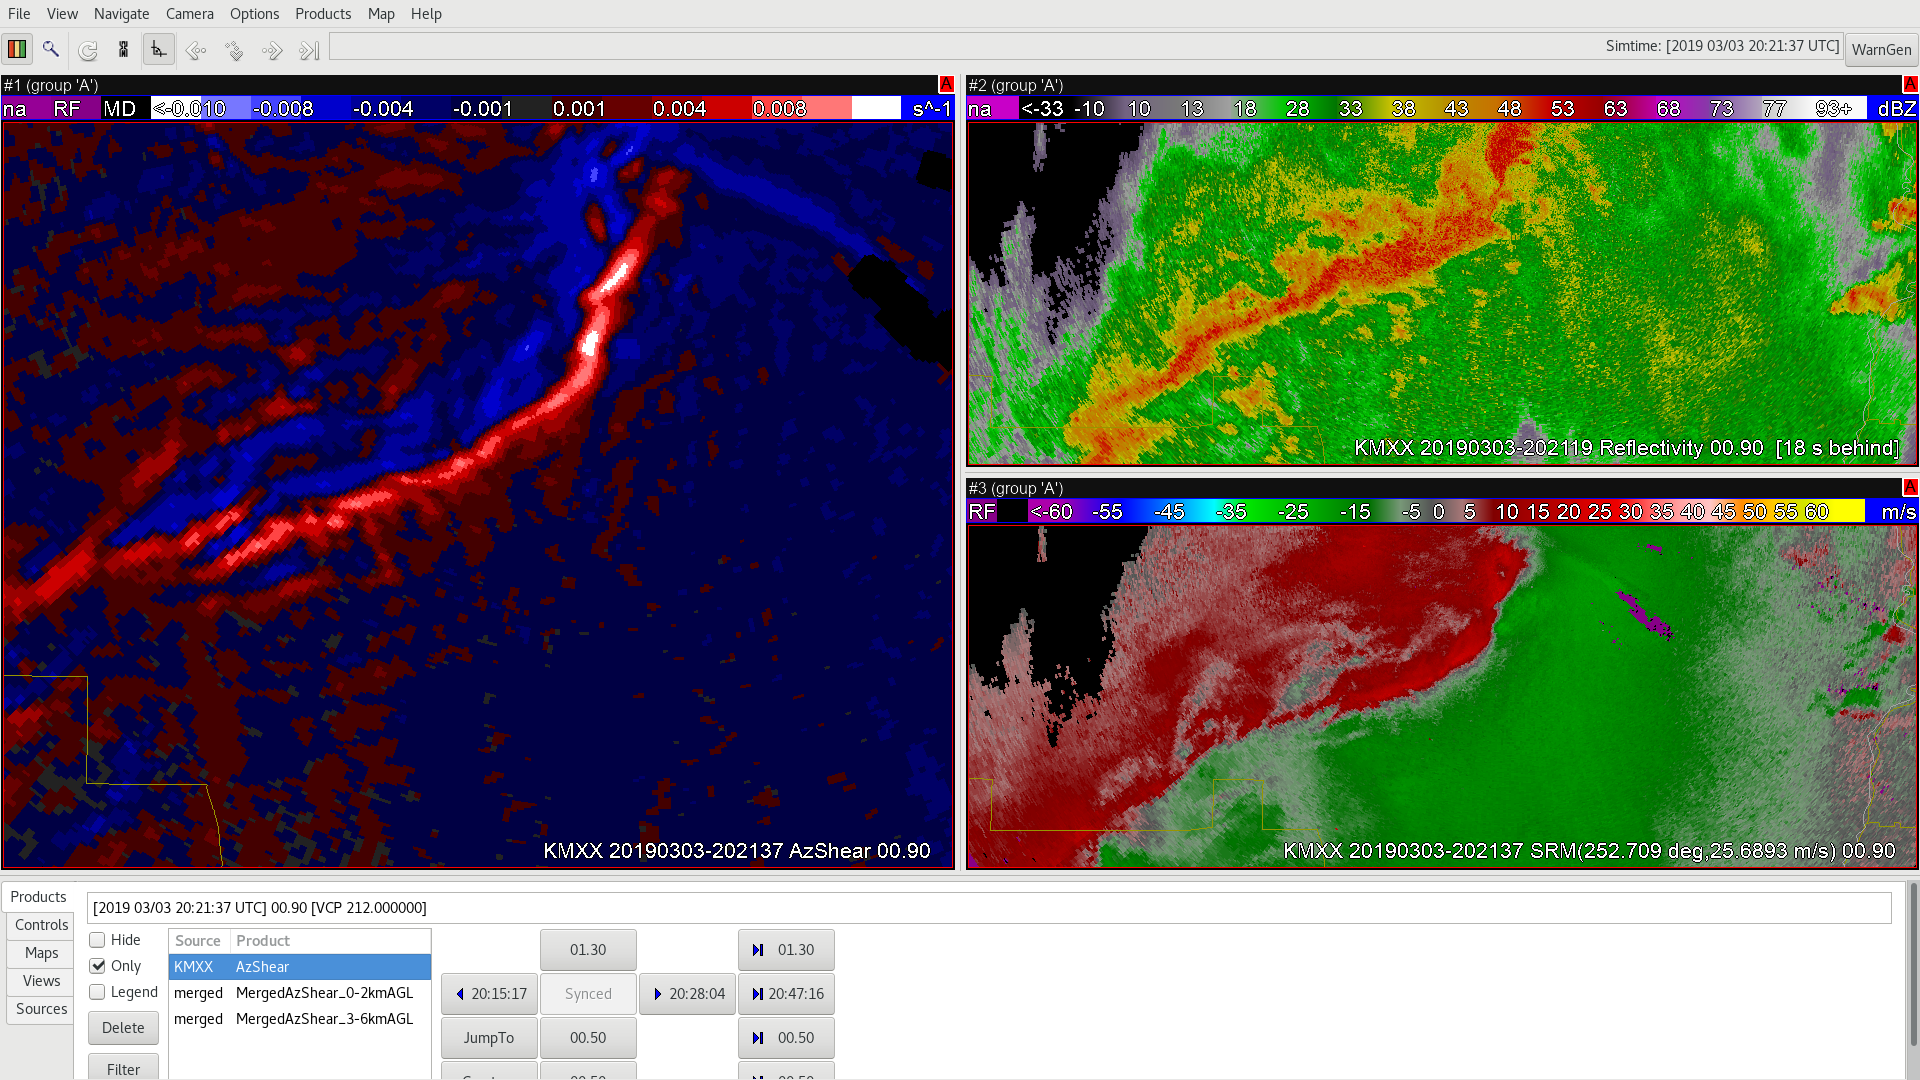
Another check is just doing a quick check of the 0.9 degree tilt. Those local max in the AzShear are not present even just one tilt above. If these were to be real circulations you would expect depth in the circulation.
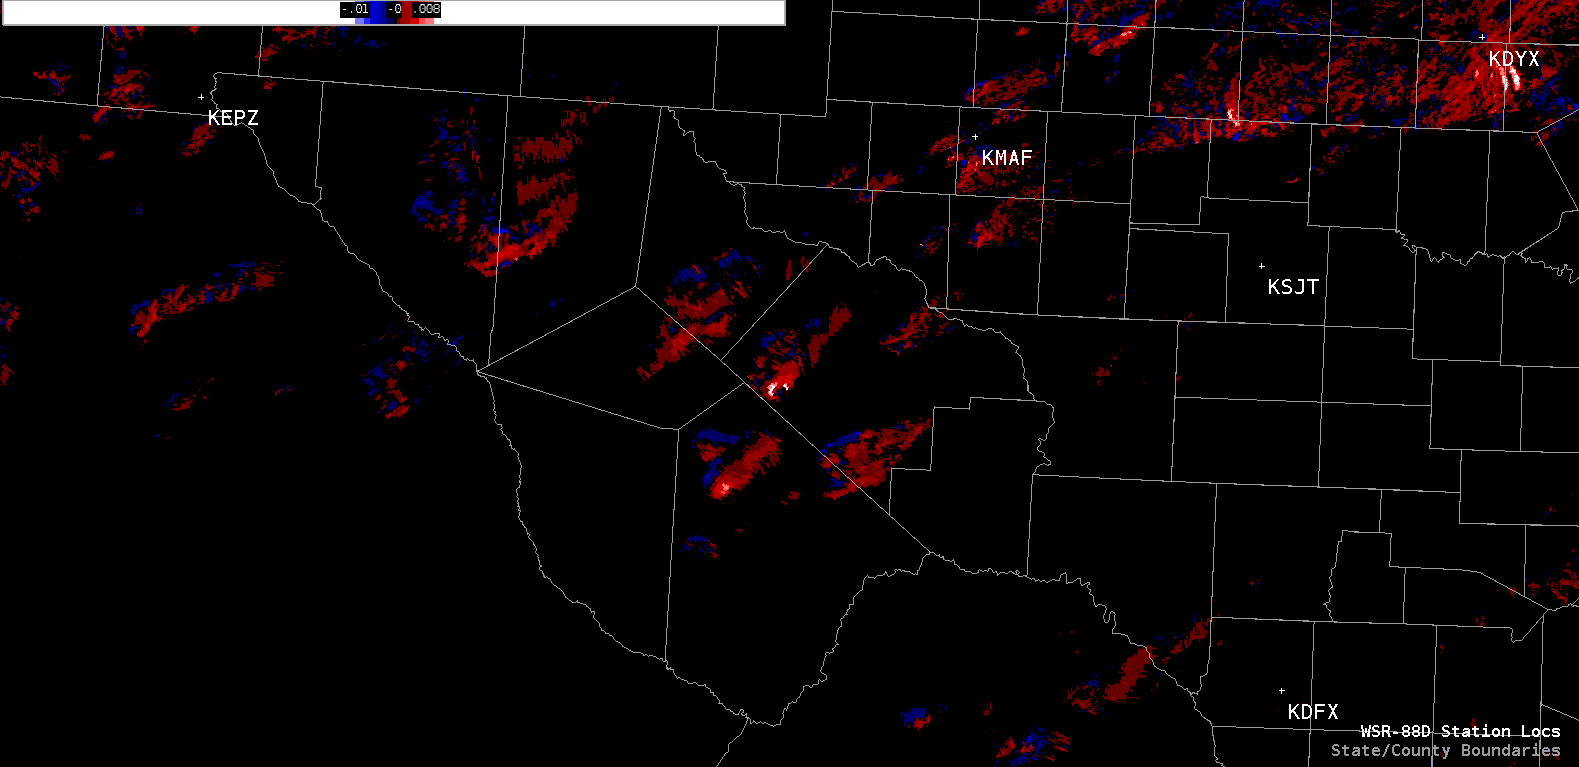
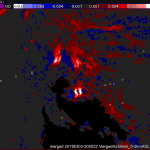
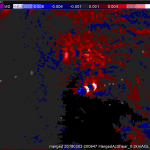
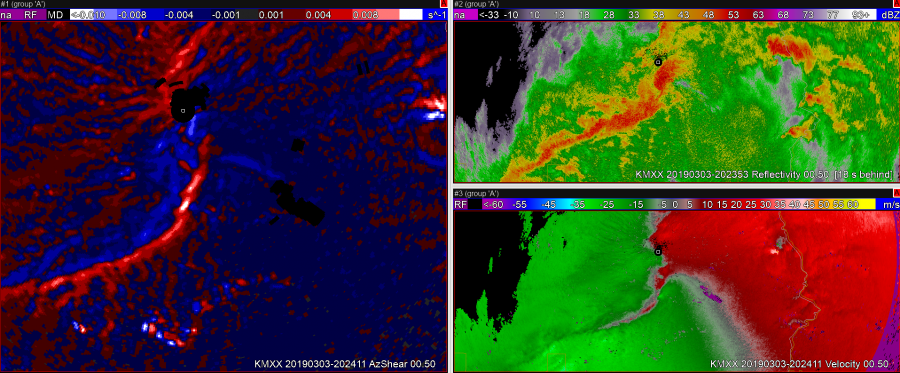
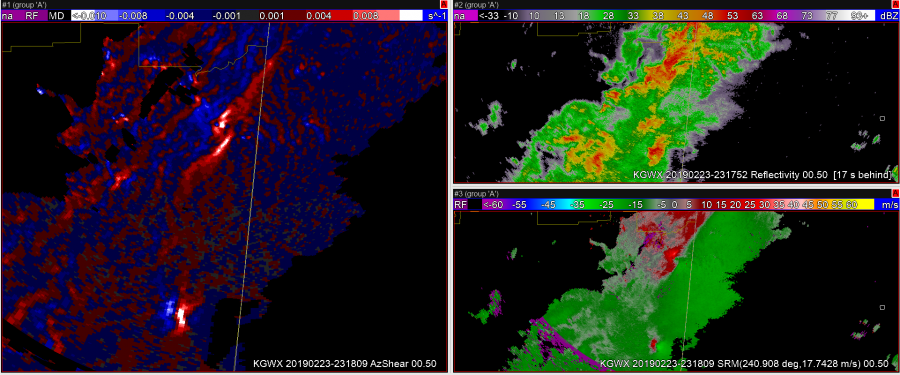
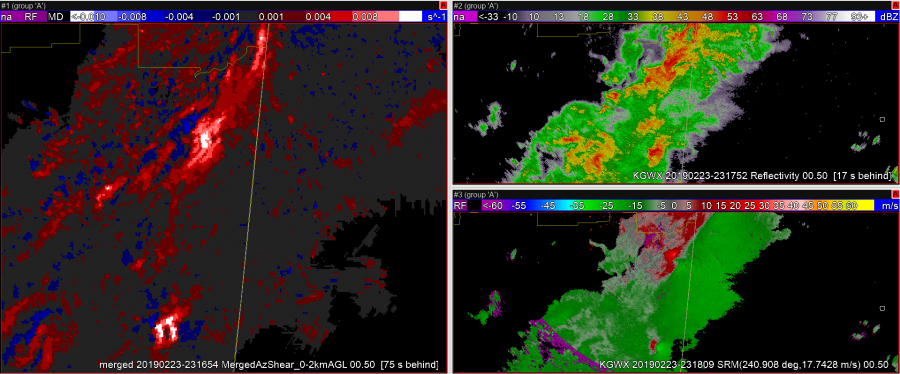
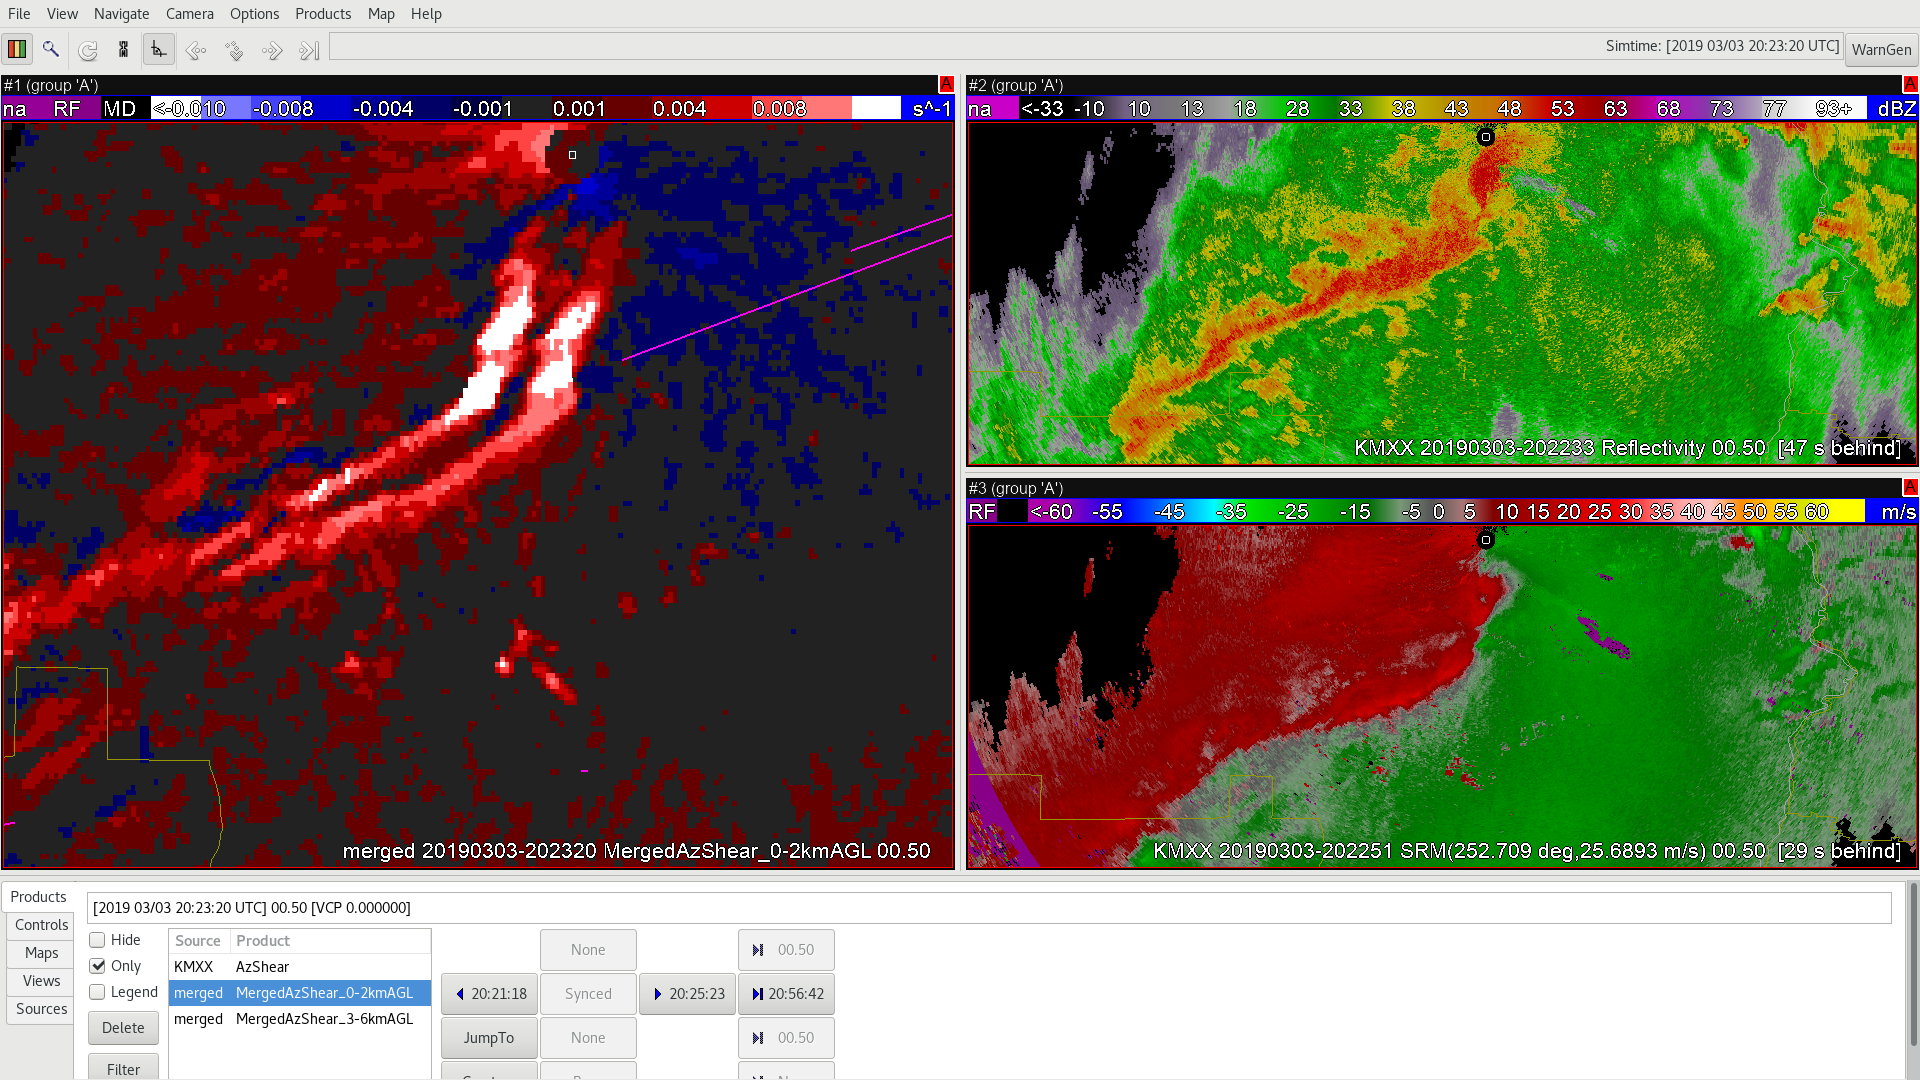
It is worth noting that these errors to at times make their way into the Merged AzShear product at least at the lower 0.2km AGL product. You can see that example below of the brighter reds below the large maxima in the center of the AzShear product. Even after only 2 days of looking at the AzShear products the large maxima keeps all of my attention, but someone looking at this product for the first time may see the brighter reds to the south and wonder about those.
-Alexander T.
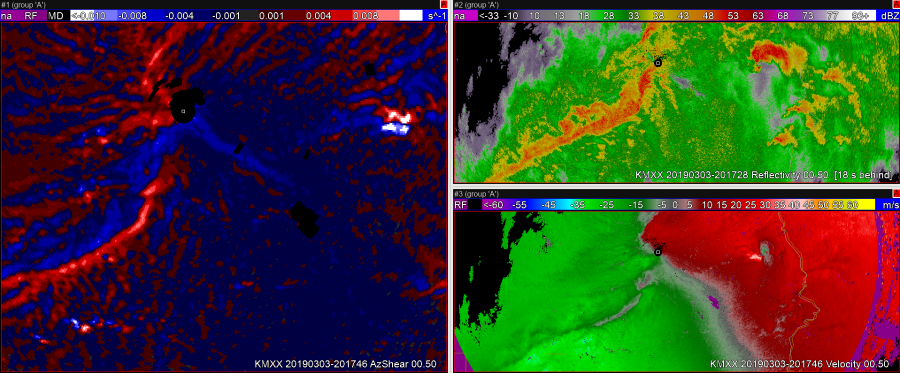
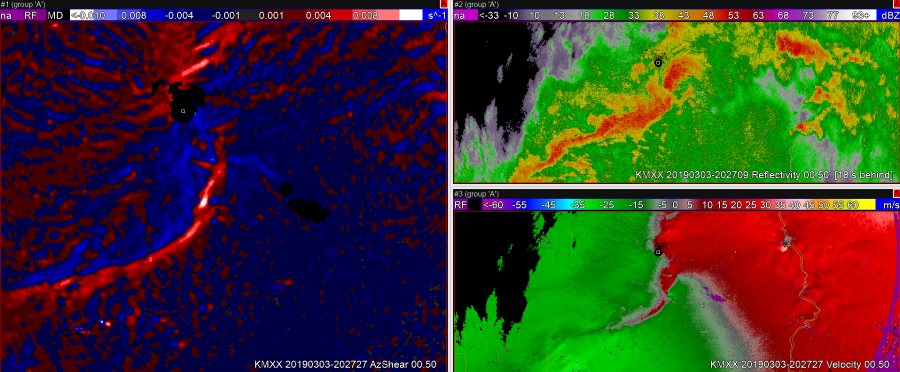
 In this next image, a couple of AzShear features stand out to me. 1) Positive values of AzShear have begun spiking on the north side of the convergant zone. 2) I believe that you’ve seeing the RFD start to kick downstream.
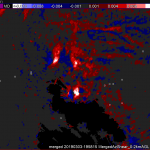
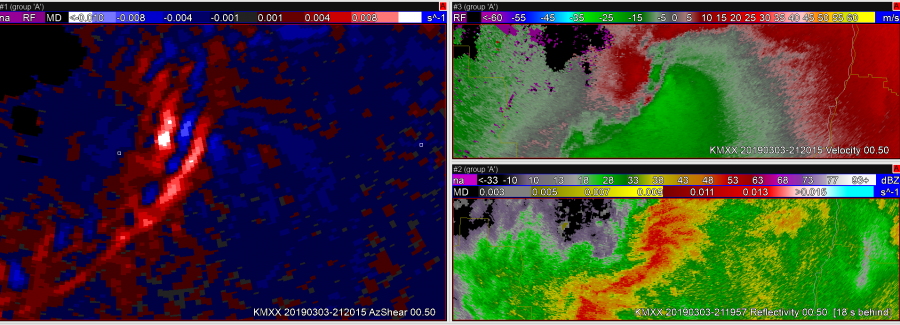
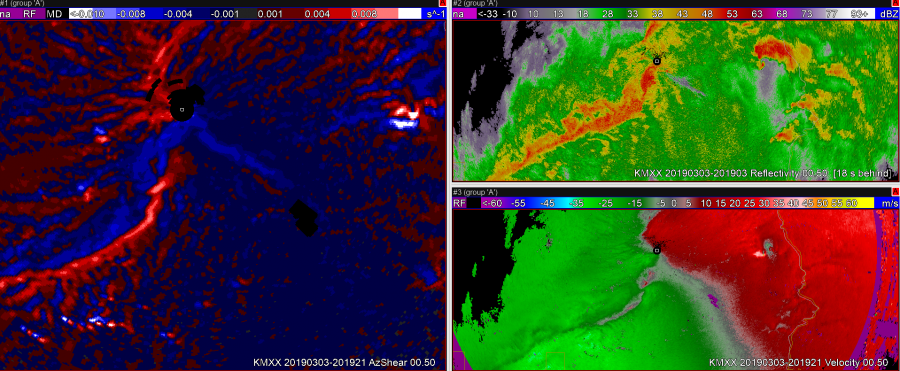
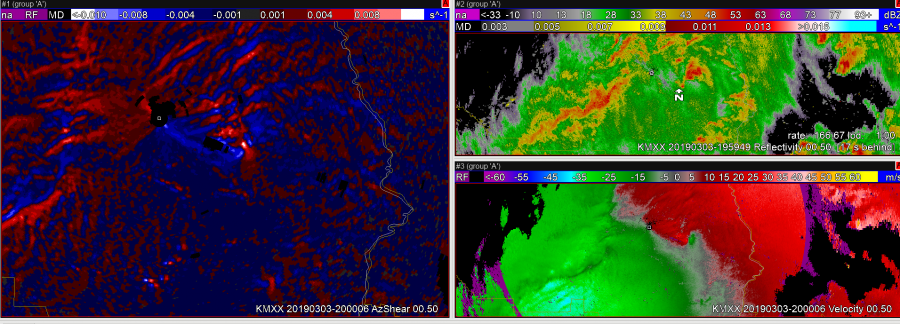
 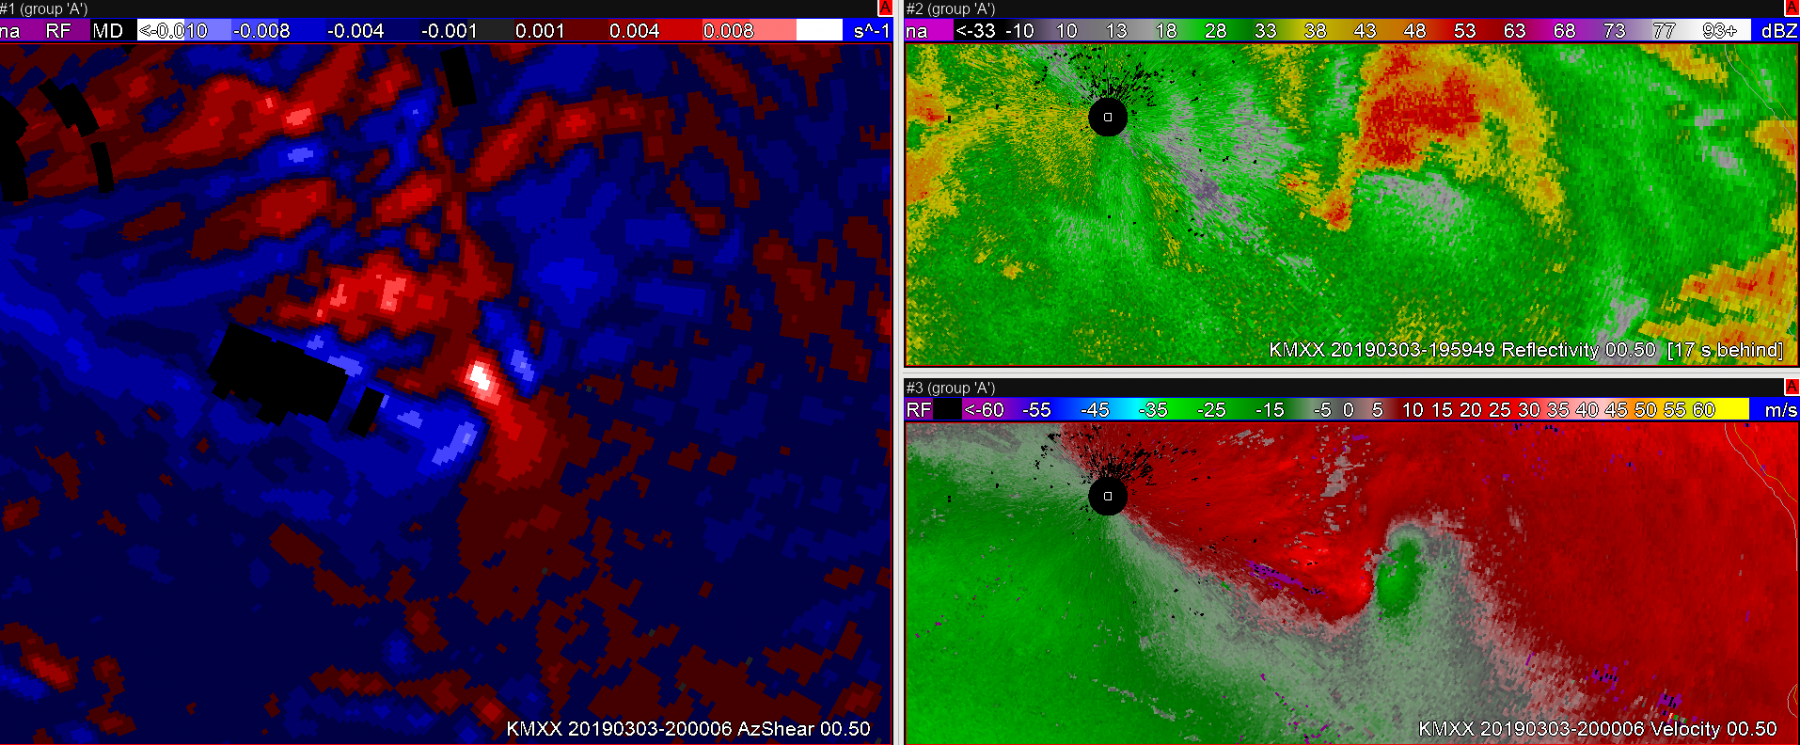 Shortly thereafter, the storm develops a very clear couplet and it is clear this storm deserves a tornado warning. The tornado survey revealed that the tornado began when the second image in this post was captured. AzShear did a nice job highlighting important features on this storm, and may have lead to additional lead time on a tornado warning.
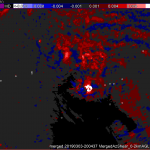
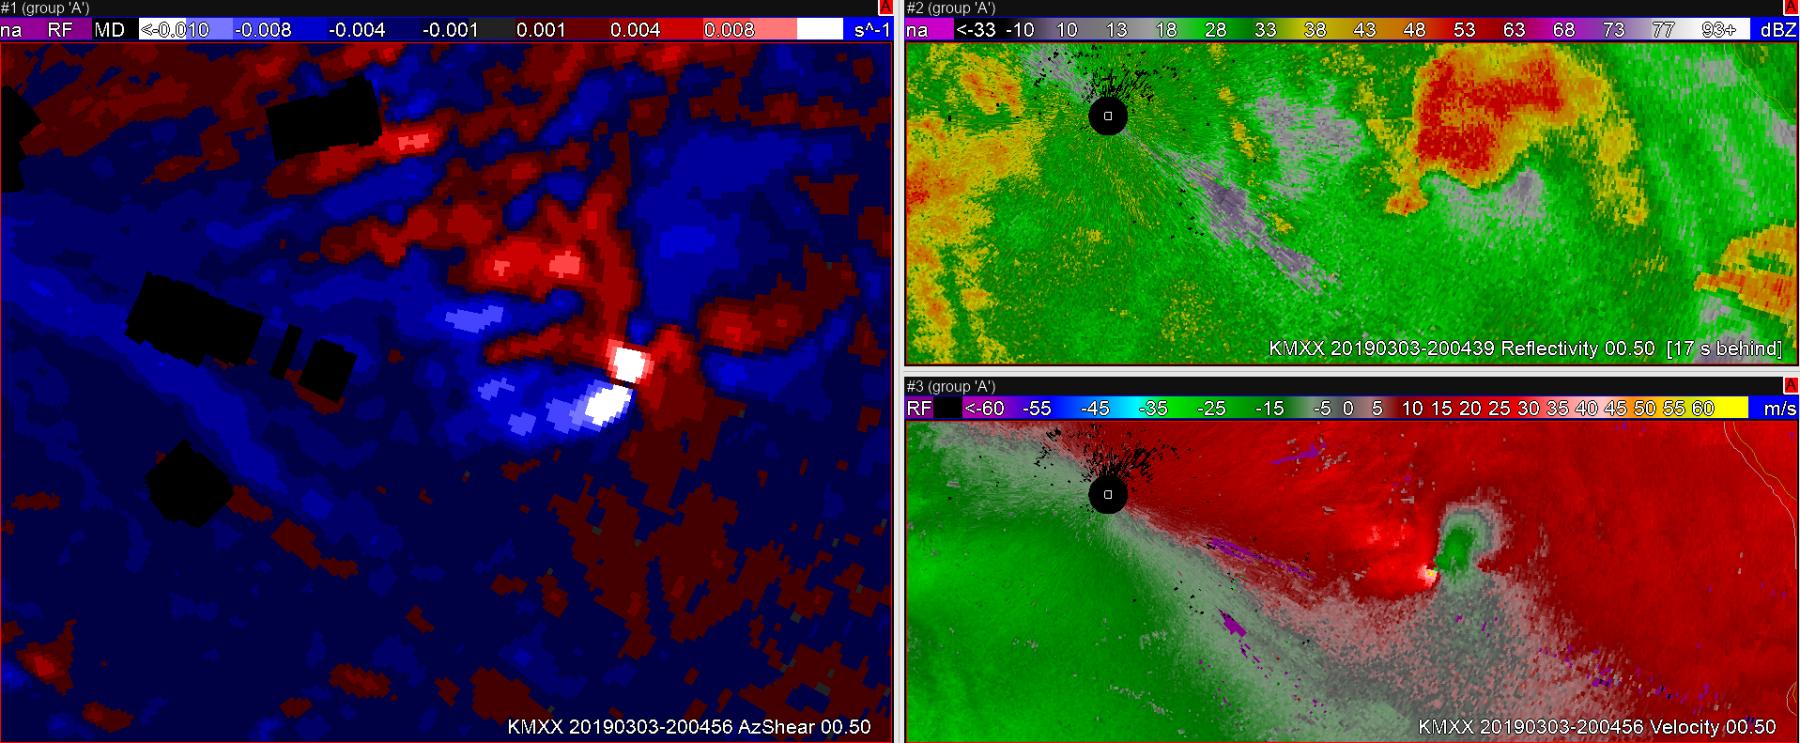 Sandor Clegane