Baylor Co TX – cycling meso

The supercell over NW TX developed a new meso. AzShear also picked up on both circulations. ProbTor values remained relatively low (~3%) throughout this transition. AzShear was weak with SRH only 107 m2/s2, mean wind was also low at 22 kt – all enviro. parameters were near the climatological averages not increasing the ProbTor above average values.

2019 March 03 AzShear

A quick look at the single radar AzShear product vs. the merged 0-2km product for a QLCS event. The single radar AzShear is far more granular and brings my attention to specific points of the line to interrogate further. However, the merged product is washed out…As a result, it’s potential utility to highlight areas of interest is degraded. Perhaps it would be most useful for general trends, but for storm-scale interrogation it leaves me wanting.

I do think the single radar AzShear product has promise with respect to increasing lead times, especially for QLCS circulations. But without other cases to examine, I can’t say for sure. It does show promise (especially when coupled with base velocity and spectrum width) with highlighting the areas of interest a scan or two before velocity couplets develop.

–Stanley Cupp

2021z merged 0-2km AzShear (left): very messy and washes out a lot of the storm-scale features. Also shows a leading area of shear ahead of the main line. This is likely due to SAILS cuts and different scanning modes for the radars used in the creation of the product. Something to watch out for in future events – this is an artifact that needs to be identified when using this product.

2020 KMXX AzShear highlights 2 main areas of interest along line of convection

2024z: AzShear and velocity begin to show that the southern most of the 2 areas is becoming an increasing concern. Would likely have a tornado warning out at this point, if not the prior scan (especially given the favorable environment). Spectrum Width (top right) also helps diagnose the increased velocity signature on the southern most area compared to the northern one.

And by 2030, a distinct velocity couplet developed 

Az Shear Case – 3/3/19

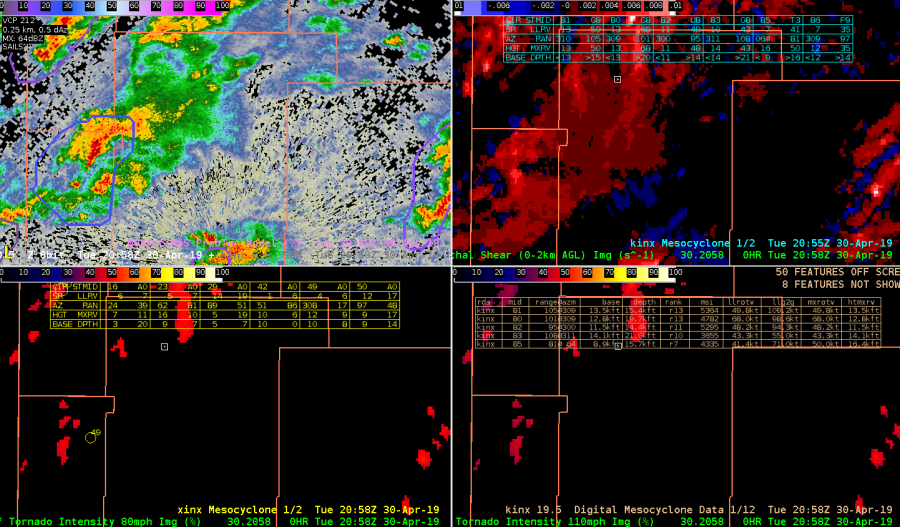
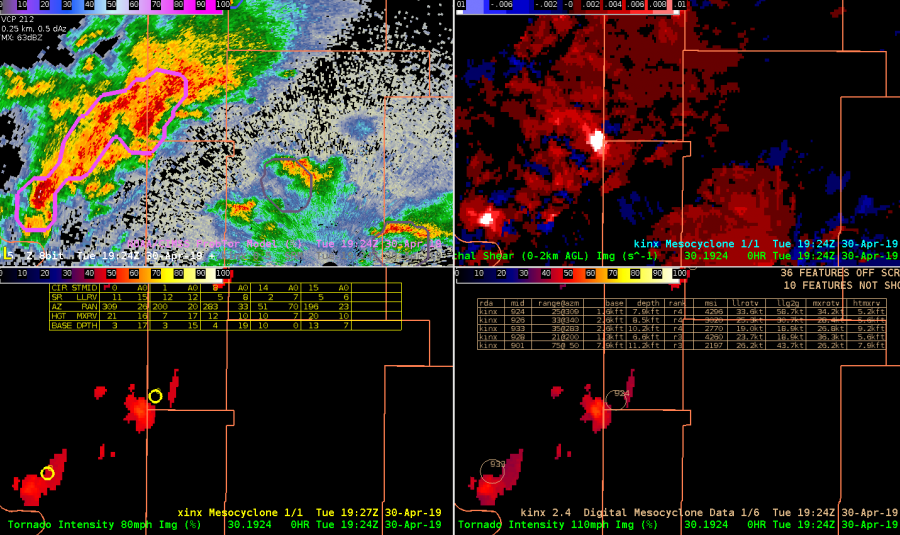
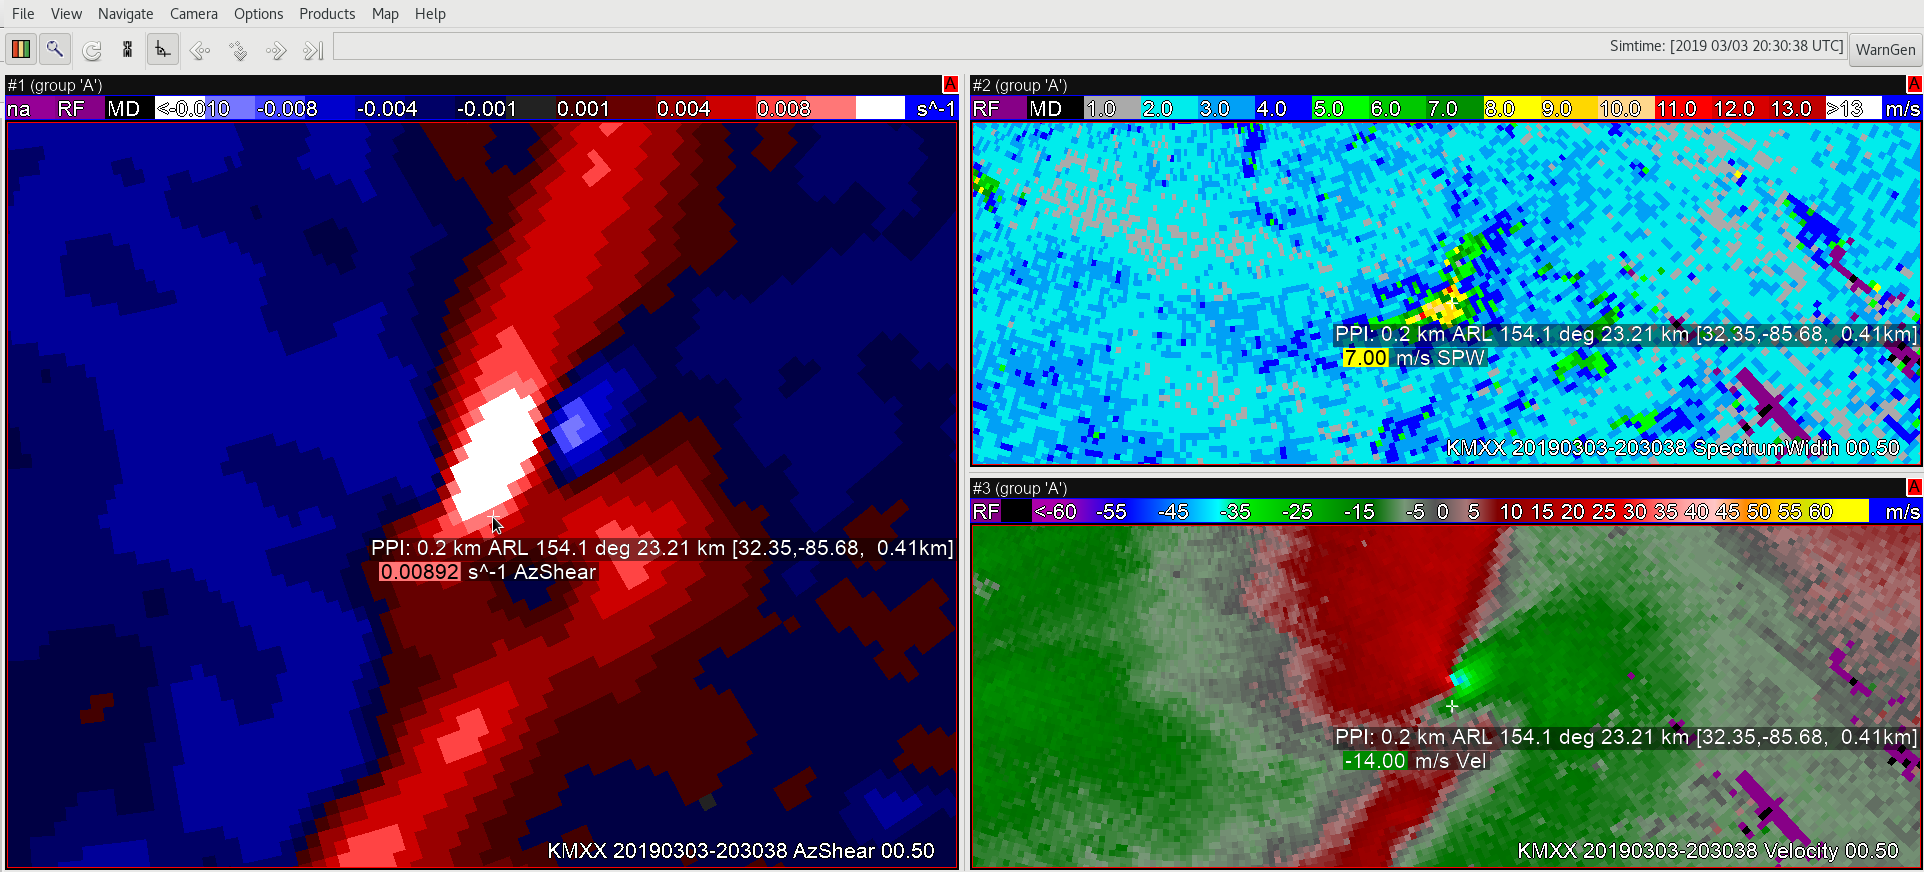
The case above shows a situation where due to the orientation of the zero isodop compared to the radar location, AzShear values are surprisingly low considering the strength of the convergent signature that preceded tornado development.

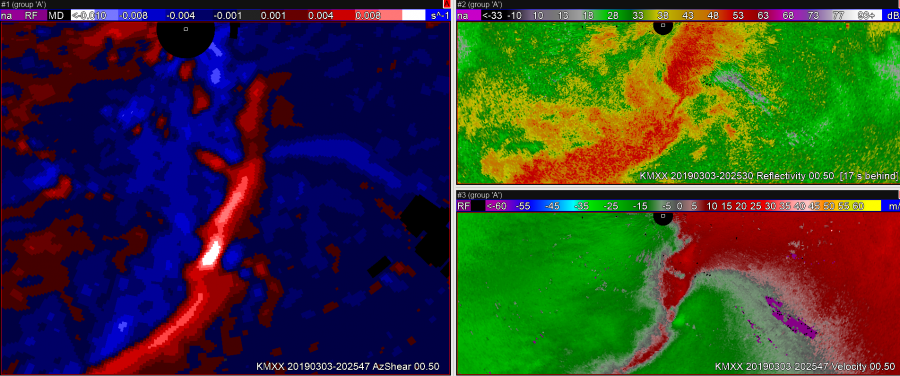
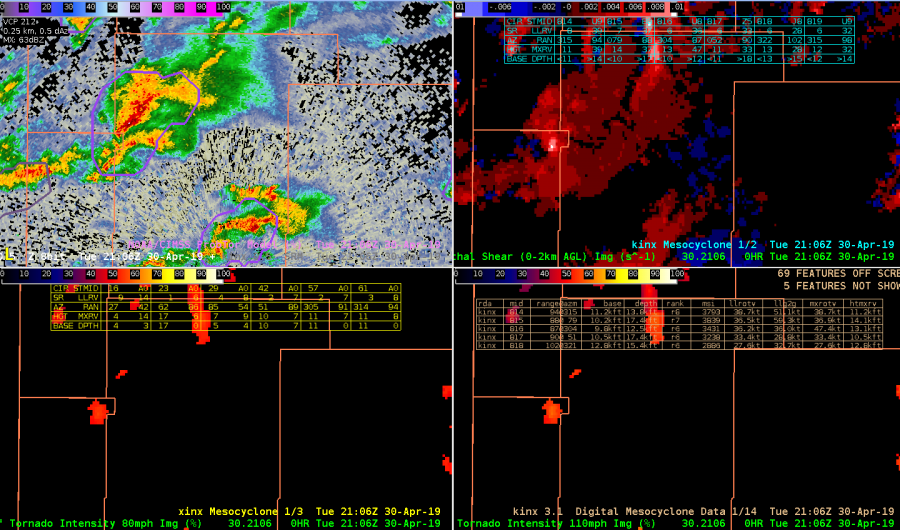
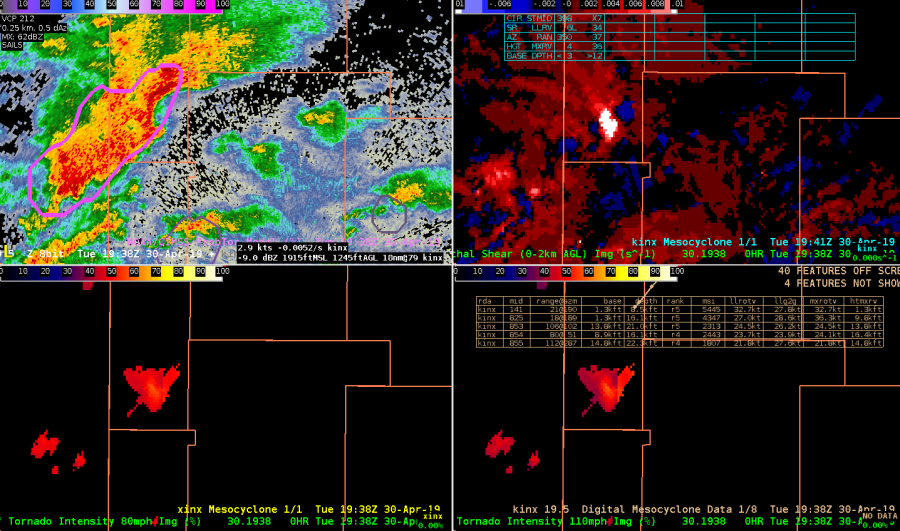
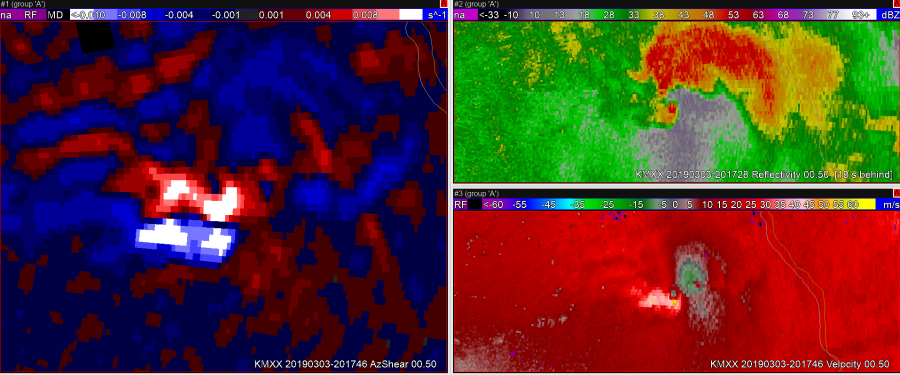
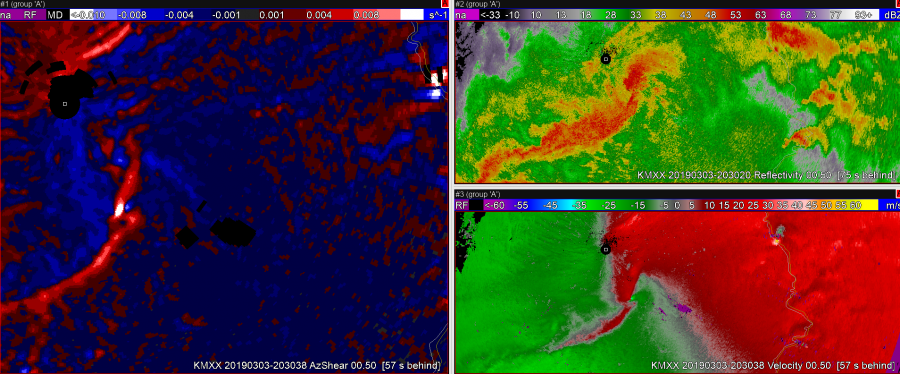
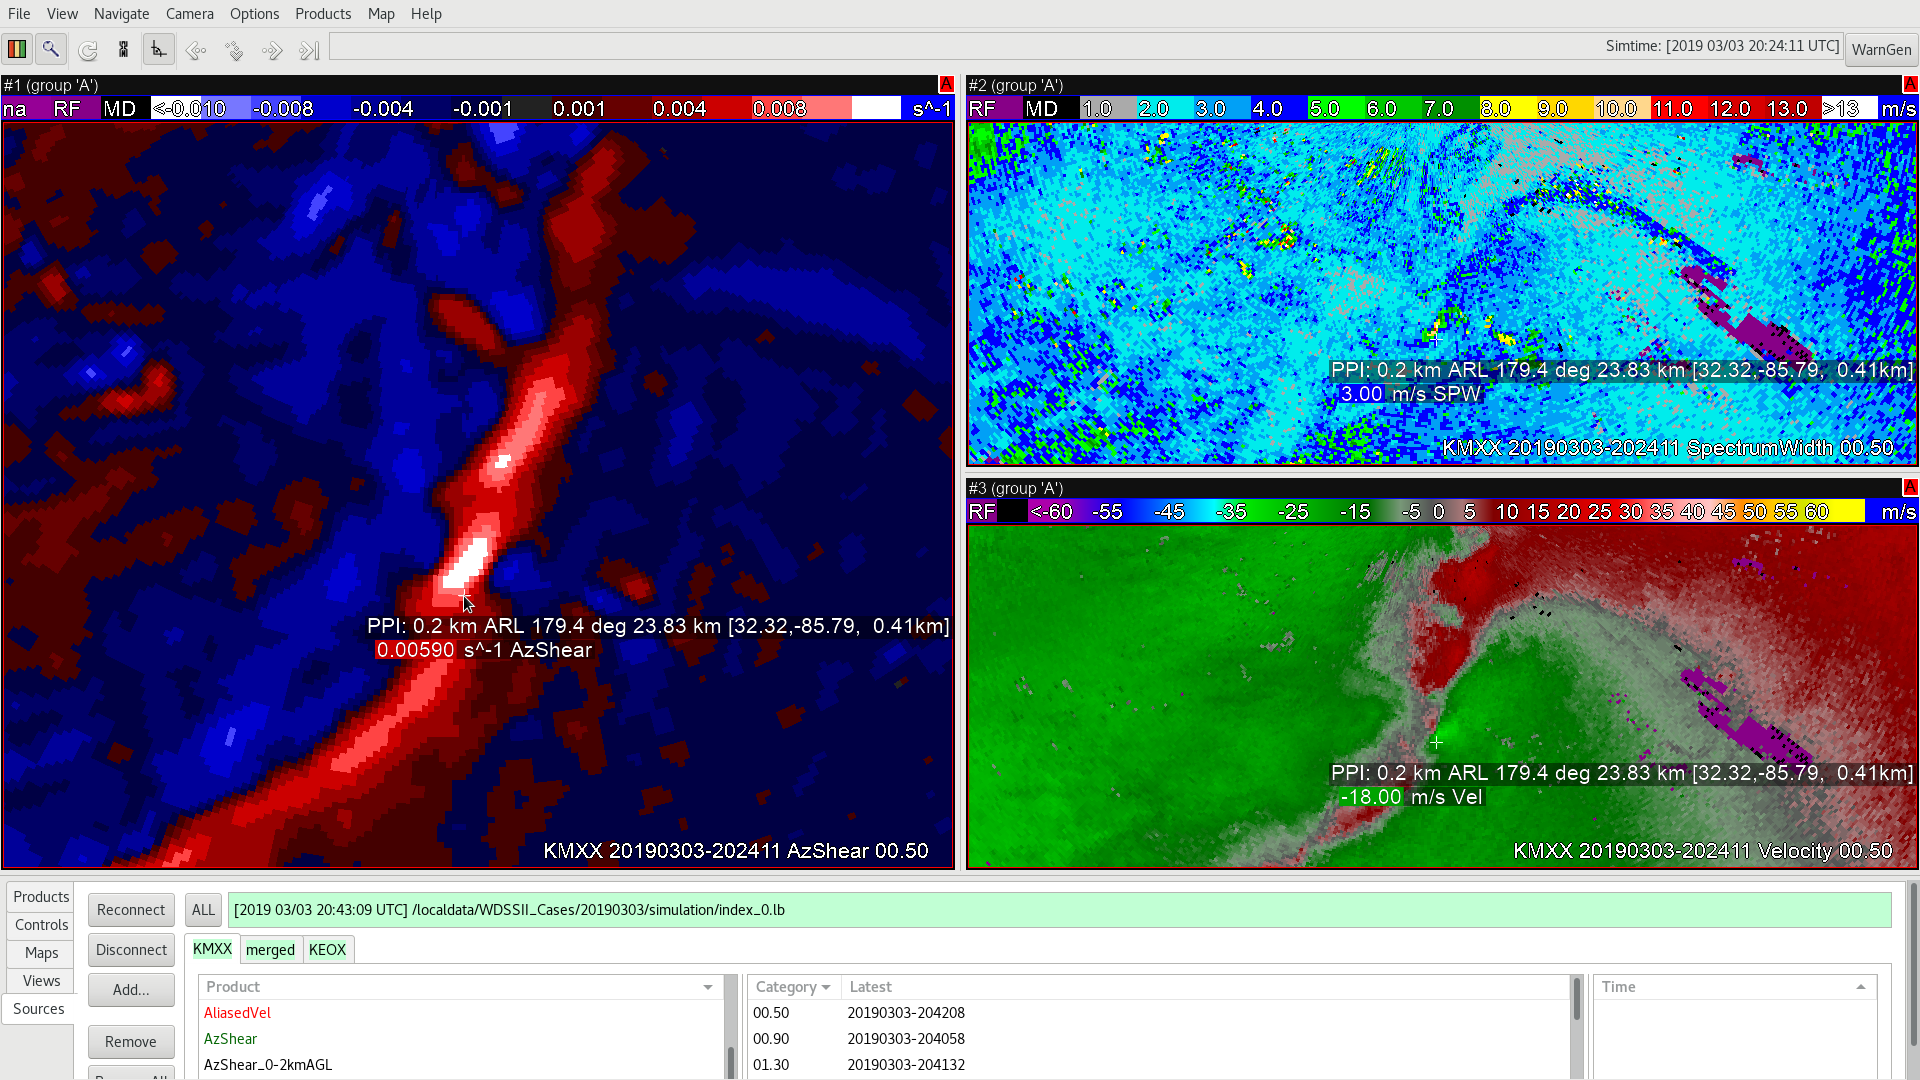
The case above shows  different tornadic circulation developing, but this time to the south of the radar –  a different orientation of the convergent signature relative to the radar. In both of these first two cases, the eventual tornado had not touched down yet, but the AzShear values were quite different. Training on zero isodop and how its orientation relative to the radar affects AzShear should be created for users before this product is used operationally.

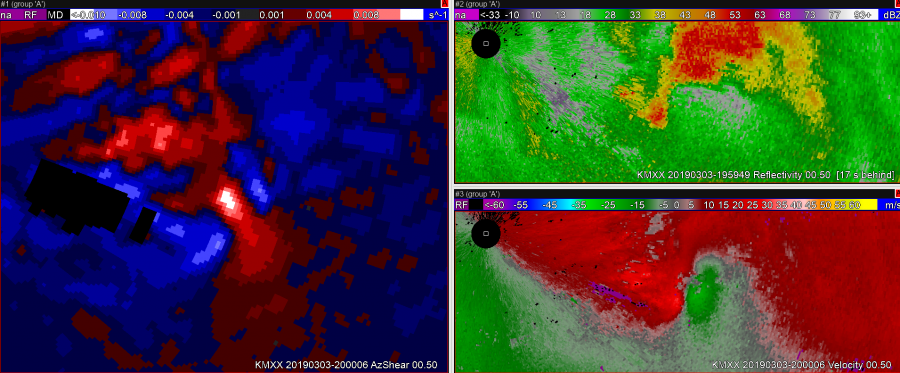
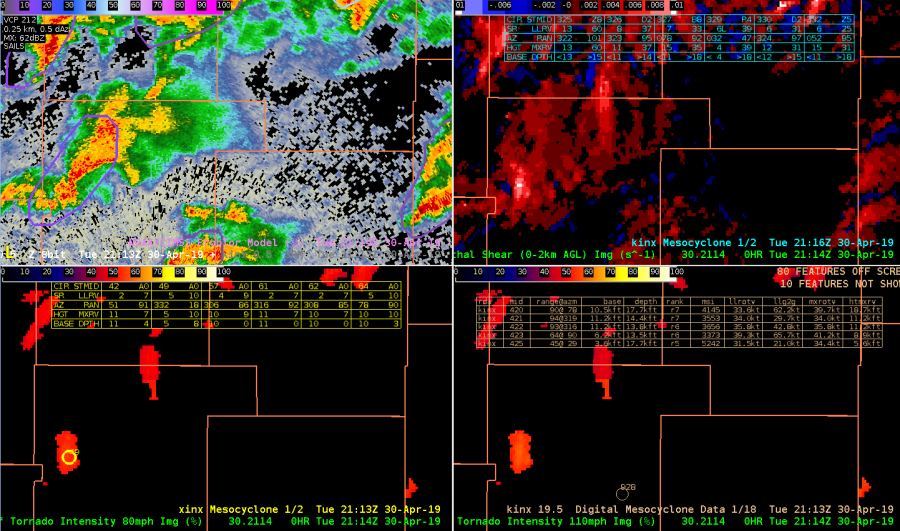
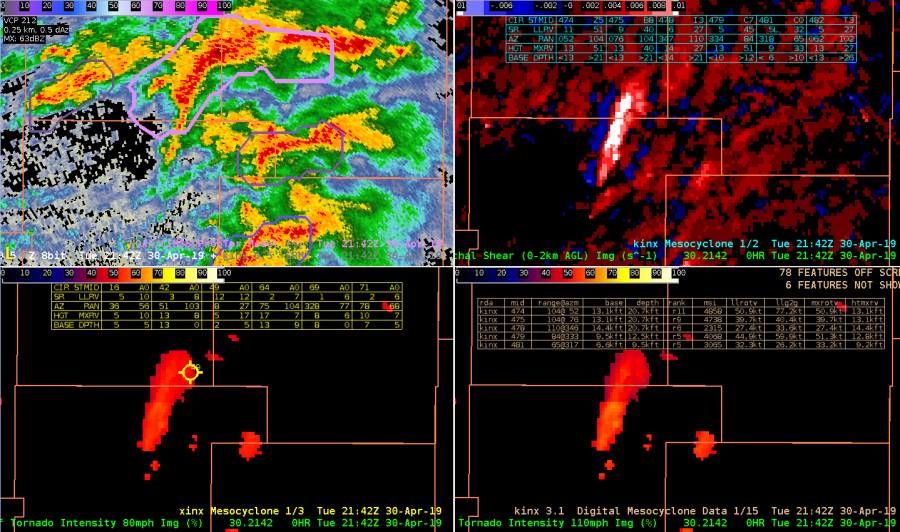
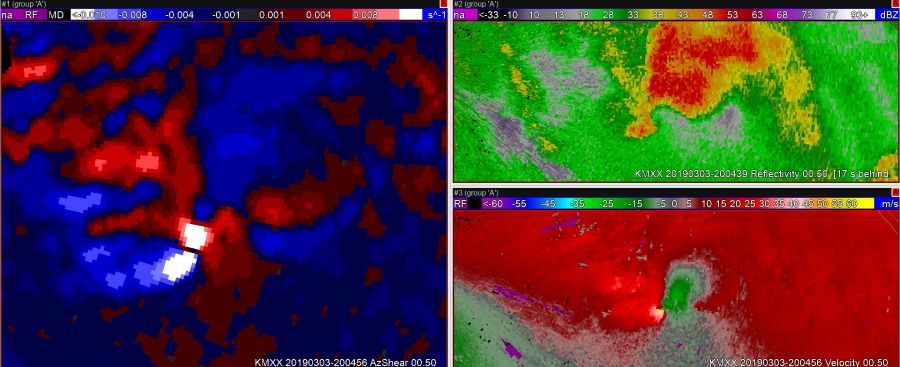
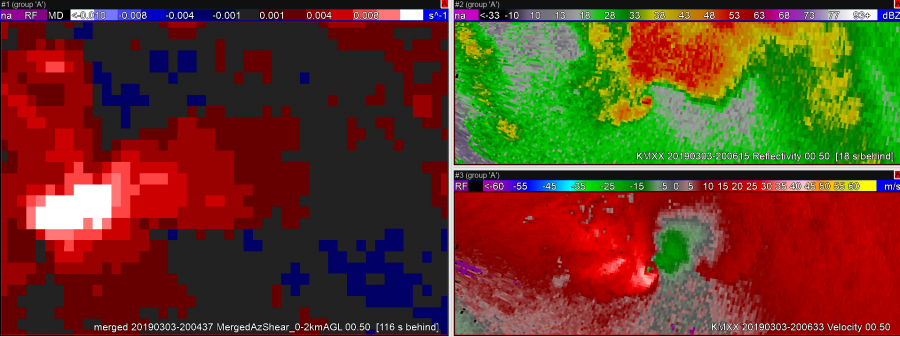
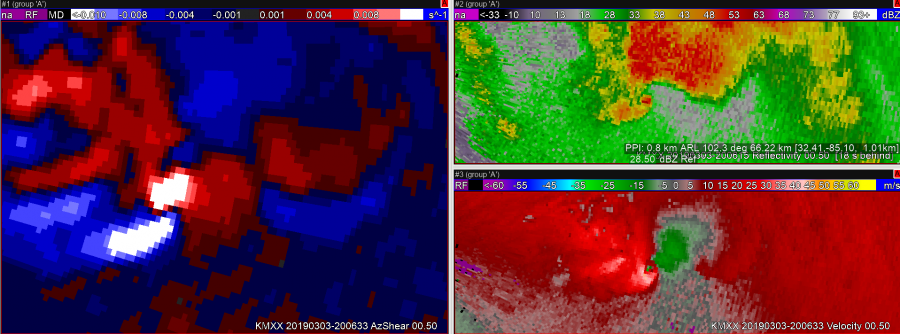
This image shows the first circulation a bit farther in time as the orientation of the convergence changed and AzShear value bins began to max out.

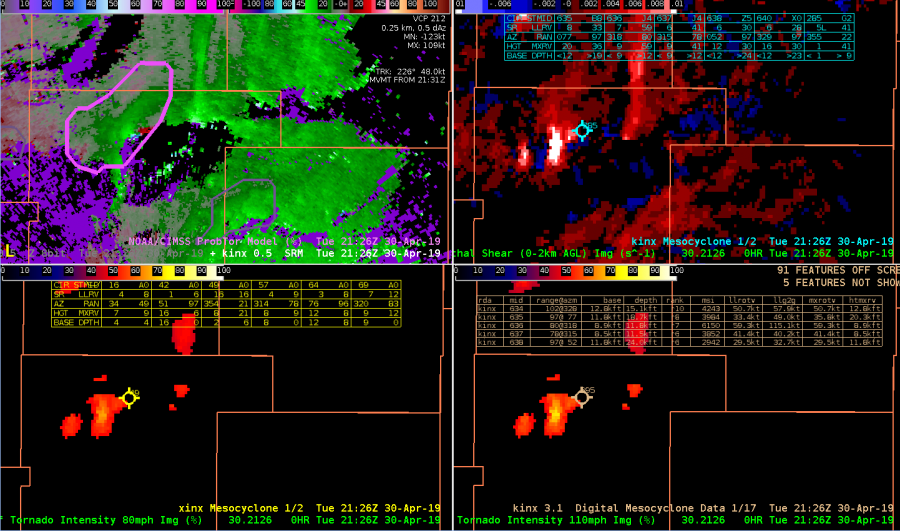
A case where using a color table with bins detracts from the usefulness of AzShear. There are two areas of high AzShear indicated, however very different things are going on in each of these locations. One is a strong tornado on ground the other is flanking line convergence. These two features should not have the same color if this product is to be used in operations. Consider a graduated color ramp with a high range instead of broad bins.
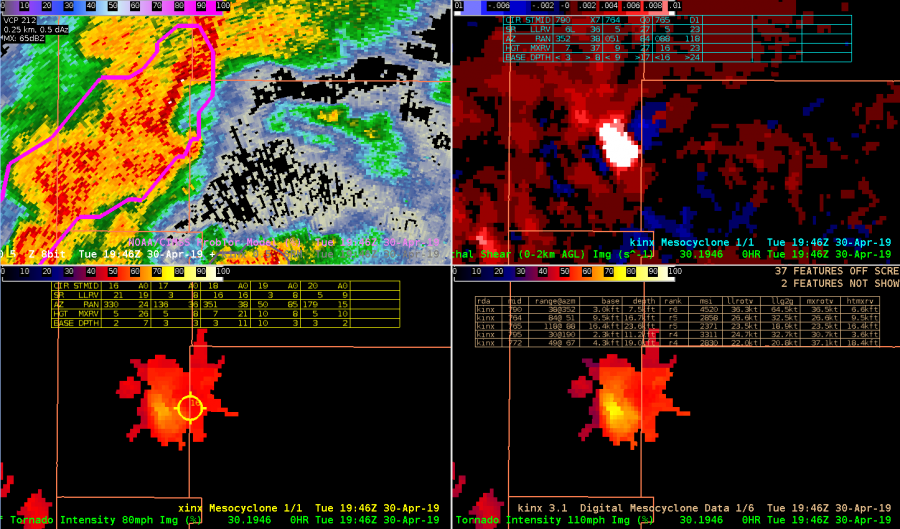
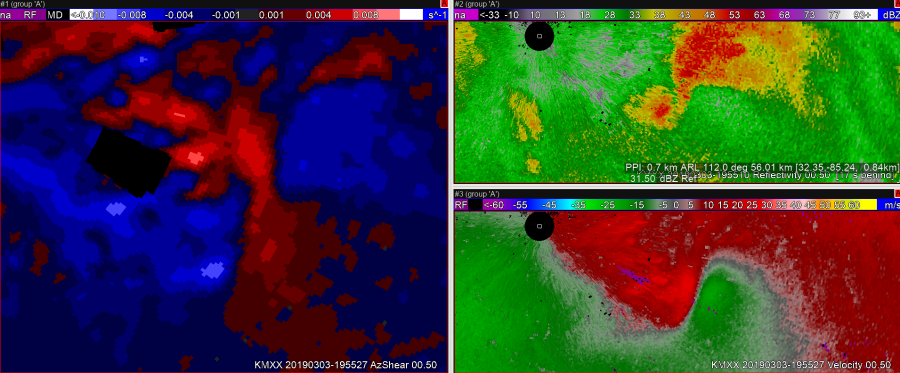
A case where the anticyclonic shear component is extremely prominent in AzShear. Are these regions useful for forecasters focusing on the tornado? Are they more of a distraction? They could be a distraction in some situations.

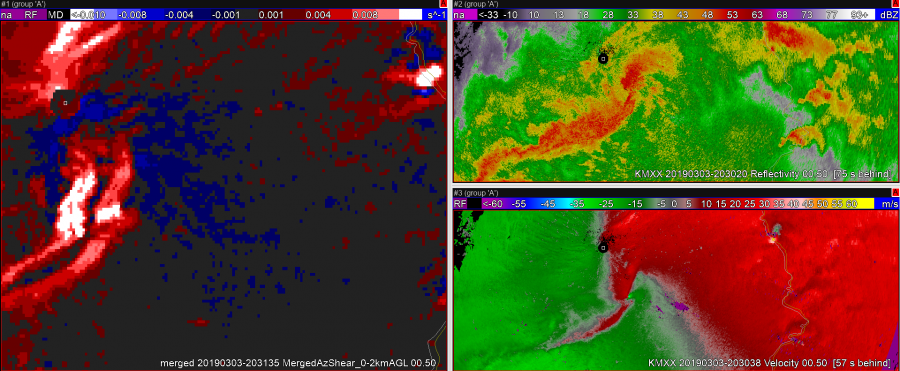
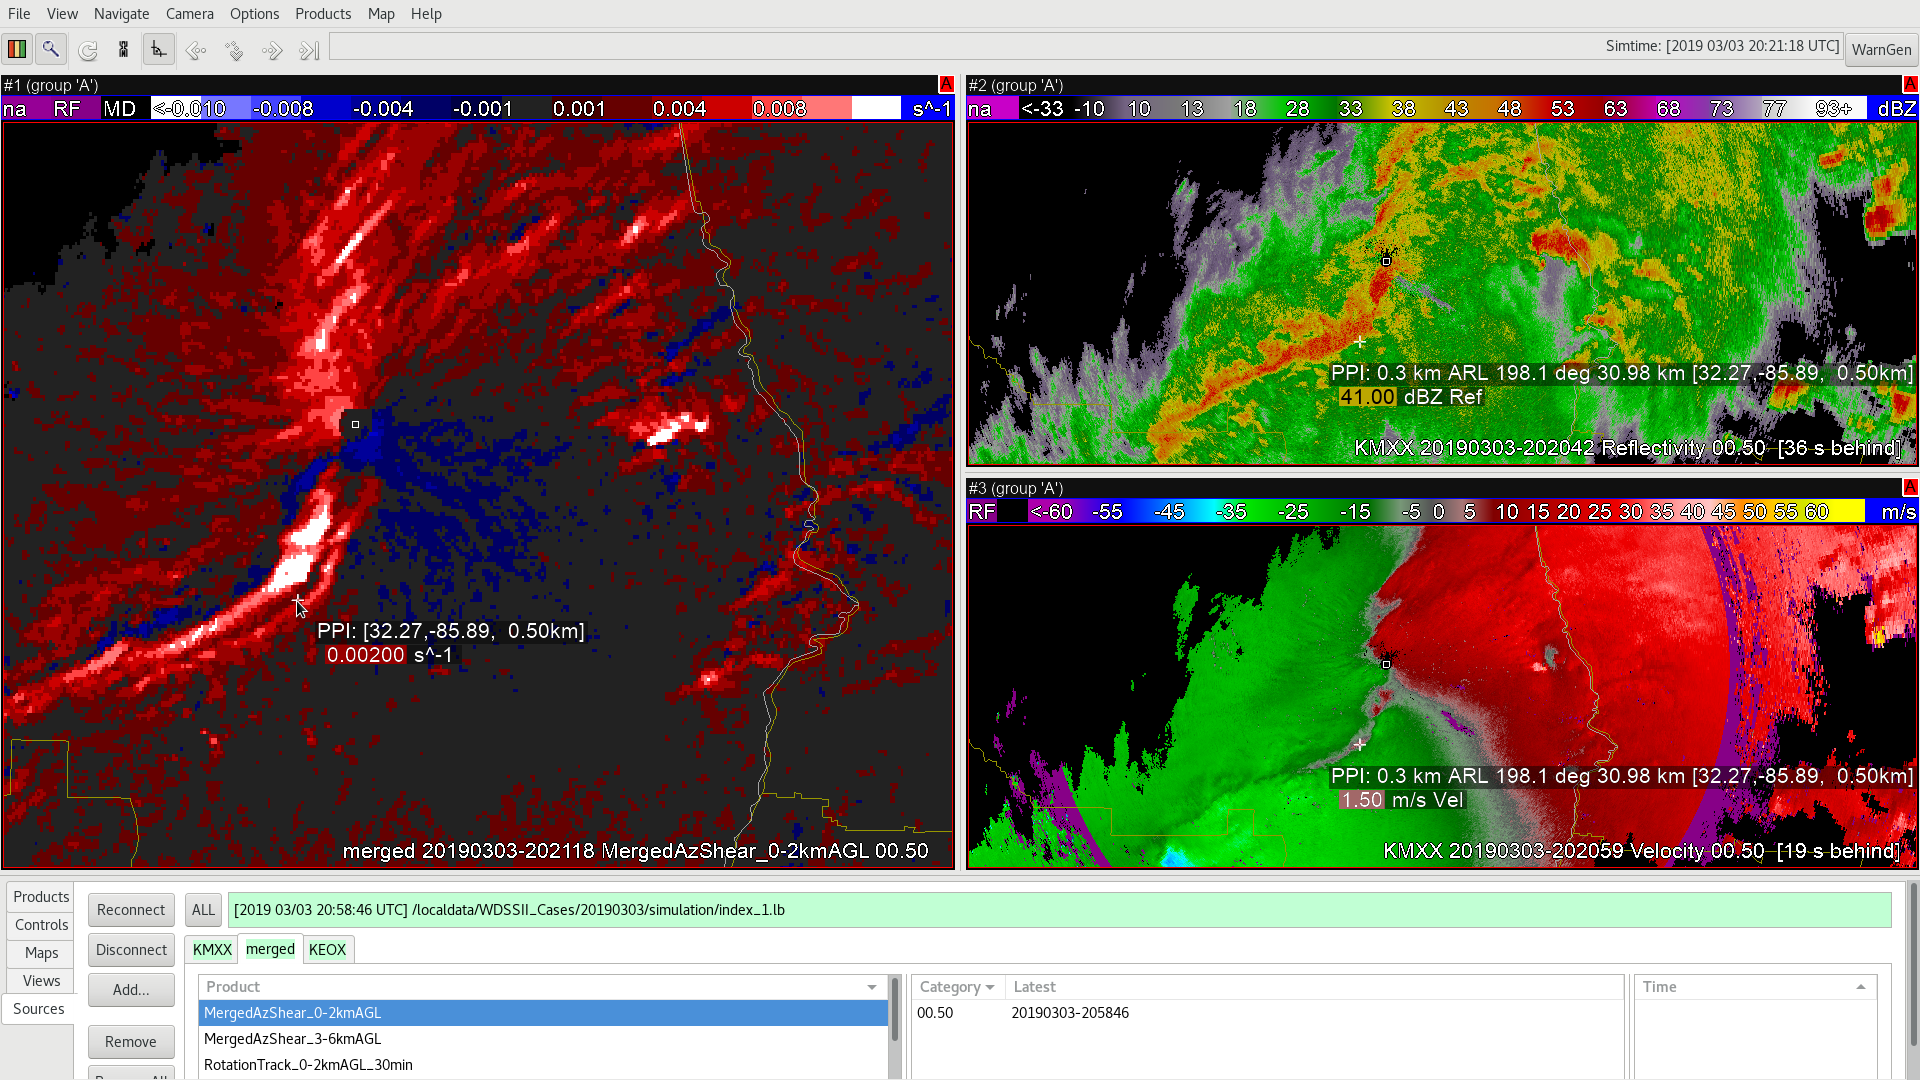
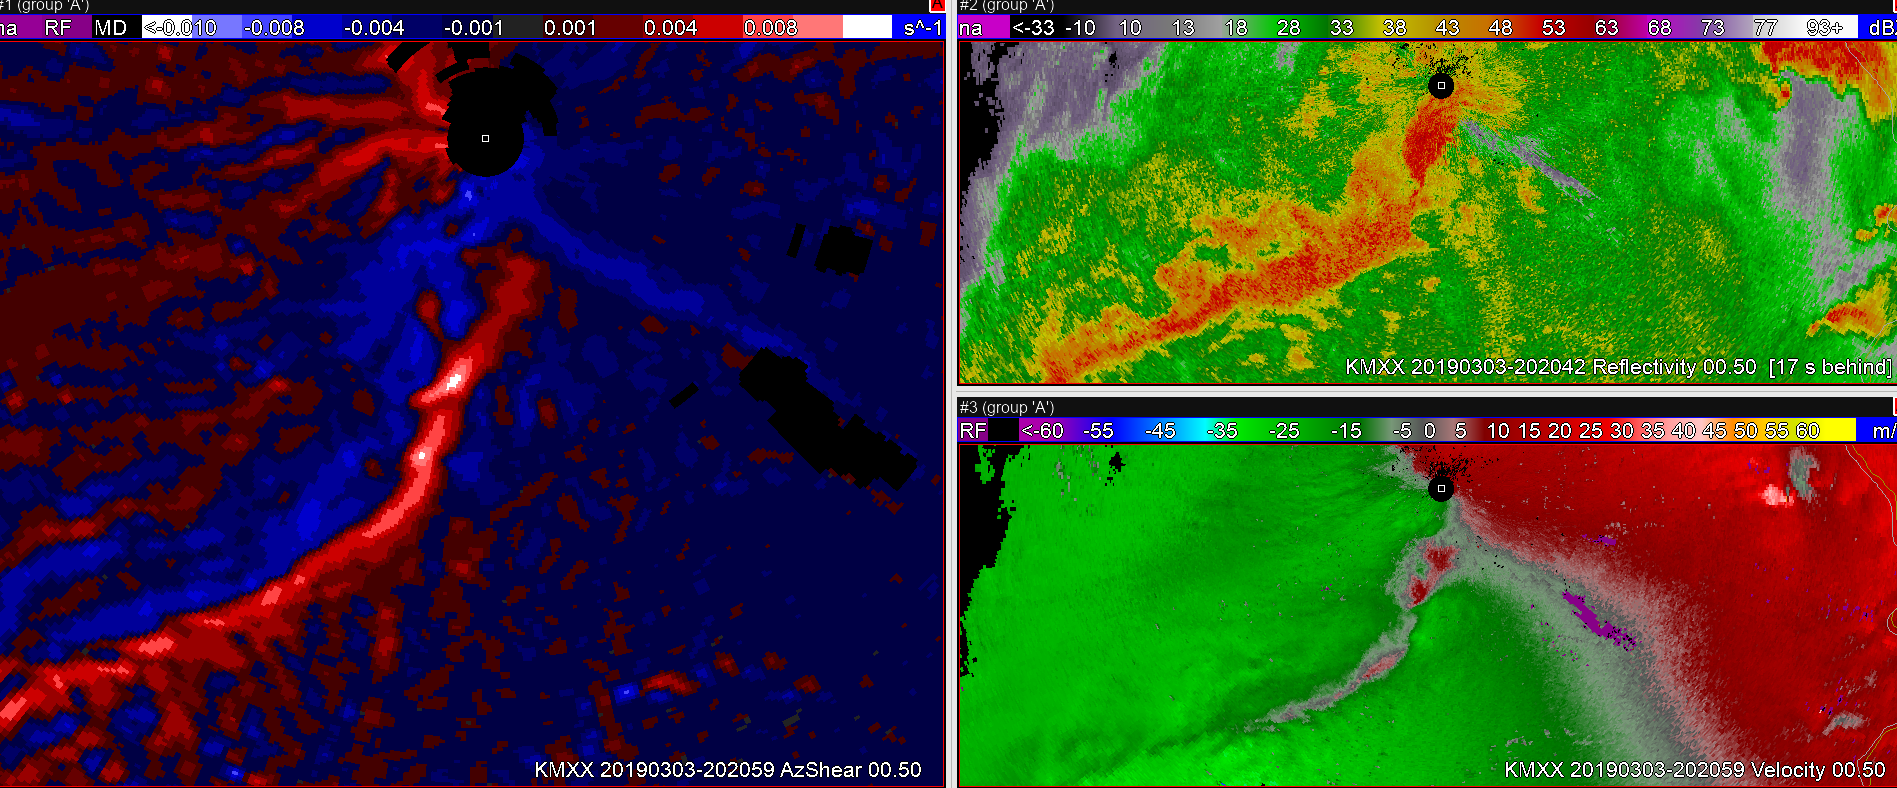
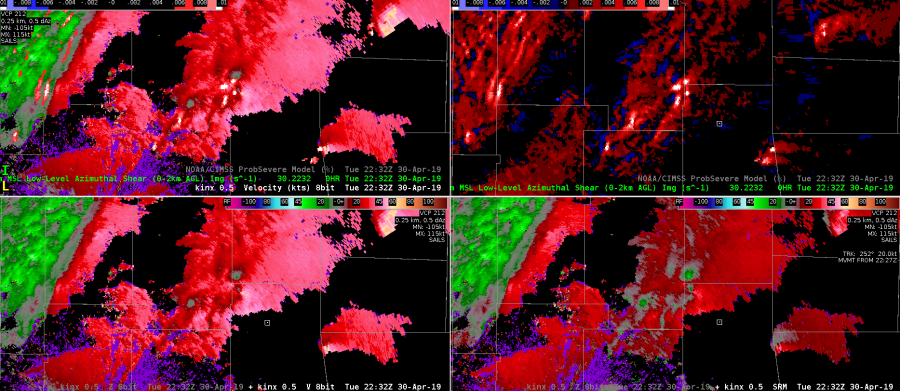
The two above images compare 0-2 AzShear (top) and single scan AzShear (bottom). Due to multiple sampling by multiple radars, it appears as though 4 different iterations of the squall line shear boundary are plotted. This renders the merged 6646data almost useless for interpretation purposes. The single scan data removes this issue. Also from these screen grabs, it appears as though the farthest east scan is coming from the KMX, the single scan site used here.

The two examples above show the benefits of single radar versus merged once again. The merged azshear core is several miles behind the circulation center at this time. The single radar data follows the current velocity scan as expected. In a time-sensitive warning operation scenario, knowing this I would likely use the single radar product exclusively.


-Dusty Davis

Remember to look underneath the hood

Here’s another example where a casual look at ProbTor might cause some confusion. Flow parallel to the boundary across the OKC metro eventually won out and the semi-discrete cells merged into a messy, slow-moving mess shortly before 22z. At 2148z, ProbTor peaked at 74% for the mass of convection just NE of OKC. However, KTLX velocity showed no immediate areas of concern. The answer to the high ProbTor was found in the 0-2km merged AzShear product. AzShear showed an enhanced area of shear to the NE of OKC near Spencer with generally convergent and broad flow. This is a good example of how ProbTor can be useful in operations: it quickly highlights areas for further investigation that can either be confirmed or thrown out with a very quick interrogation of the base data. In this case, ProbTor worked well, it was just biased by the abnormal/noisy AzShear data.

–Stanley Cupp

2148z KTLX base refl (top), base velocity (middle), and 0-2km AzShear (bottom) with 74% ProbTor contour overlaid on each

Why hello friend – merging supercells into a single ProbTor Object


Here a strengthening southern supercell invaded the personal space of its “more aged” northern neighbor. The merger did not change the  ProbTor values of the original, stronger storm (90%) but did eventually show a slightly lower value (87%) despite the southern storm becoming more intense in rotation. There were only subtle differences noted in the ingredients and nothing stood out as to why the Prob values dropped.

As for the new mesocyclone algorithm (xmda) the strength rank jumped to 25 (max value) at 23:32. It is difficult to follow the individual storms in the attribute table since they jump from page to page and are ordered by ID versus strength. Having the cell ID color coded at certain values (e.g. above 10 colored yellow, above 15 colored blue, etc.) would help more quickly discriminate the strongest mesocyclones, especially if you have to move to another page. ProbWind (lower right panel) continues to be very high for these supercells (consistently >90%) although no wind reports were received by SGF.

0-2km AzShear/ProbTor (UL), 3-6km AzShear/xmda (UR), HI/ProbHail (LL), Z/SRM/ProbWind (LR)

Az Shear Possibilities

I’ve seen some great promise from the low level az shear this week so far. One thing that I do not like about the default product is that it has a lot of noise/extra info in it that tends to clutter up your screen. An idea that I had was to filter more of the noise by making a large portion of the scale transparent. Take a glance at the velocity field and see how it matches up with the AZ shear extremes.

Shown here is a comparison of the default vs the “enhanced” low level az shear.

Another advantage I could see with only displaying the “extremes” would be the ability to include velocity data underneath the image. This can be especially useful since the MRMS data is feeding the AZ Shear. Why? Well the velocity couplet you are examining is likely to progress a bit “faster” using the baseline radar data rather than MRMS, so they likely will be right next to each other.

Az Shear overlay on Velocity Data

Other thoughts I have had going this route is possibly changing the “red” side of the color scale to something other than red so that it doesn’t match the color scale used by velocity data on radar. I did like a “yellow” scale as it did not largely conflict with the color scales expressed by the velocity data.

An attempt at a “yellow extremes” color table.

As a whole I think this product has some great potential at drawing your attention to portions of the storm very quickly.

South Beach

HWT day 2: 19:10 GLM and AzShear observations of Missouri tornadic supercell

Feature following zoom showing the GLM pulsing phenomena associated with intensification/weakening of a supercell in OK/MO. During the third pulse, a TOR warning was issued.

Case of CPTI values on a confirmed tornado near Miller, MO. No confirmed damage estimates yet, but TOR was confirmed at this time visually and with a TDS

Lightning jump preceding a tornado and then confirmed touchdown in MO
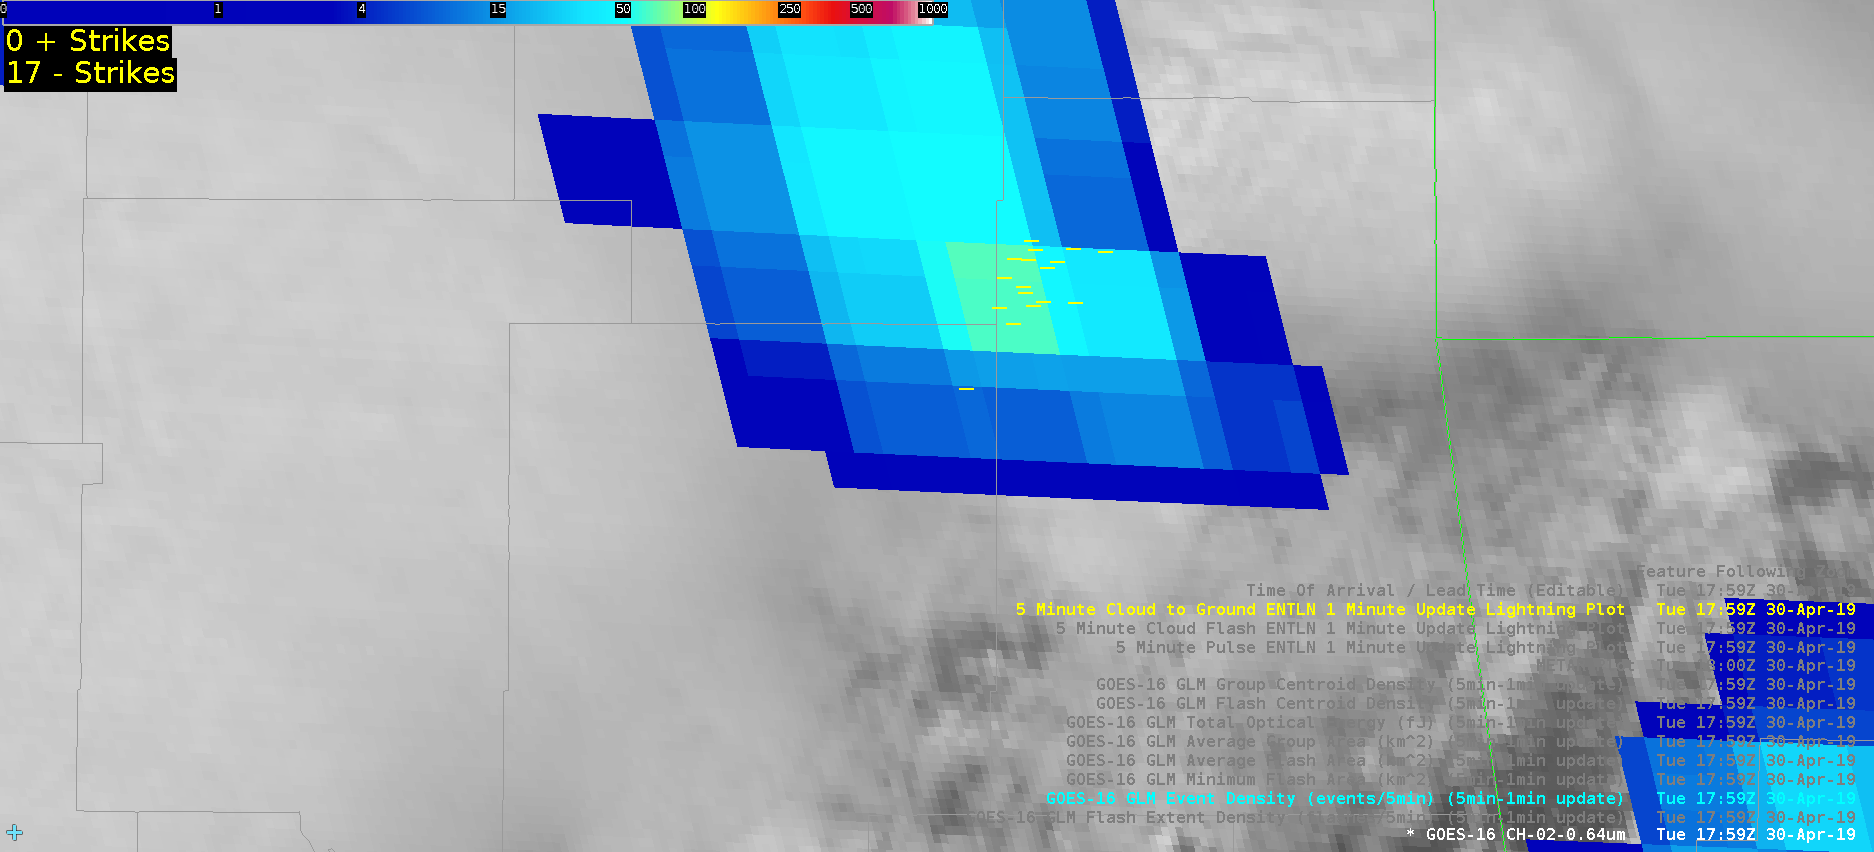
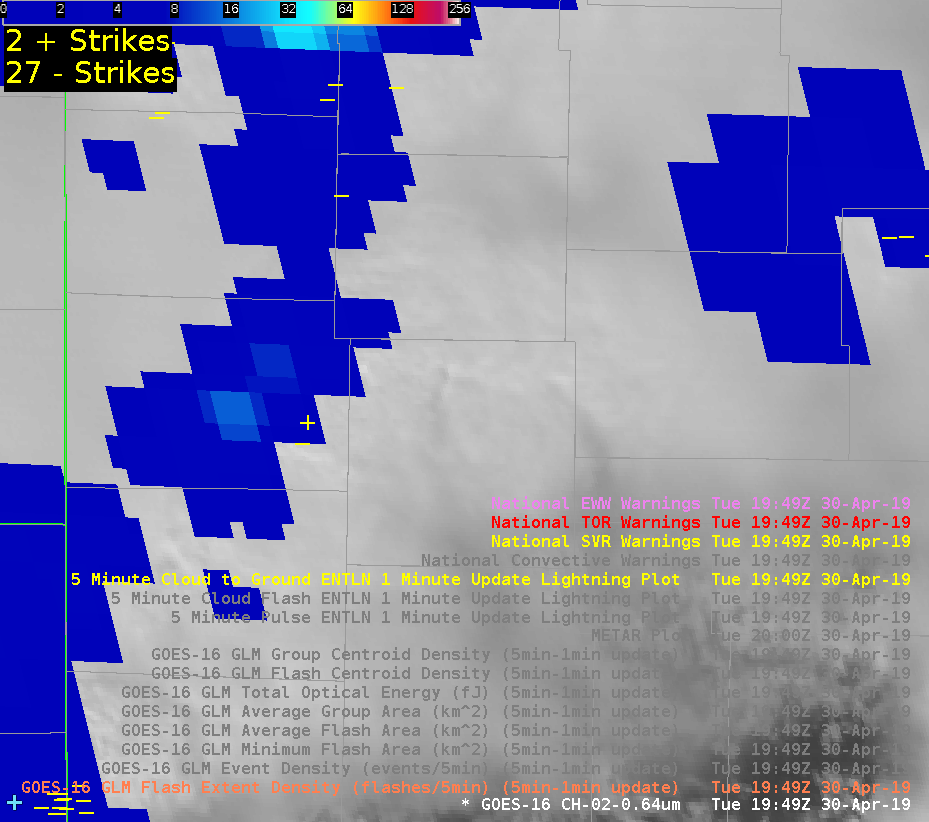
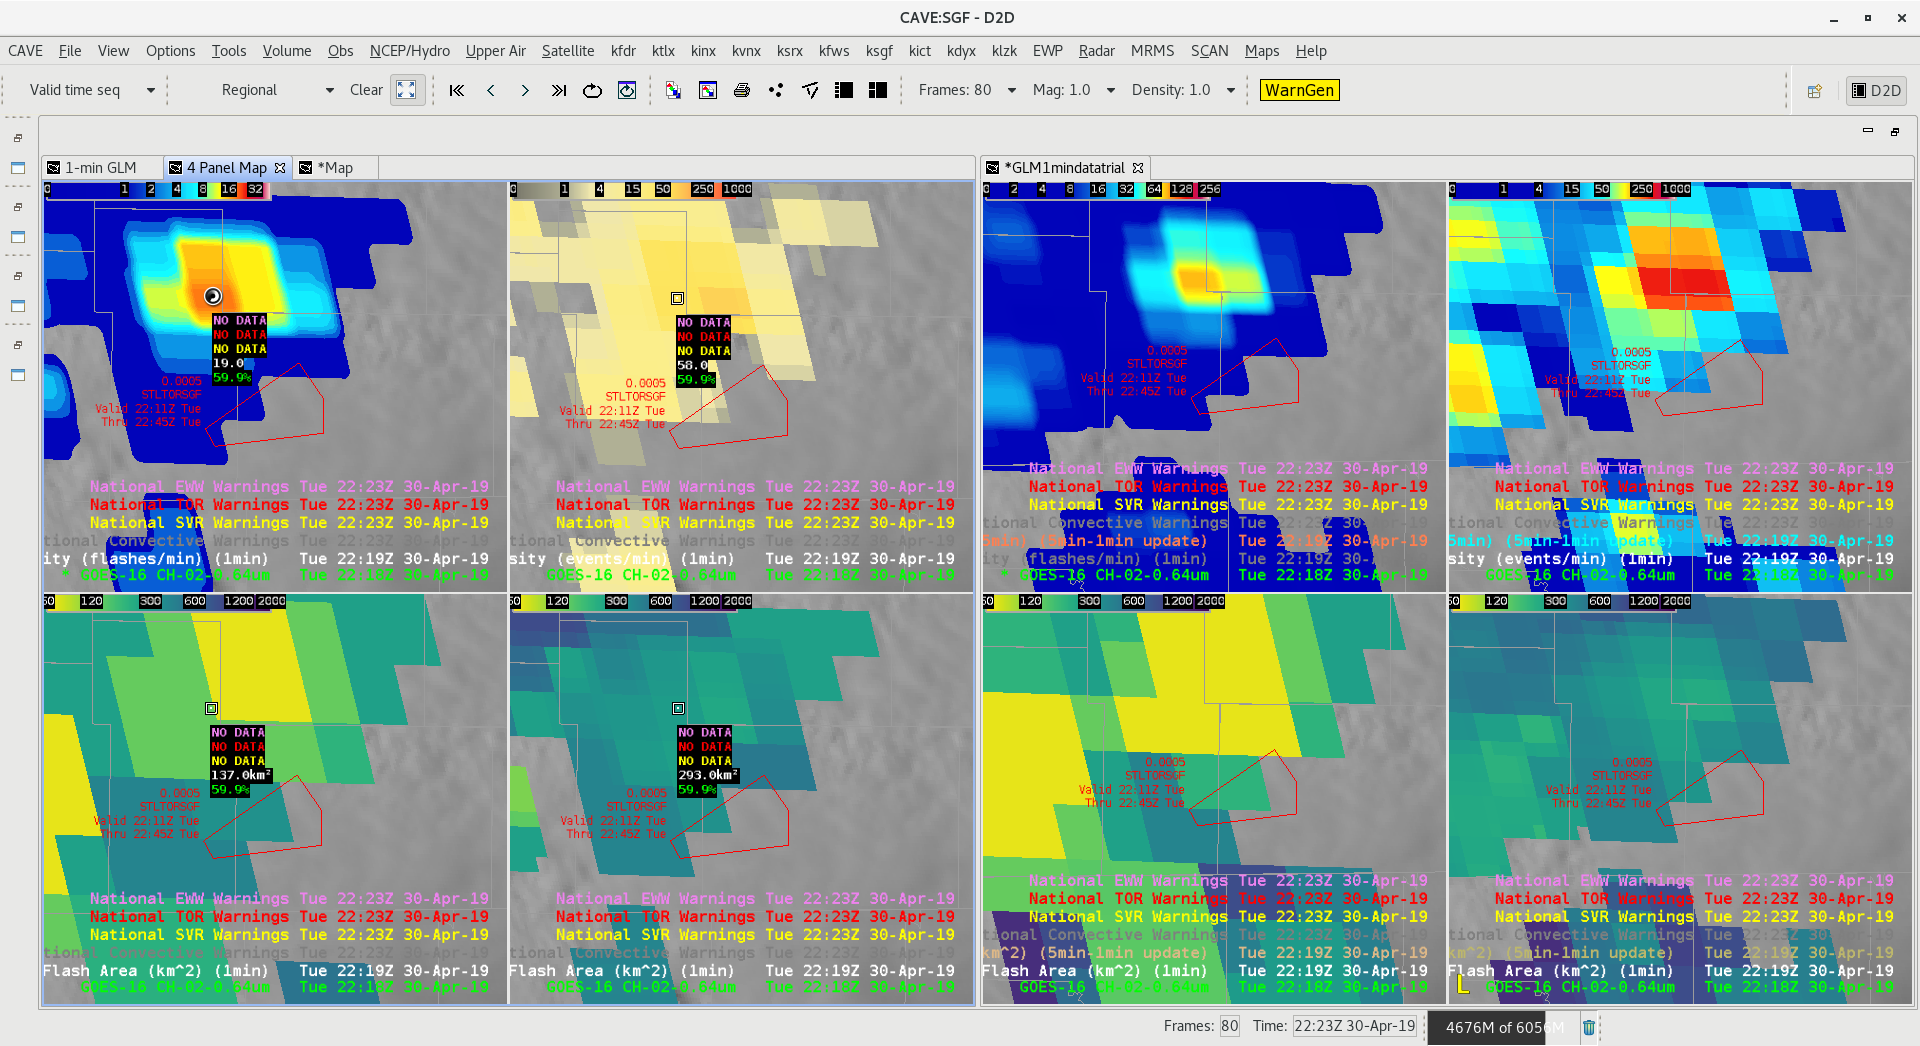
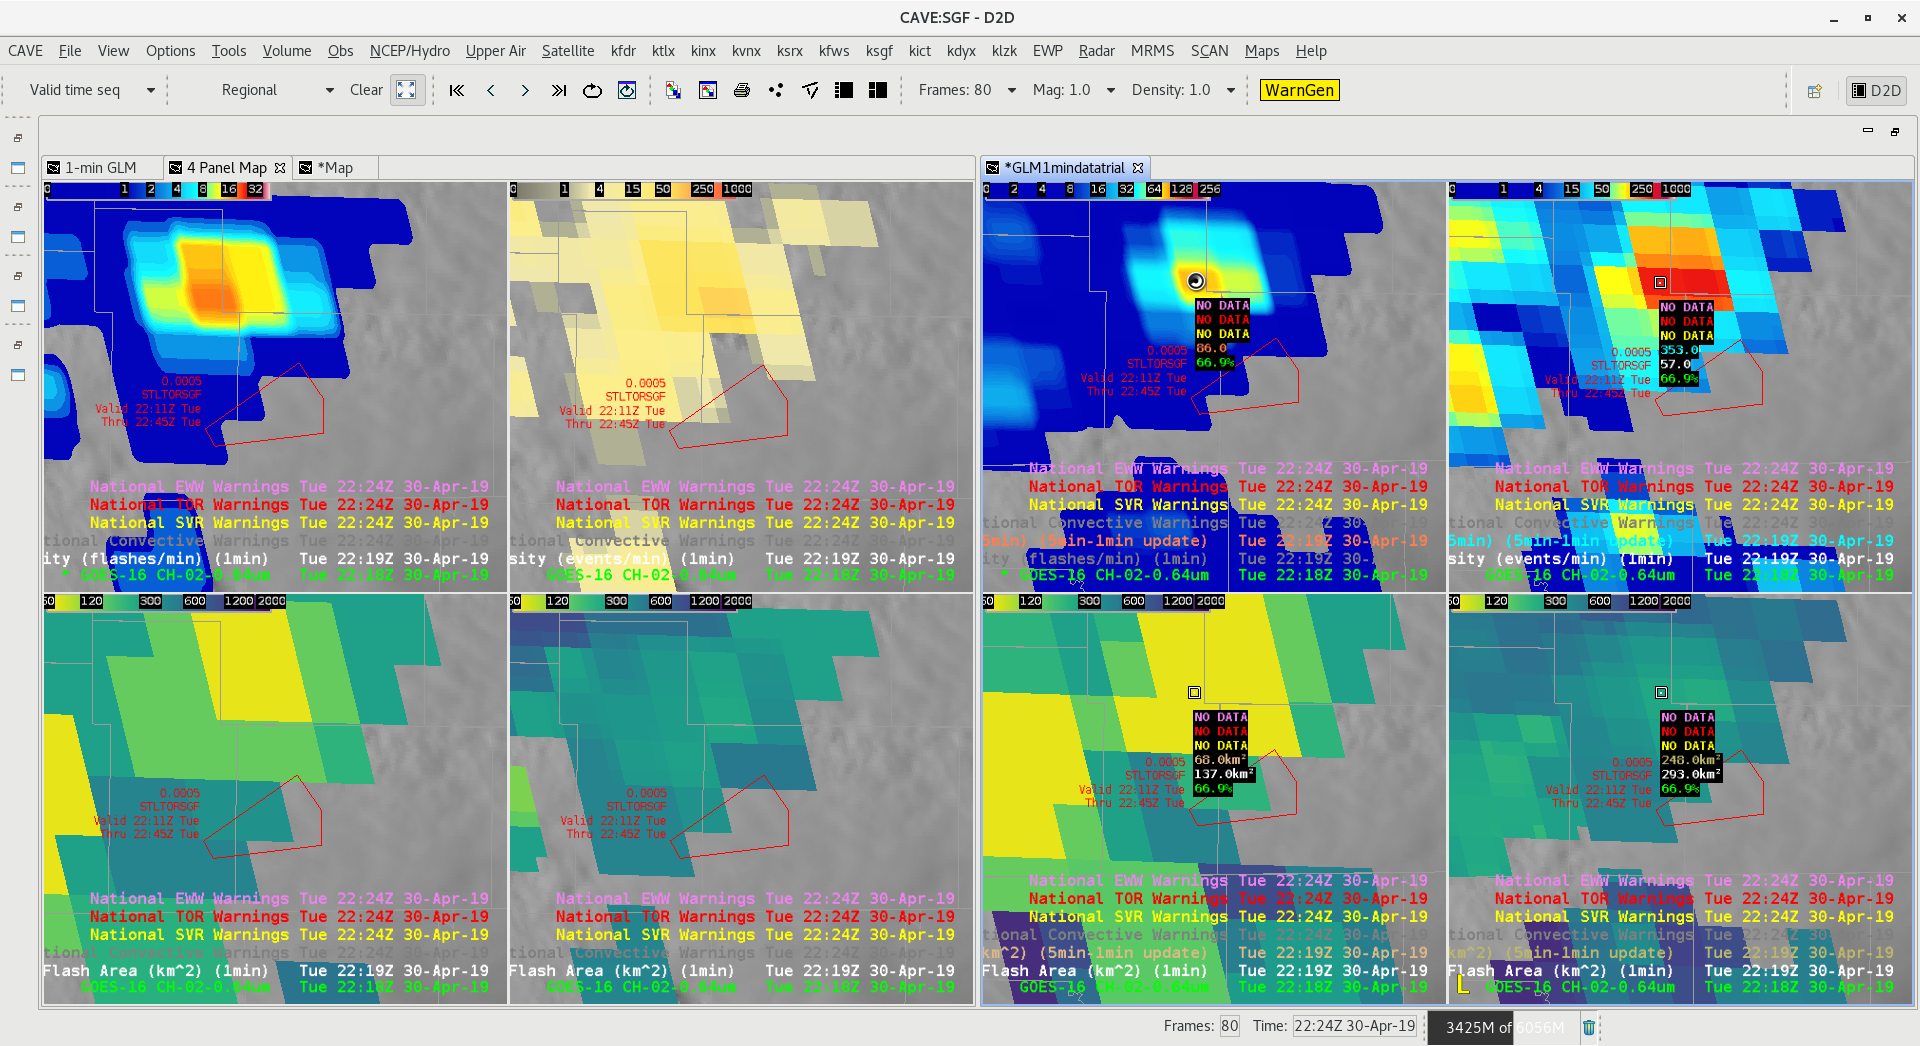
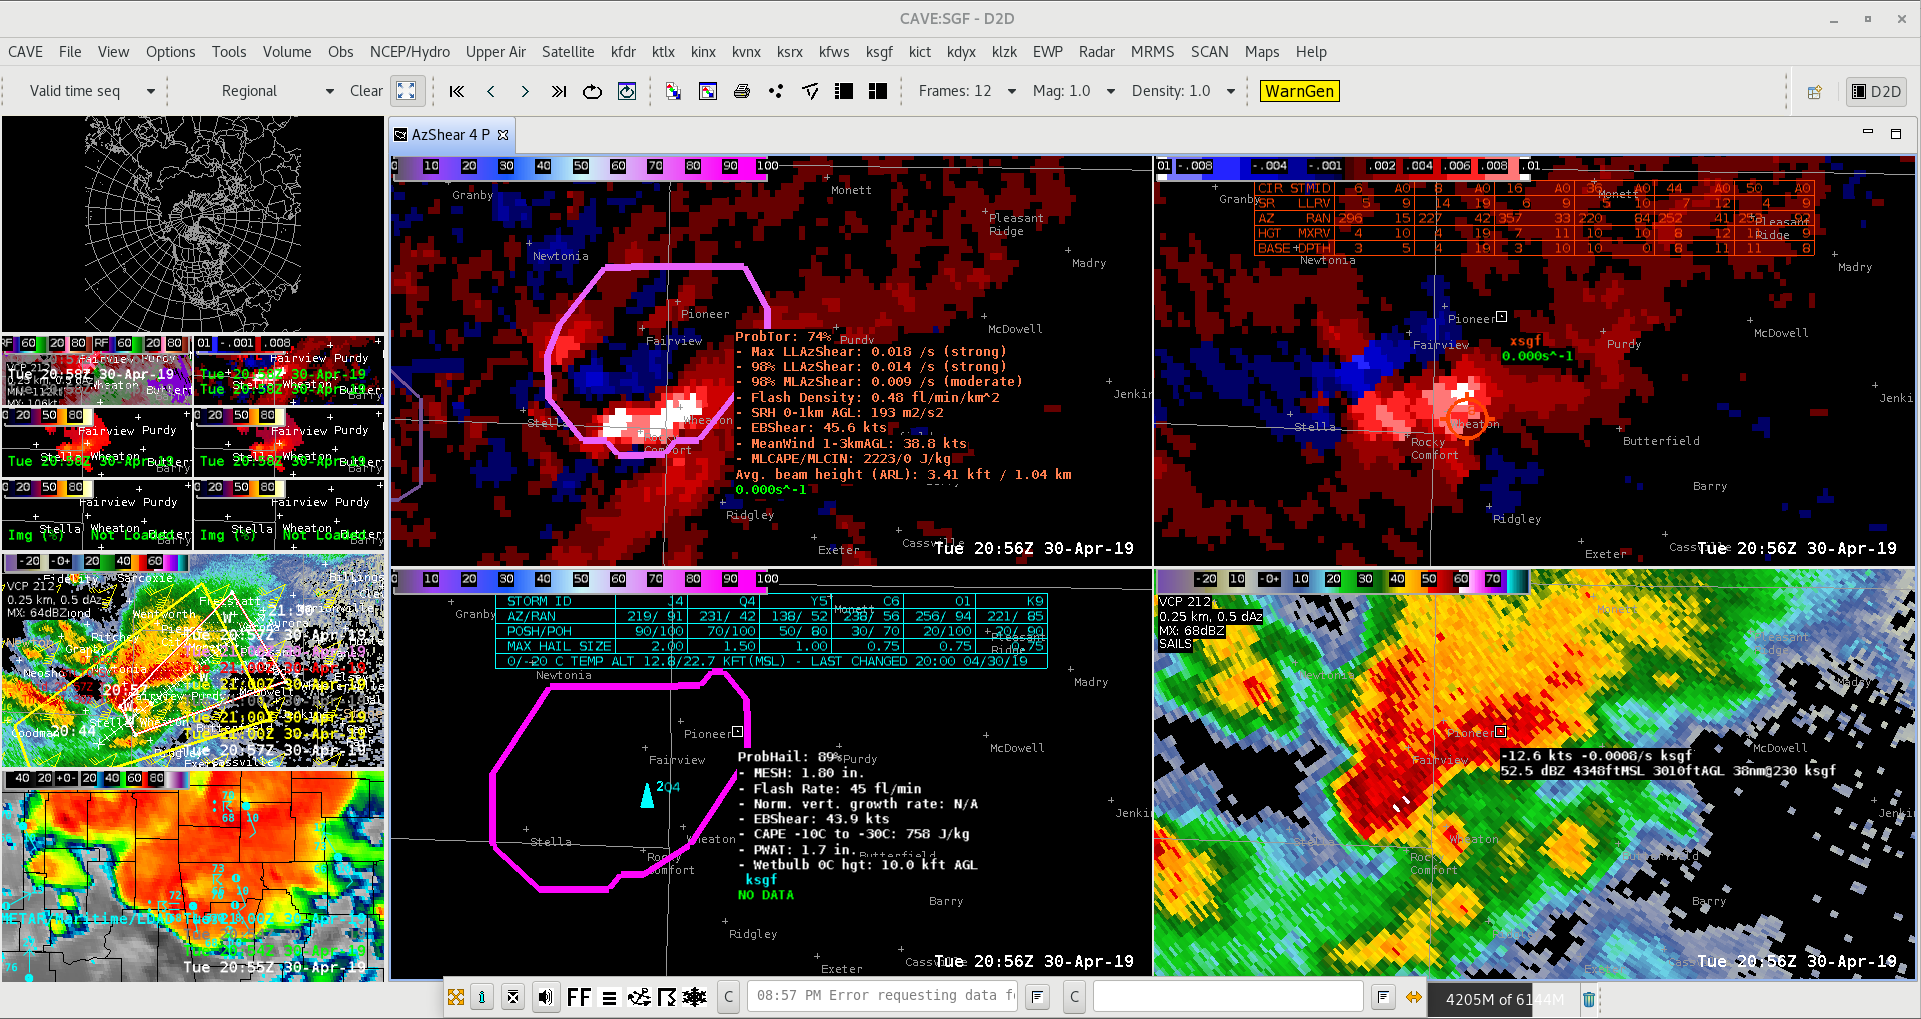
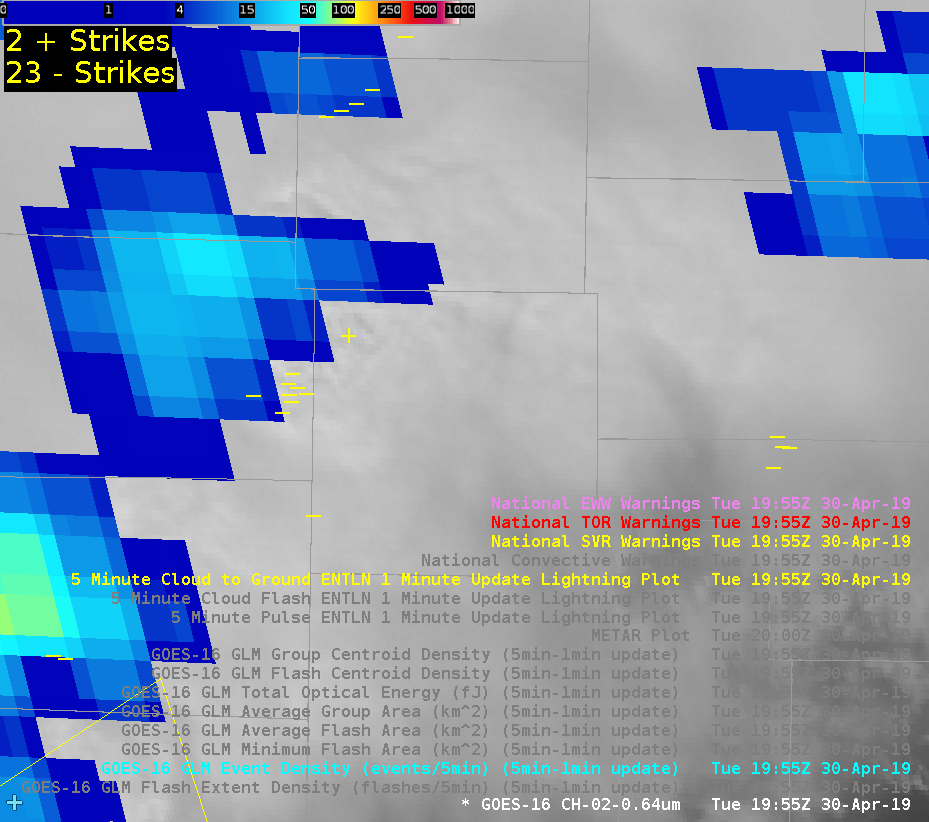
Event Density over the same cell

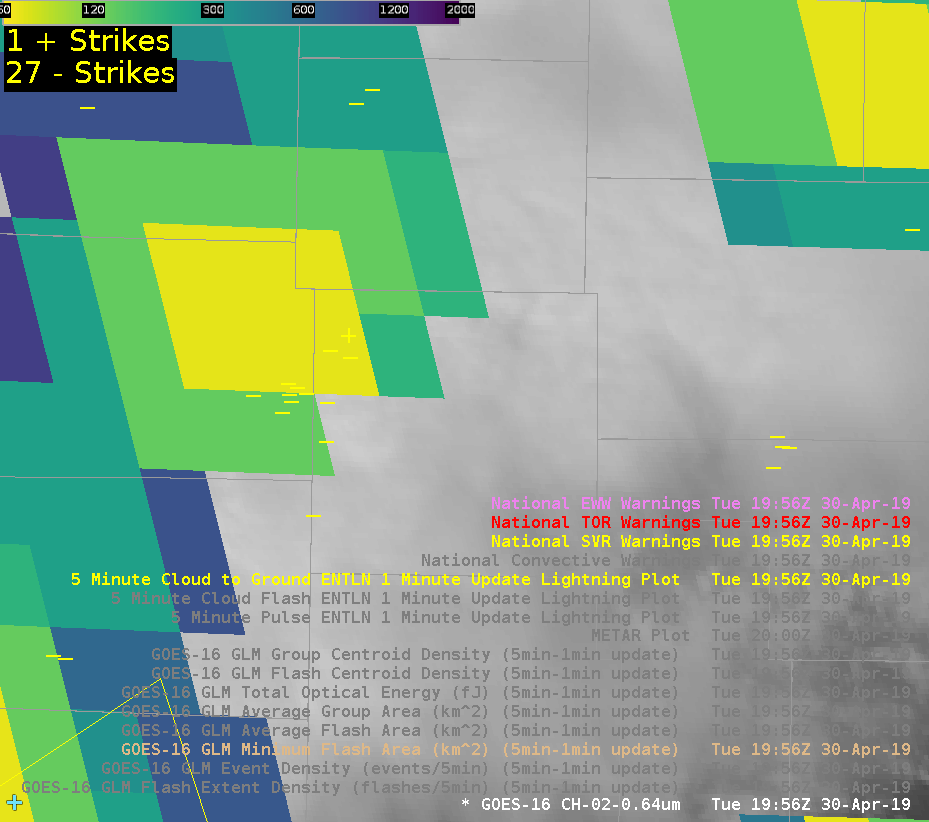
Minimum Flash area showing updraft core


Average Flash Area


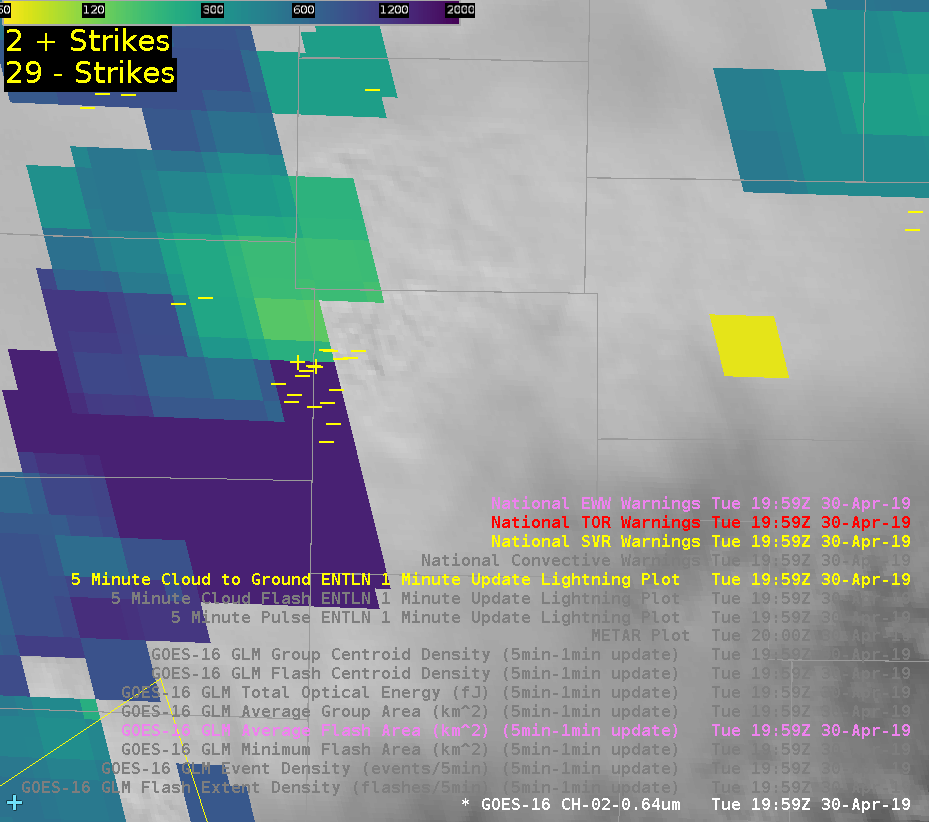
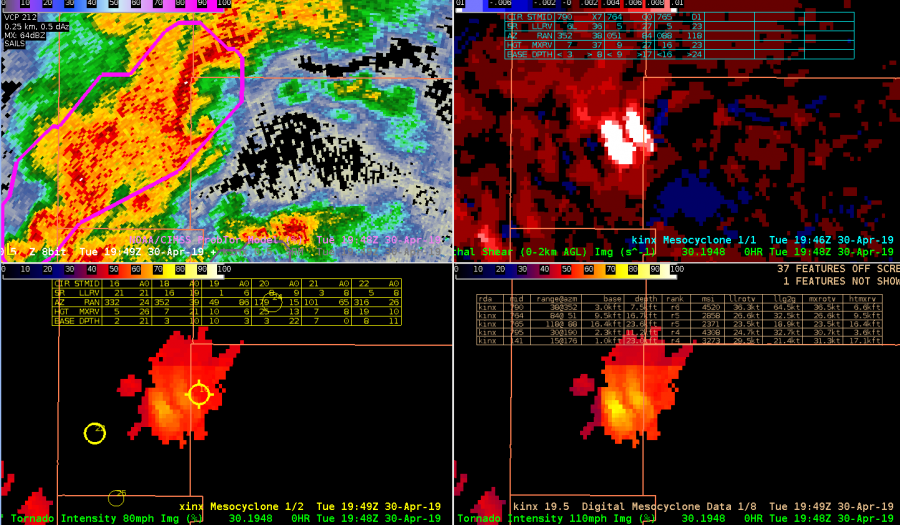
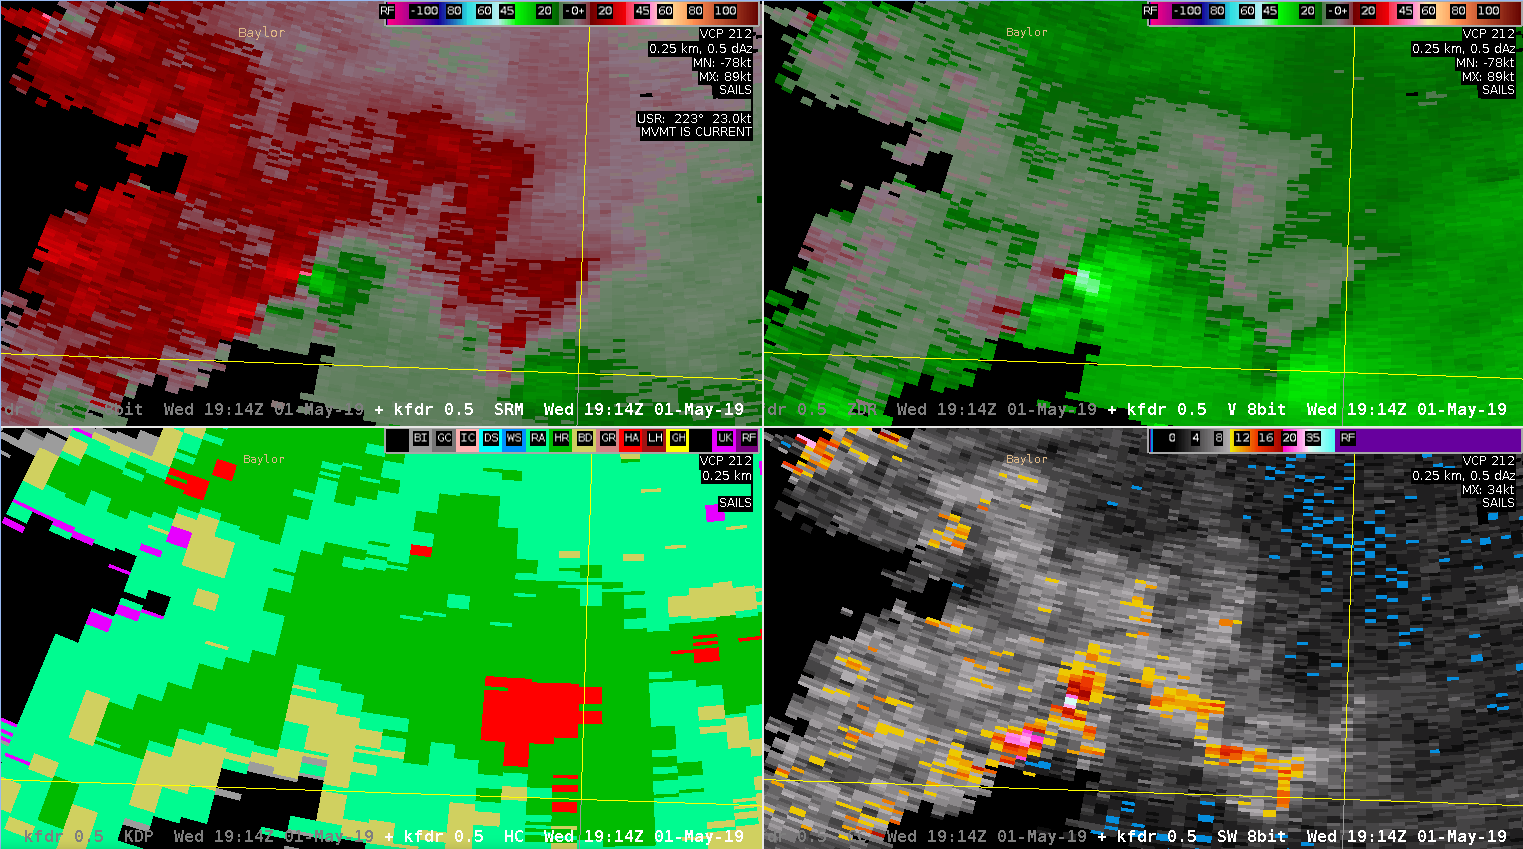
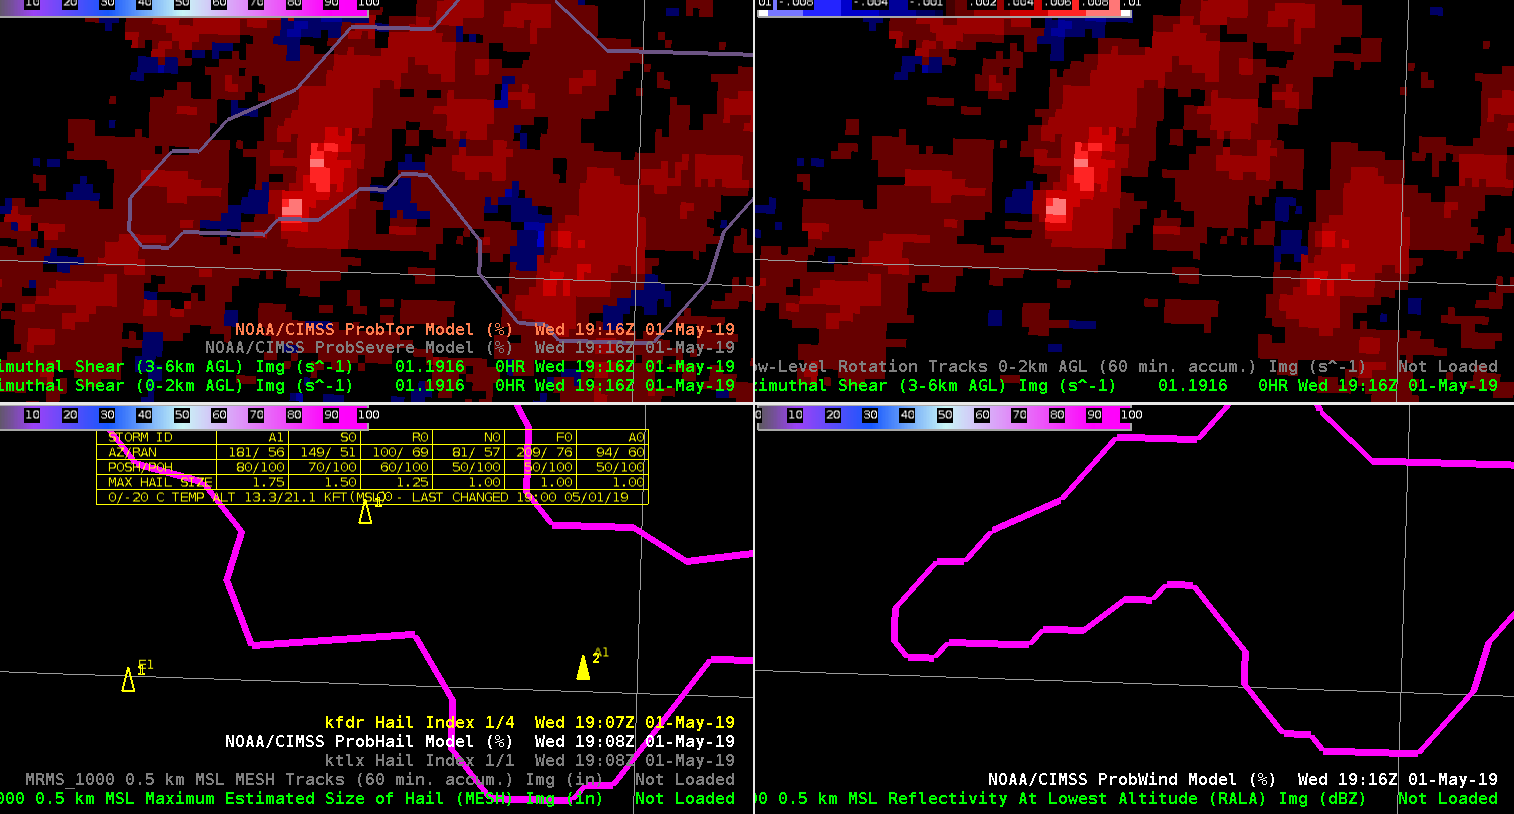
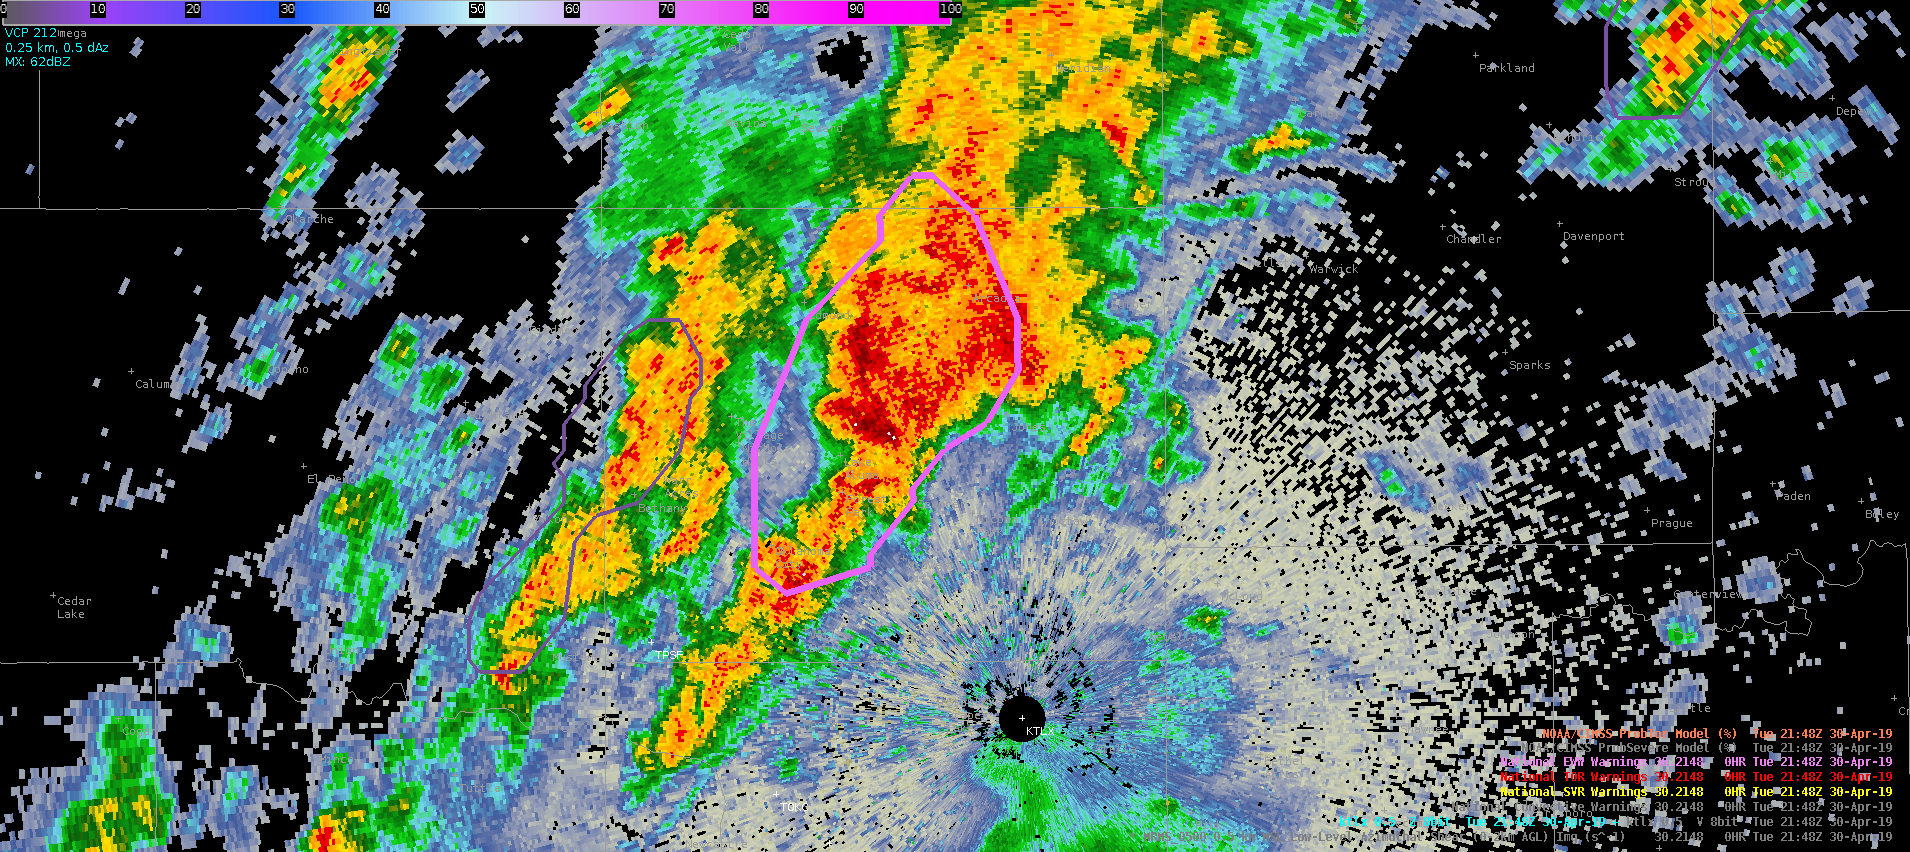
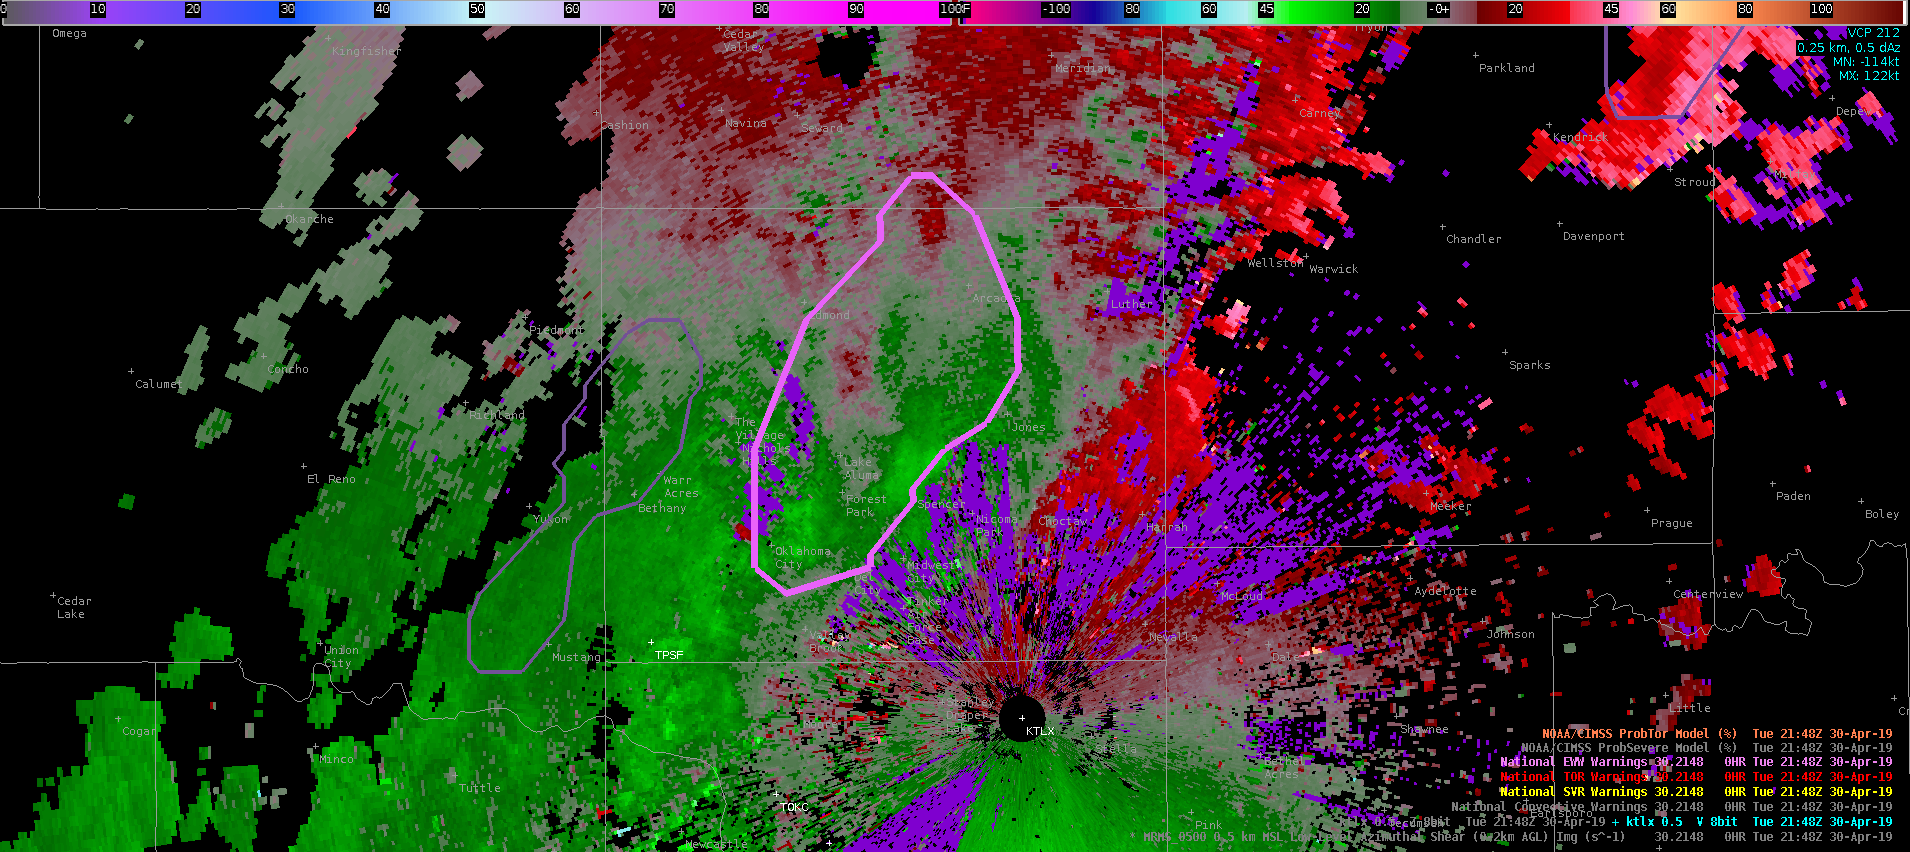
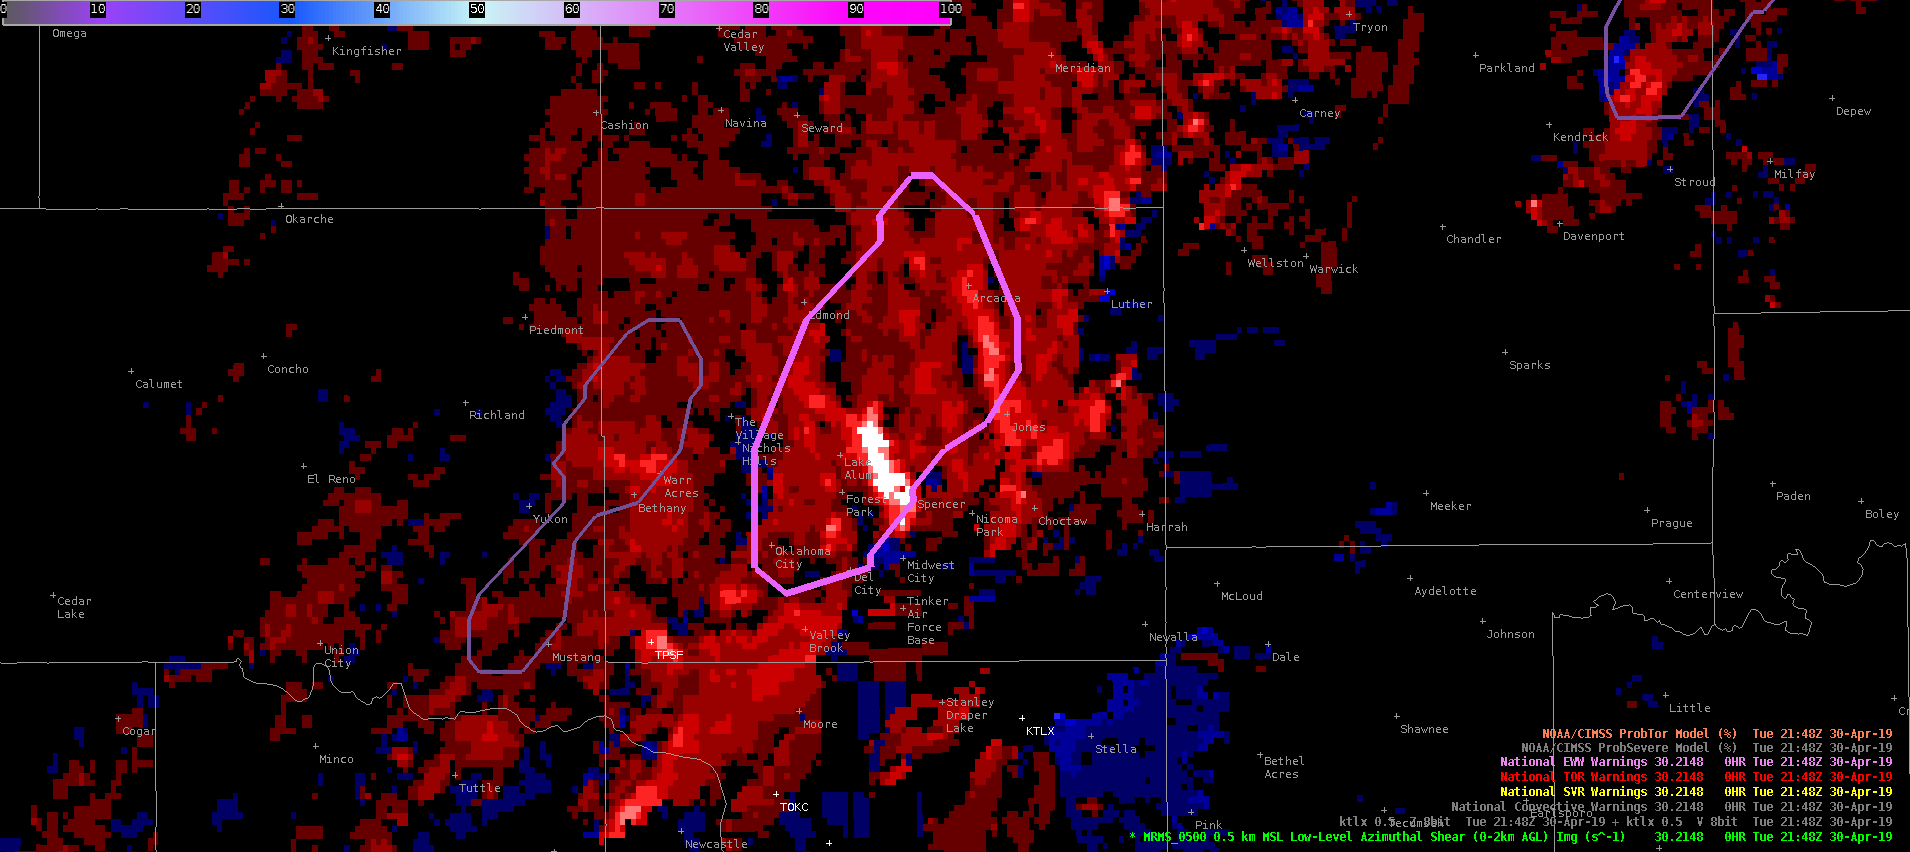
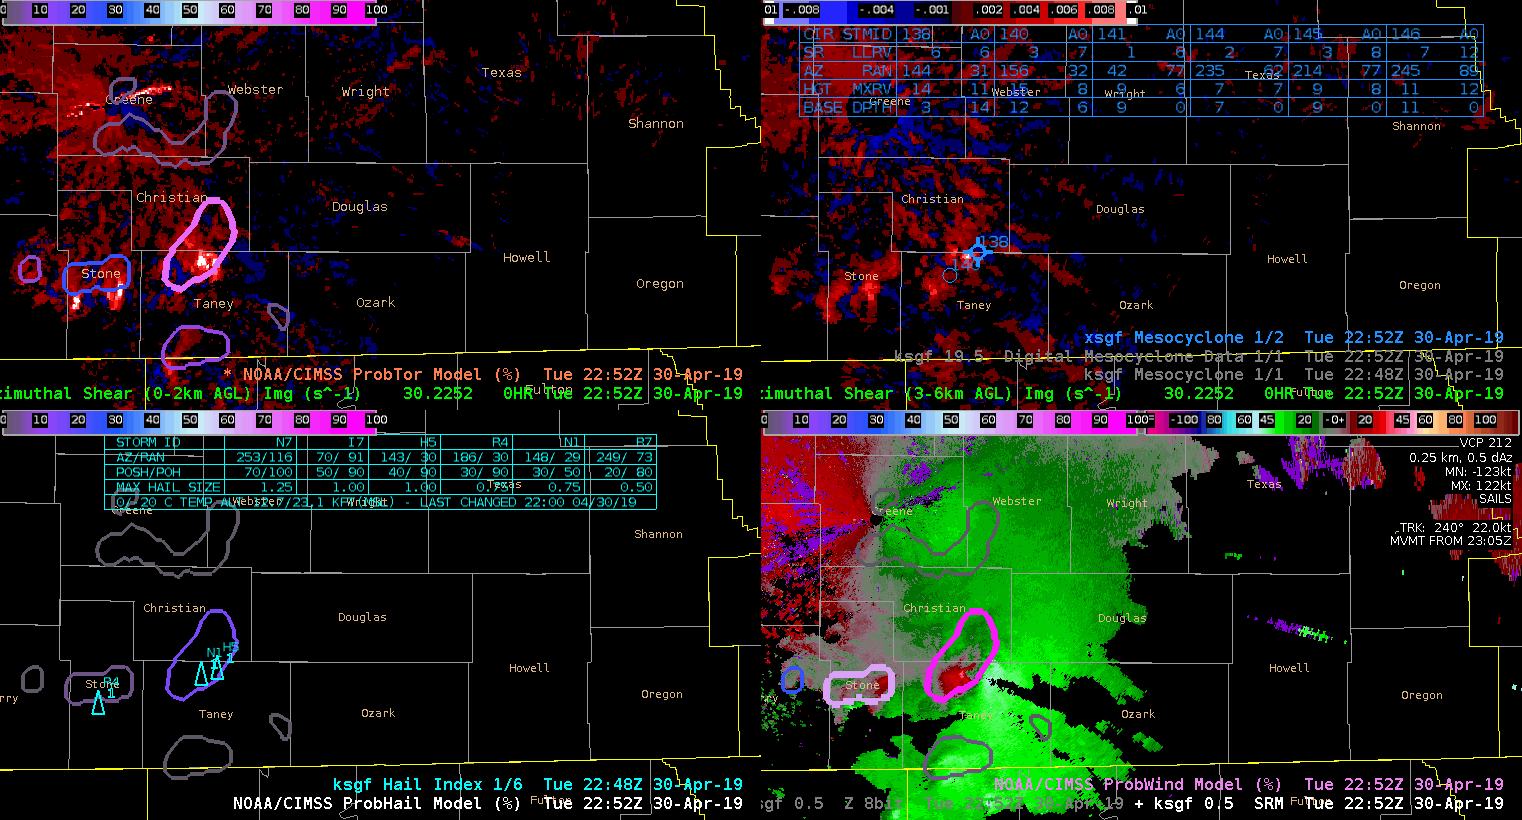
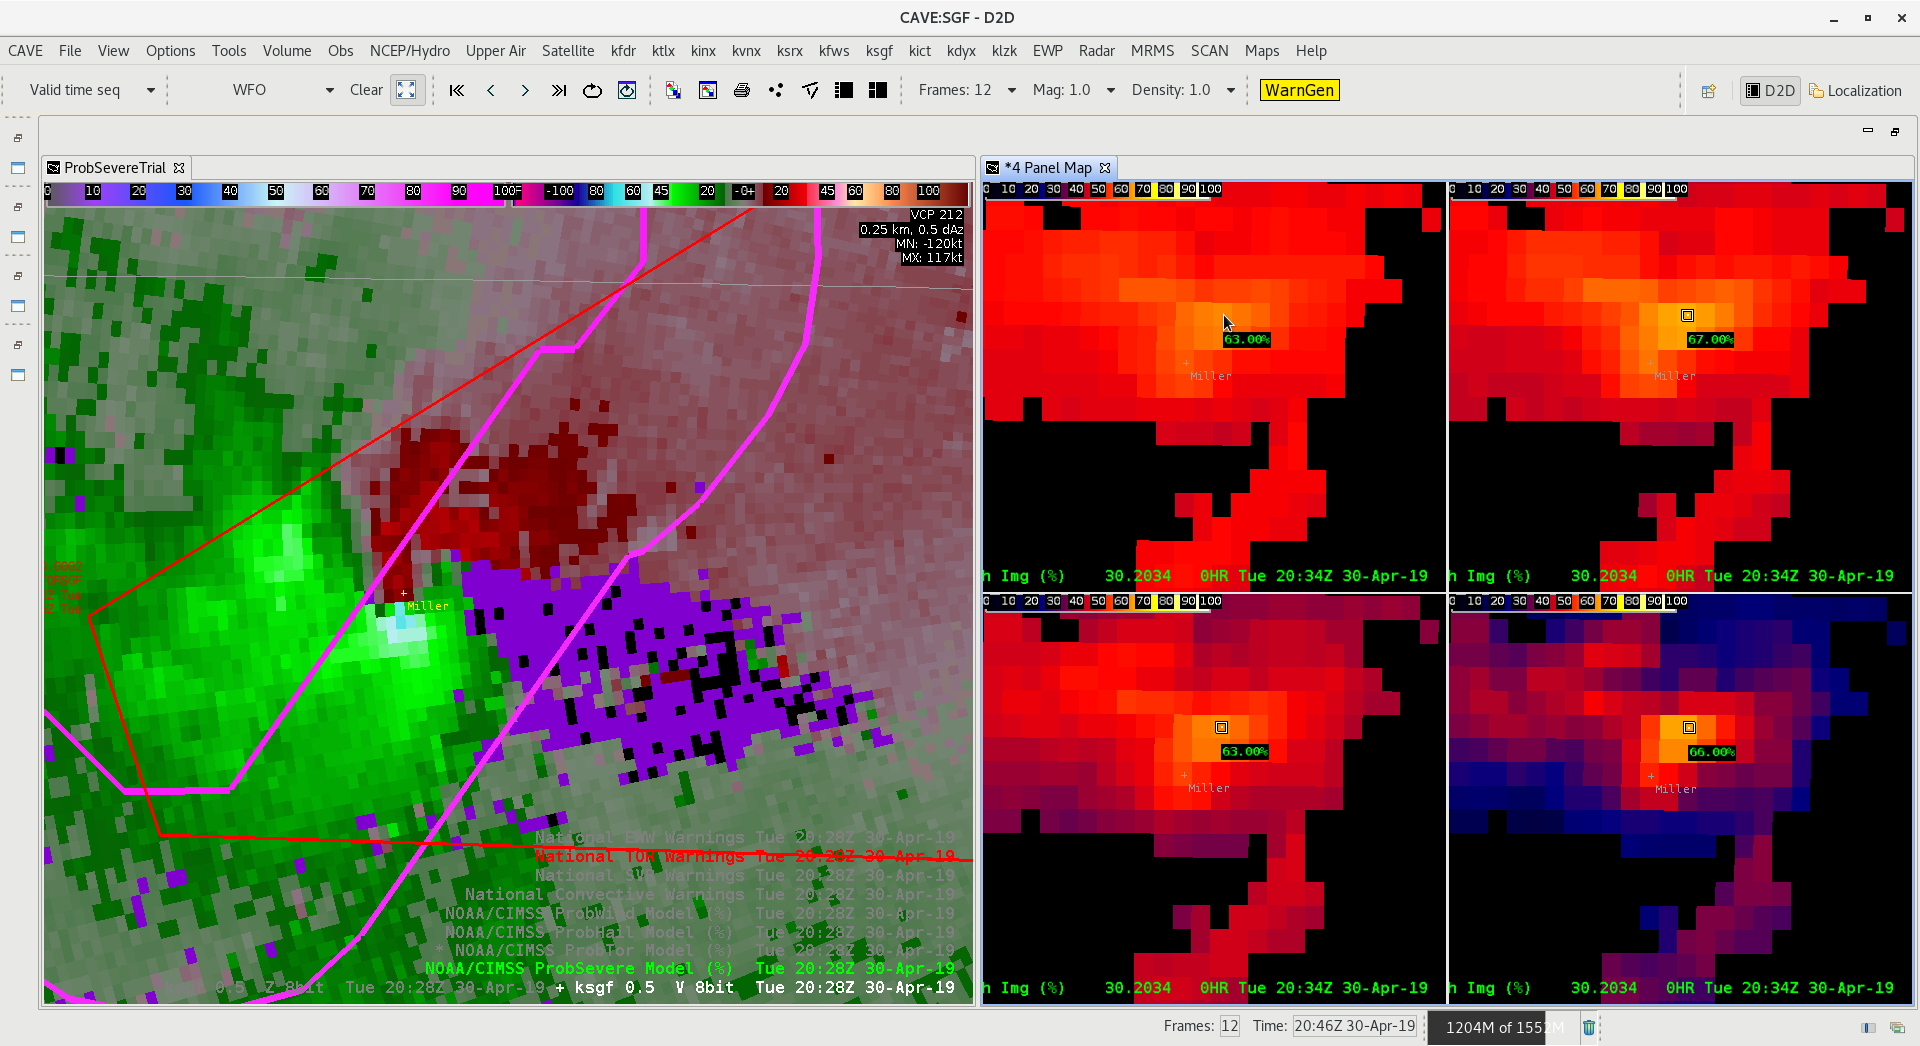
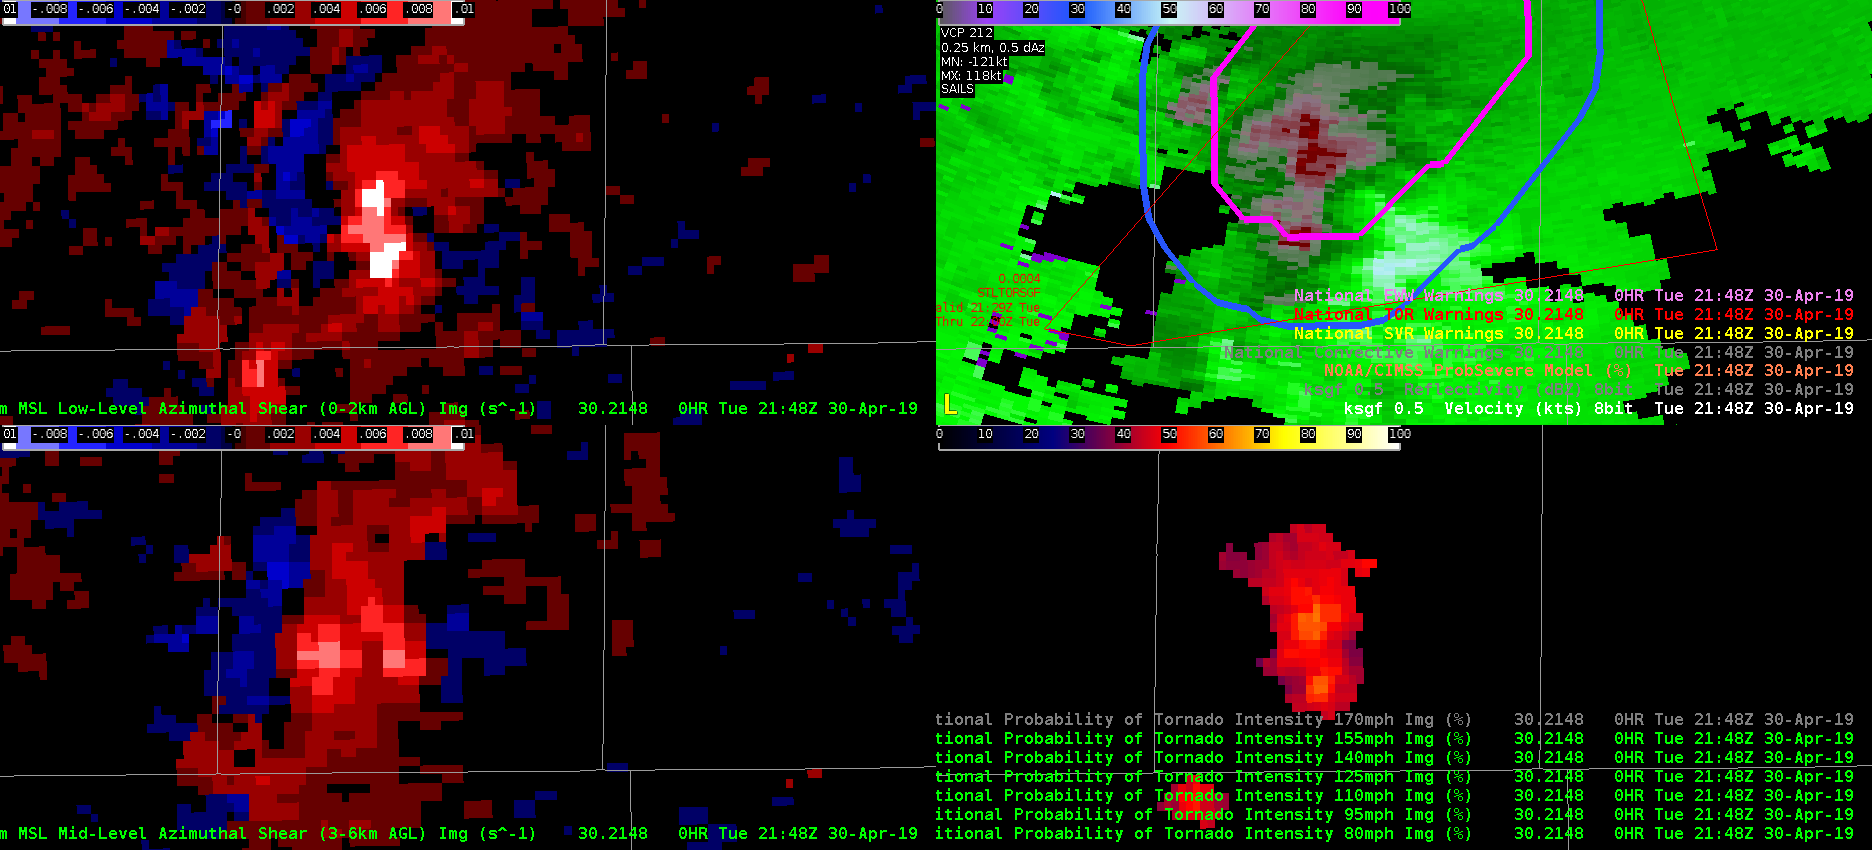
This is a case where AzShear overdid the tornadic threat This supercell had a circulation that never really tightened up. ProbSevere also vastly overestimated the tornado threat, likely due to nearby storm interactions and mergers. When convection gets messy, can we rely on these products as much?


The two images above compare a 4 panel of 1 min GLM data (left four panels) versus 5 min data (right four panels). While the 5 min data was much smoother to view from an animation and trend sense, the 1 min data did provide some fine temporal resolution help during periods of rapid storm intensification preceding this tornado warning.

The above two loops compare 1 min looping (top 4 panel) versus 5 min looping (bottom 4 panels). In a loop the ‘flashy’ nature of 1 min data makes it less desirable in operations, however manual toggling and advancing still make this data useful.


Cell merger – AzShear, CPTI and DMD comparison

Gonna take a look at SC merger  noting two small SC storms WNW of KINX radar @ 2058UTC. Prob TOR with these storms ~ 25% at this time with generally weak AzShear with stronger northern storm.

2106 UTC – just before storm merger see uptick in Azshear (0-2 km) with slight increase in CPTI products (50-52 %).  DMD output not providing any useful information on these storms at this time probably.  ProbTor ~ 10%

After merger @ 2114 UTC although not much change in AzShear, CPTI probabilities do increase some to 55 to 60%. Note that only the XDMD mesocylone algorithm displays a mesocyclone icon at this time while legacy DMD products do not.

2126 UTC – ProbTor rapidly increased to 77% with marked increase in AzShear. CPTI products also near 70% (110 mph).  Now all three DMD products display icon by this time.  BUT the XDMD seemed to identify mesocyclone sooner than legacy products.  This was encouraging.


2142 UTC – looks like storm looses organization as inflow may have been disrupted. AZshear becomes elongated with CPTI values falling notably.   Encouraging to note the character of AzShear (became elongated ) was consistent with the less organized storm (velocity structure).  ProbTor falls to ~ 65%.  Note the xDMD algorithm did still correctly identify shear couplet (SRM not shown) where legacy algorithm fails.   XDMD performed much better and and had greater temporal continuity than legacy product in this example. In this more complex storm interaction example appeared XDMD was able to better identify and retain areas of shear/rotation compared to legacy.

-Quik TWIP


CPTI and Azshear

Tracking this northern most SC @ 1926 UTC prior to tornadogenesis.  Azshear 0-2 km product did a nice job highlighting shear with developing storm very early on in storm evolution and was very persistent in highlighting area of shear throughout.  Temporal continuity was very good.  Lower two panels are 80 and 110 mph intensity probabilities.  Used this 4-panel to monitor evolution.  Also displayed is legacy mesocyclone (upper-right), DMD (lower right) and XDMD l(lower left).  This SC also exhibited well-organized ZDR arc and KDP foot (not shown) that whose centroids were normal to storm motion suggesting MC intensification was likely.

1938 utc Azshear still showing strong signal with CPTI gradually increasing to near 60%.  ProbTor increased to 78% as well.  DMD, XDMD and MD not showing much and did not seem to be very helpful.


CPTI was insightful with increasing probabilities of tornado intensity probabilities at higher speeds (110 mph lower right).   Note that XDMD was also indicating MXRV of 26.


1448 UTC – would occasionally see dual maxes in AZShear and CPTI products that was a bit of an issue at times.

CPTI 110 probablities up to ~ 75 % at this time (lower right)

Overall…0-2 km Azshear was quite helpful in quickly grabbing attention to areas of concern.  0-2 km product was temporally very consistent.  Its location relative to developing Mesocyclone was typically off…but still very useful.    XDMD, did seem to perform better than legacy DMD products but not much at least with this storm.   Early in storm evolution, examining ZDR/KDP centroids relative to storm motion was also helpful as a reality check on MC intensification and increasing SRH with this particular storm.  Bottom line was generally pleased wiith  AzShear and CPTI performance for this storm. – Quik TWIP