Observations from Hail-Producing Storms in the Panhandle of Texas

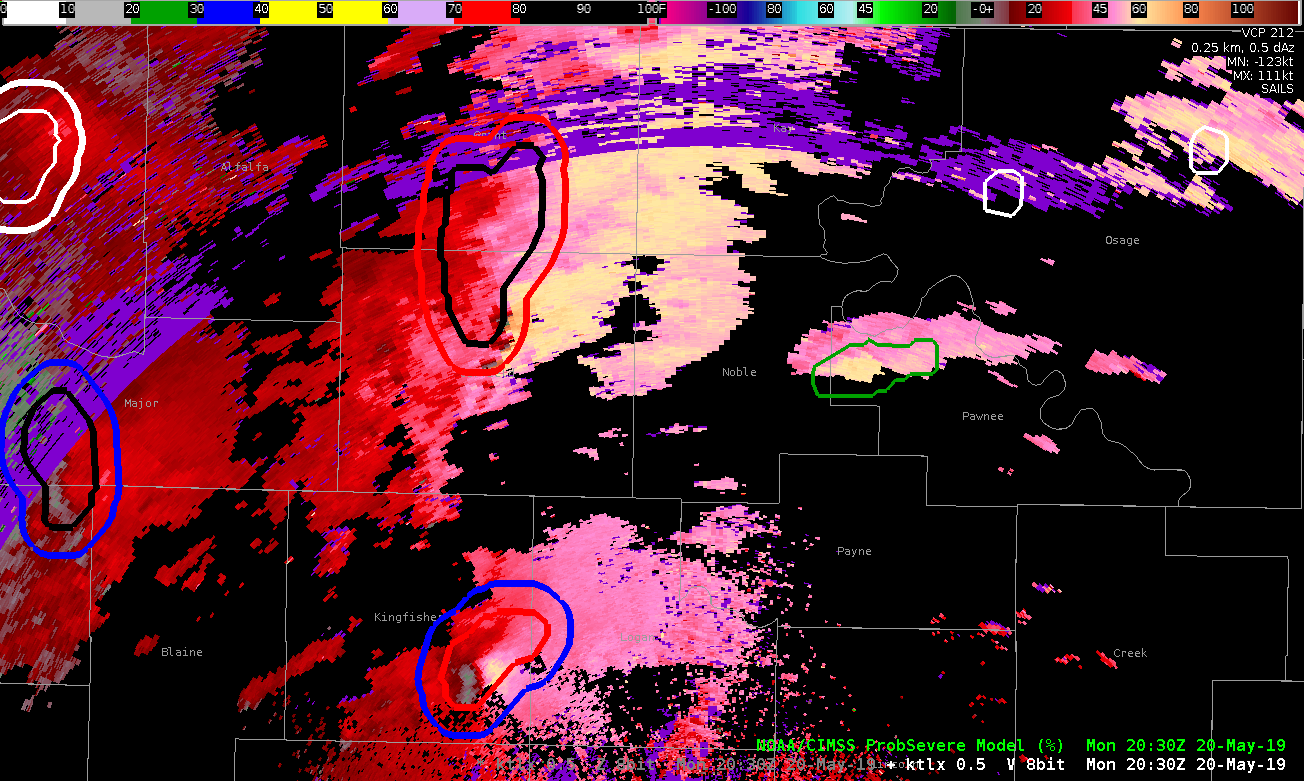
Today’s environment is ideal for all types of severe weather. Unsurprisingly, the ProbHail algorithm indicates high probabilities of hail with most of the storms. Here I’ll use dual-pol interrogation to investigate ProbHail performance and include a few  additional observations.

Of particular note is the evolution of a storm object in the mind of the ProbHail algorithm. The algorithm seems to handle merging and splitting remarkably well for both the northern-most storm and the line of storms that results at the end of the loop in the SE part of the CWA. This performance in a highly-complex radar display is promising for more isolated storms. Let’s zoom in on the southeastern storm near Wellington:

The reflectivity signal in the hail core is not particularly anomalous (~50 dBZ), but ZDR near zero and reduced CC indicate high confidence in hail production at the surface. The ProbHail shows a 98% chance of hail in that storm. We would expect high confidence and this algorithm performs well. Baseball size hail was reported with this storm! -Atlanta Braves


The good and bad of Prob Tor/AzShear/Meso Detection Algorithms

The image below looks at 2 cells in central Oklahoma. The northern cell has a prob tor of 77%, but is falsely lightning up a shear zone with little chance of a tornado. The southern cell shows all the characteristics of a tornadic supercell, but has a prob tor of 37%. However, the southern cell is closer to producing a tornado (via live media).

Here’s another image using KVNX instead of KTLX, and shows only the prob tor.

The two cells to the north have 90 and 91 percent, respectively, while the southern supercell has only 33 percent.

Not to pick on the prob severe product, the meso detection algorithms a similarly struggling. Below is a 4-panel showing the legacy mesocyclone alogrithm (upper left), the digital mesocylone algorithm (upper right), the low level AzShear (lower left), and the experimental meso algorithm (lower right).

All three detection algorithms are flagging the circulations as equally important, but an examination of the base data shows otherwise.

Thorcaster

Bad Velocity Data Trips Alogrithms

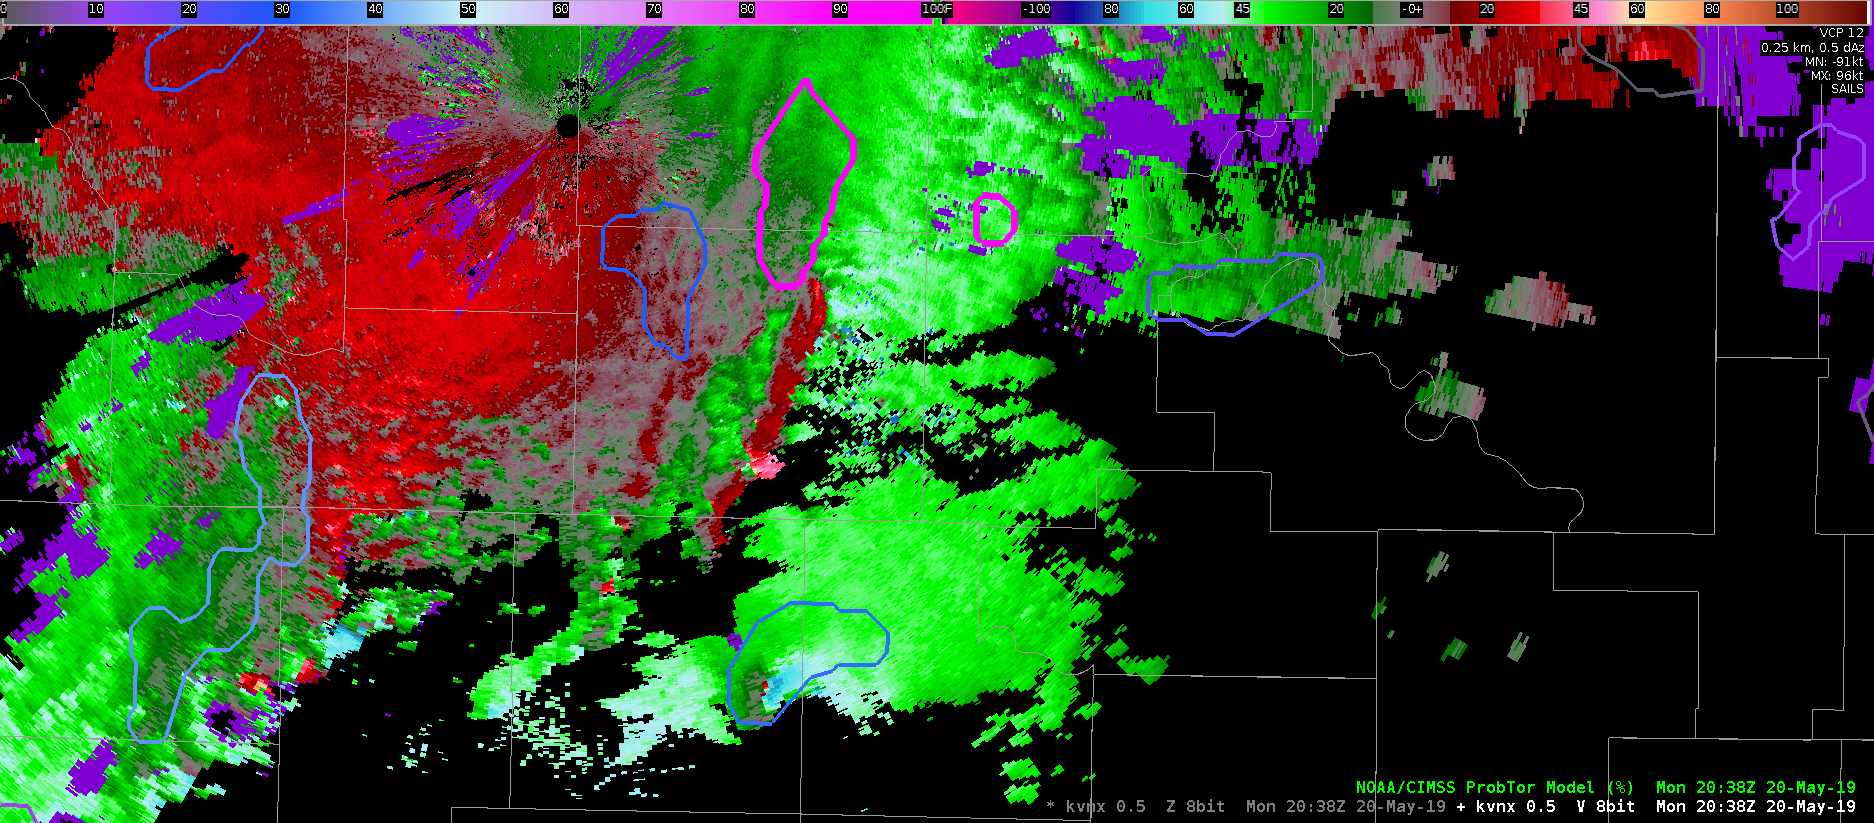
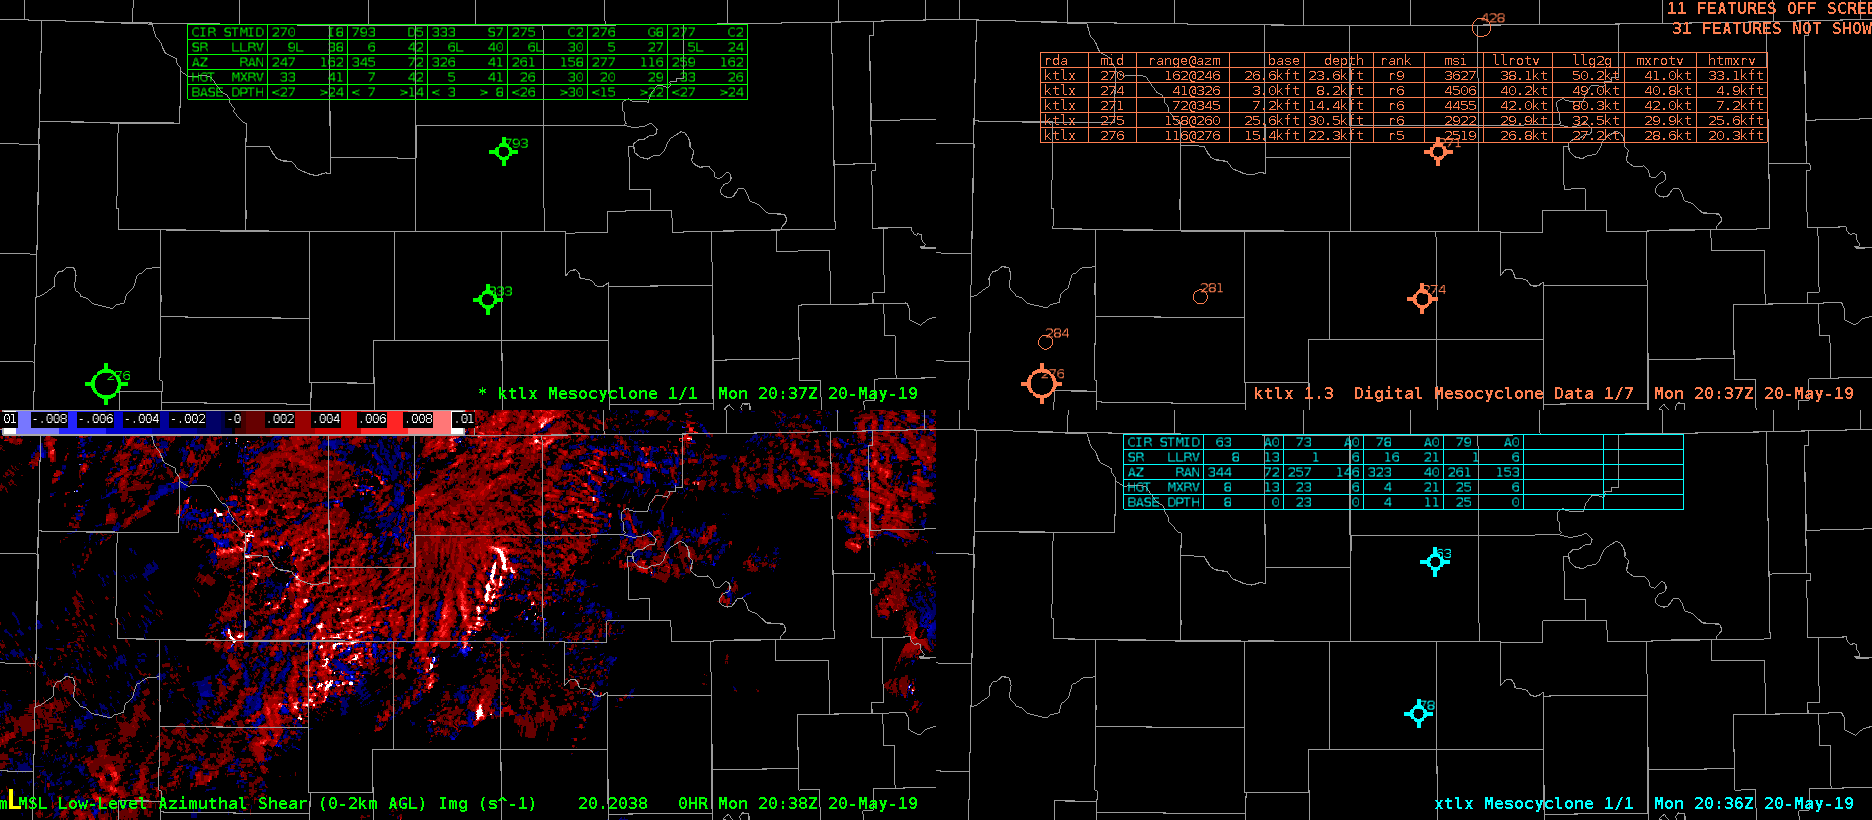
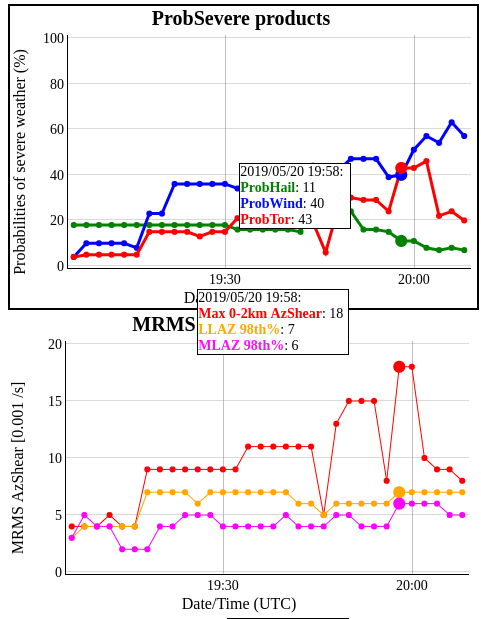
Just after 20z on the eastern fringe of the LUB CWA, the KFDR radar indicated an area of very high inbound velocity. However, this data is in question as the elevated velocity occurred in an area of low Z and high SW, and likely not representative of the actual storm. This may have been caused by a side lobe. This had cascading affects with algorithms being tested which could not filter out the bad data. Low level az shear spiked to over 0.01 in a group of stationary pixels. This caused algorithms that ingest the az shear product to spike including ProbTor which increased to over 90%, as well as CPTI which showed lower end probabilities of a violent tornado in progress.

Dave Grohl

NUCAPS swath…just a bit too far east…

So, hello from my initial post from HWT, here during the week of May 20th.  Yes, this is shaping up to be an active day and perhaps week.  Taking a first look at the NUCAPS soundings for this afternoon…and…the latest ~18 UTC swath is just a bit too far east to be of a lot of use here in the primary action area for severe convection.  Notice in the first image the SPC Outlooks (High Risk area nearly entirely to the west of the soundings).   Nevertheless, I’ll take a look at the next swath to see the coverage over the main area of expected severe weather.

Image: Day One Convective Outlook (from SPC), NUCAPS Improved Latency soundings (~1817 UTC), and GOES-16 Vis (0.64 um).

-Kris W

First simulated TOR warning

Trying to get set up in a hurry with all the experimental products. First simulated TOR of the day for OUN based on a combination of base radar, jump in TOR probability, and a noticeable increase in the AzShear. Below is shown the trend of the prob tor and MRMS AzShear products.

Notice the jump in both just prior to 20Z. Not show is the base reflectivity with the expected pendant on the inflow side of the cell.

Thorcaster


AllSkyLAP Instability and Moisture Analysis

A 4 panel showing CAPE (top left), along with 3 different PW images shows the moisture and instability profile across the panhandle region eastward into the southern Plains. The CAPE images show the warm frontal boundary lifting north through the morning, with instability eventually spreading into the far southeastern corner of the AMA CWA. The dryline shows up well in the surface-900mb PW imagery (bottom left) as well.

-64BoggsLites

Merged Advanced TPW Too Low in Cloudy Areas this Afternoon

The Merged Advanced TPW is underdoing PWAT values in cloudy areas over central Oklahoma. There are discontinuities where it goes from clear to cloudy skies.

The 18z KOUN RAOB sampled 1.52″ PWATs, while the Advanced TPW is showing only around 1.00″.

Meanwhile, the All Sky LAP PWAT appears to be better representing reality, with PWATs around 1.70″

Ron Dayne

Using All-Sky LAP to Identify Areas of Destabilization

Rapid destabilization is occurring over portions of northwest Texas and southwest Oklahoma. This can be seen in the all-sky LAP CAPE product:

Looking at a four-panel image of all-sky LAP precipitable water for the entire layer, as well as the surface to 0.9 sigma, 0.9-0.7 sigma, and 0.7-0.3 sigma levels, we can see why this is the case. The top-right image shows low-level moistening in the surface to 0.9 sigma layer, which is confirmed by surface observations showing dewpoints rising from the low-60s to the low-70s over the course of 6 hours. Meanwhile, the bottom right image shows midlevel drying associated with steeper midlevel lapse rates advecting into the region.

Ron Dayne

Using All Sky CAPE to identify warm front and dry line

Just getting to look at the potentially very volatile day here in central OK, so wanted to start be looking at the All Sky CAPE to help identify the movement of two critical boundaries, a warm front moving northward, and the dry line moving eastward. This loop very nicely shows the advancement of the two boundaries over the last couple of hours, with a surge of CAPE moving into the southern half of Oklahoma. Observations are overlayed on the clear sky CAPE for verification. Useful product for SA today.

Thorcaster

High Risk Day in the HWT

Today is one of those rare days in the parameter space of severe weather. A high risk has been issued for portions of the Texas Panhandle into western and central Oklahoma, including us here in Norman and the OKC metro area. Models continue to paint an ominous picture of numerous waves of tornadic supercells within the warm sector and east of the dryline  throughout SW Oklahoma into the OKC metro area. Flooding will also be a major concern and could potentially have as much impact as the tornadoes. We will be operating in the Norman, OK, Amarillo, TX, and Lubbock, TX CWAs throughout the day.

-Michael

Tags: None