
Tight couplet on cell in NE Oklahoma but significantly displaced AzShear bullseye. This resulted in a misplaced MDA algorithm detection as well.
CPTI performed well with a 26% of a strong tornado. -Atlanta Braves
Official websites use .gov
A
.gov website belongs to an official government
organization in the United States.
Secure .gov websites use HTTPS
A
lock (
) or https:// means you’ve safely connected to
the .gov website. Share sensitive information only on official,
secure websites.

Tight couplet on cell in NE Oklahoma but significantly displaced AzShear bullseye. This resulted in a misplaced MDA algorithm detection as well.
CPTI performed well with a 26% of a strong tornado. -Atlanta Braves
There were 2 adjacent supercells heading into the Tulsa CWA and ProbSevere kept them as separate objects (correctly) despite their proximity. This is a great sign. Additionally, the ProbTor product effectively differentiated between a tight couplet (north, 70% ProbTor) and a weaker couplet (south, 34% ProbTor).
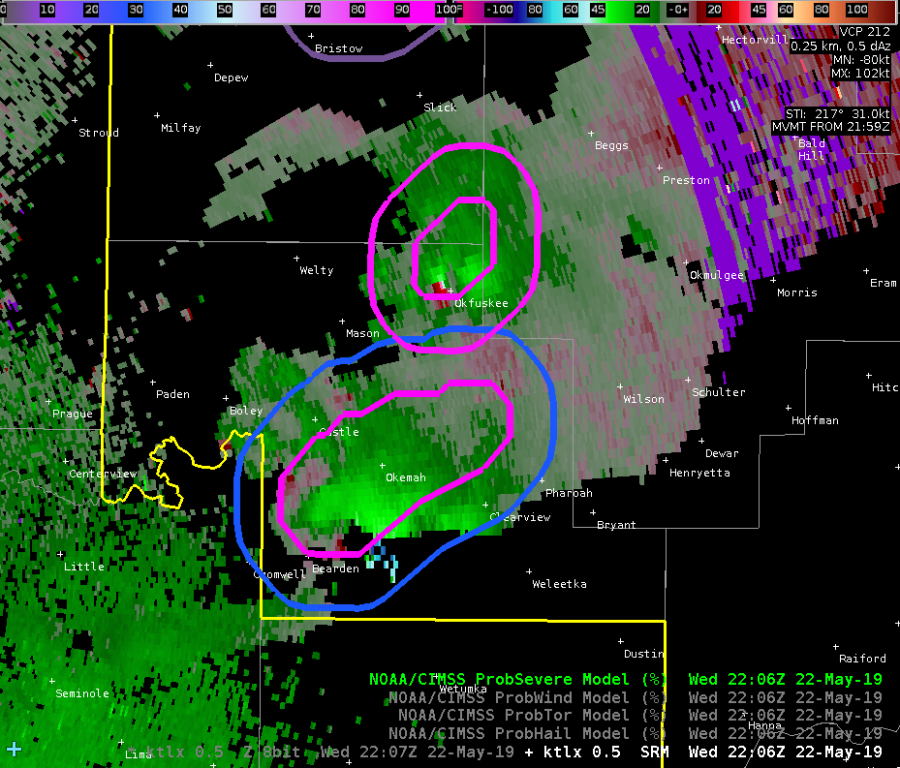
This case shows the ability of ProbSevere to differentiate storms with distinct features despite close proximity. It also shows that ProbTor is doing what we think it should based on velocity features. -Atlanta Braves
A tornado produced a TDS in the SW part of the Tulsa WFO CWA at 21:44Z. Maximum TDS height was ~6kft.
The CPTI adequately represented an increase chance of a strong tornado (18-20%, top left).
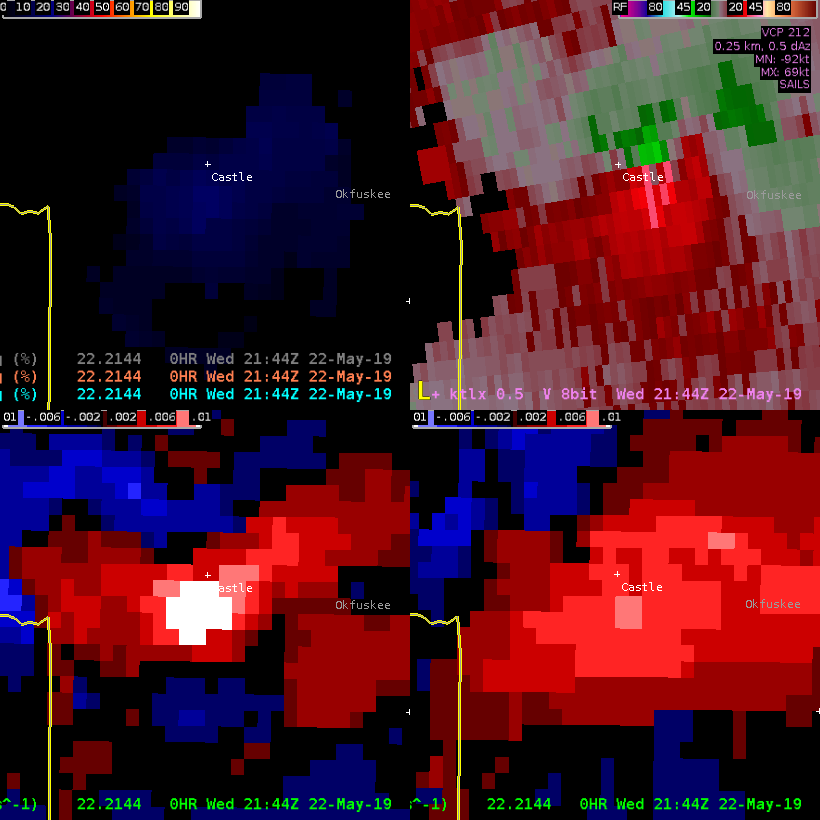
It appears this CPTI did not have the same issues with effective STP like yesterday’s St. Louis tornado did. I like this product a lot! -Atlanta Braves
Working the SGF CWA this afternoon, I wasn’t able to use the modified NUCAPS soundings, as there was a gap in the availability coverage right over that area. Below are maps of the modified sounding availability vs the reduced latency availability.
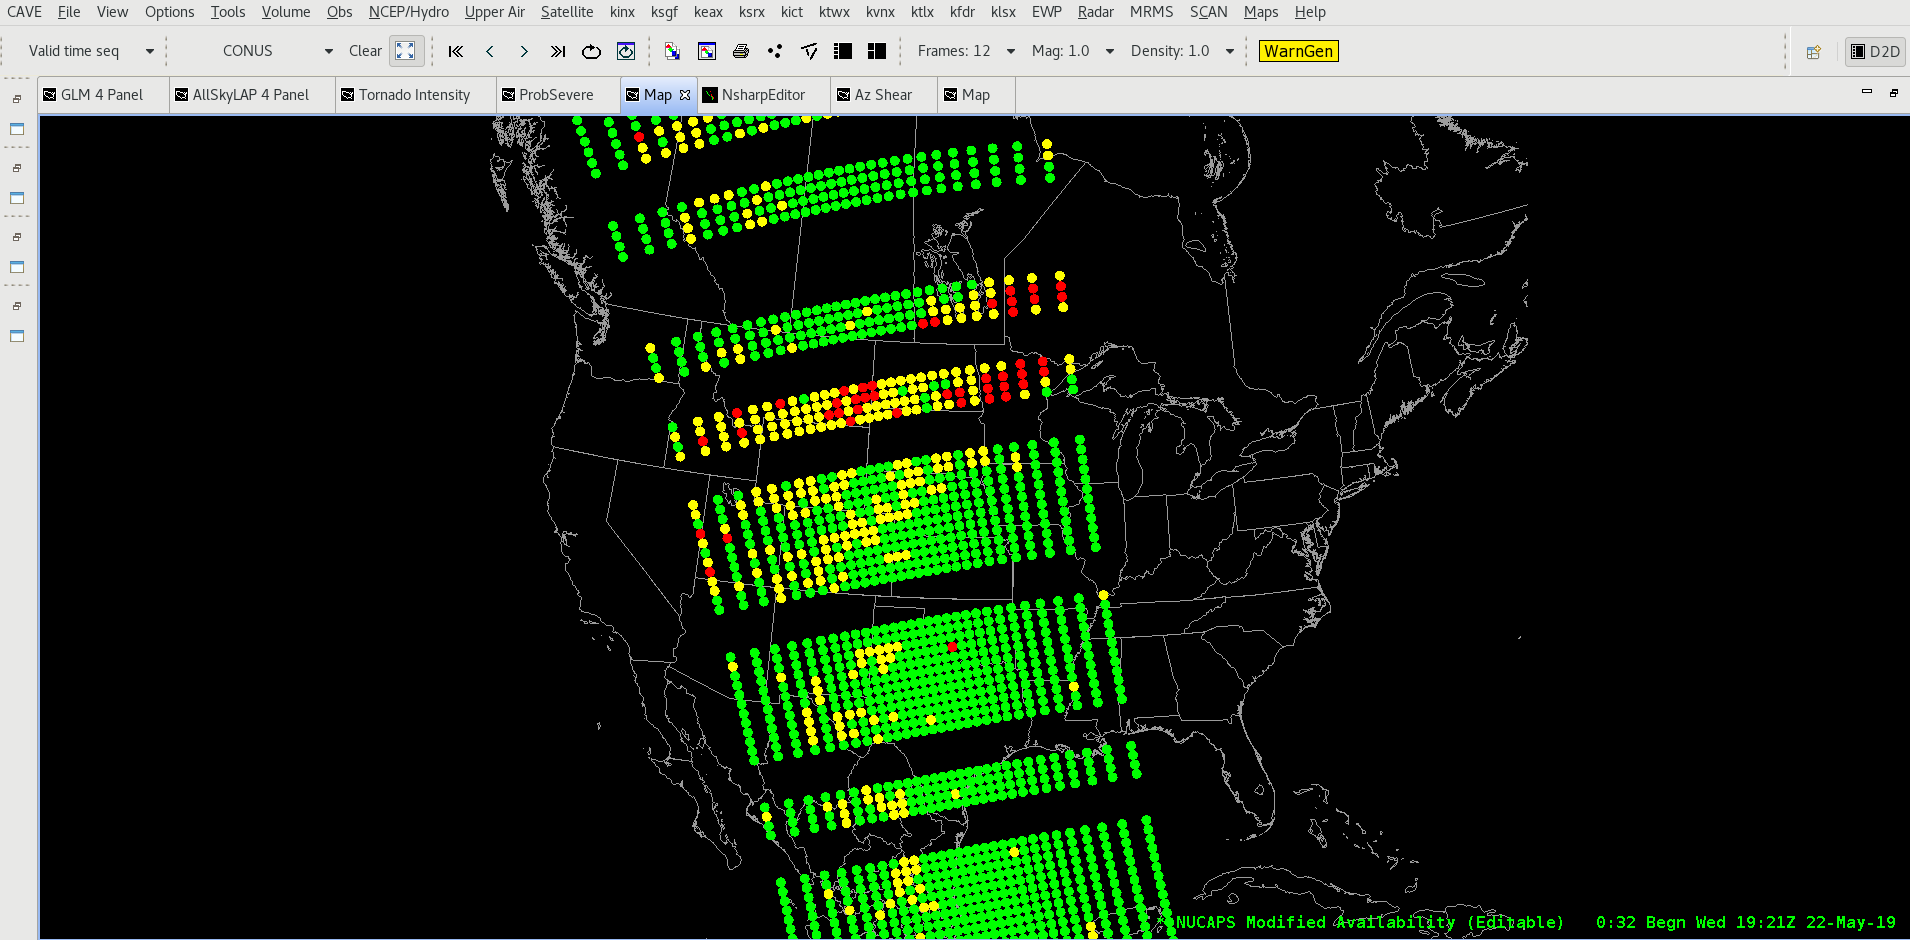
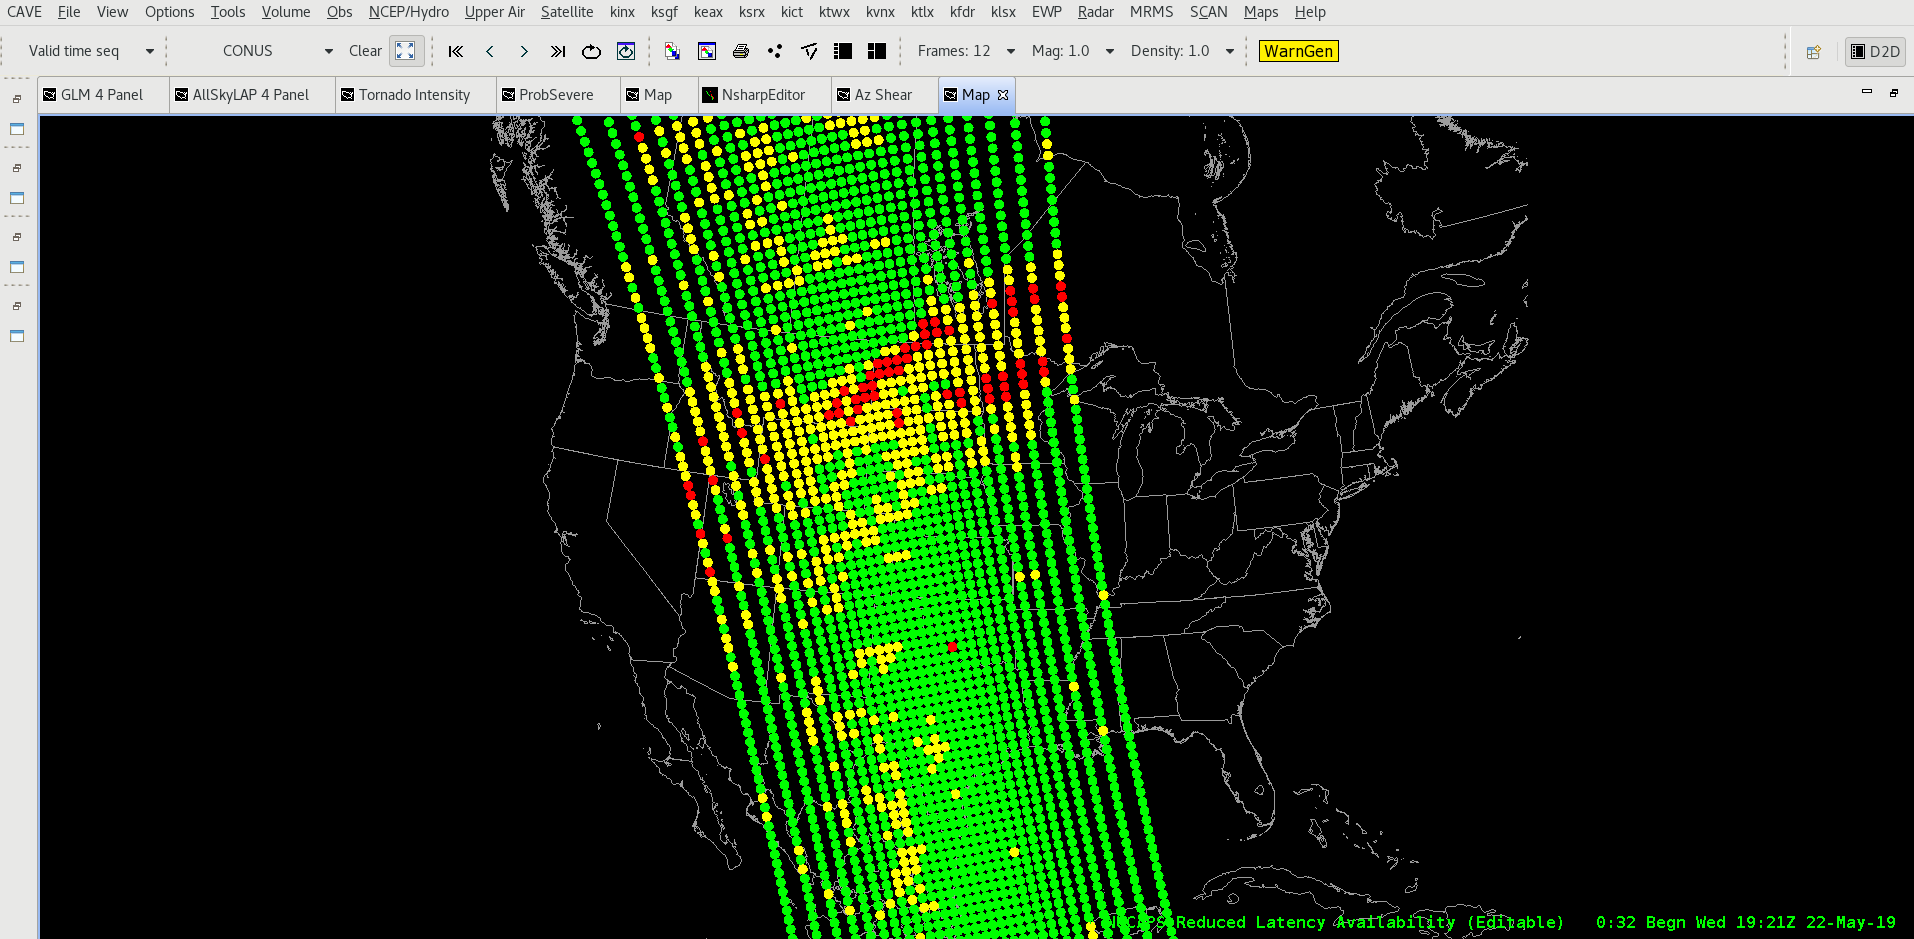
-64BoggsLites
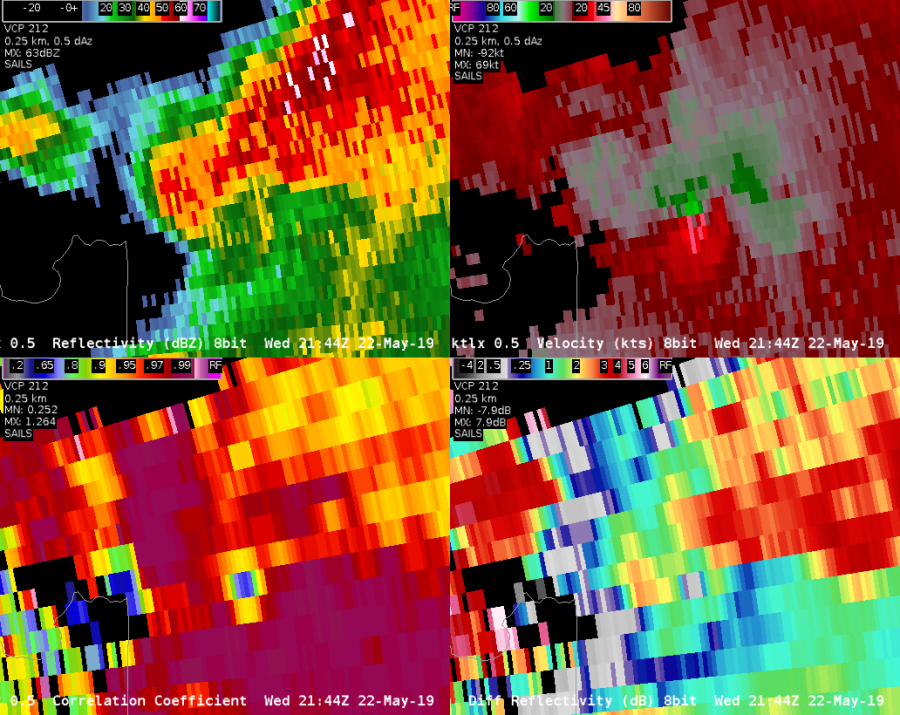
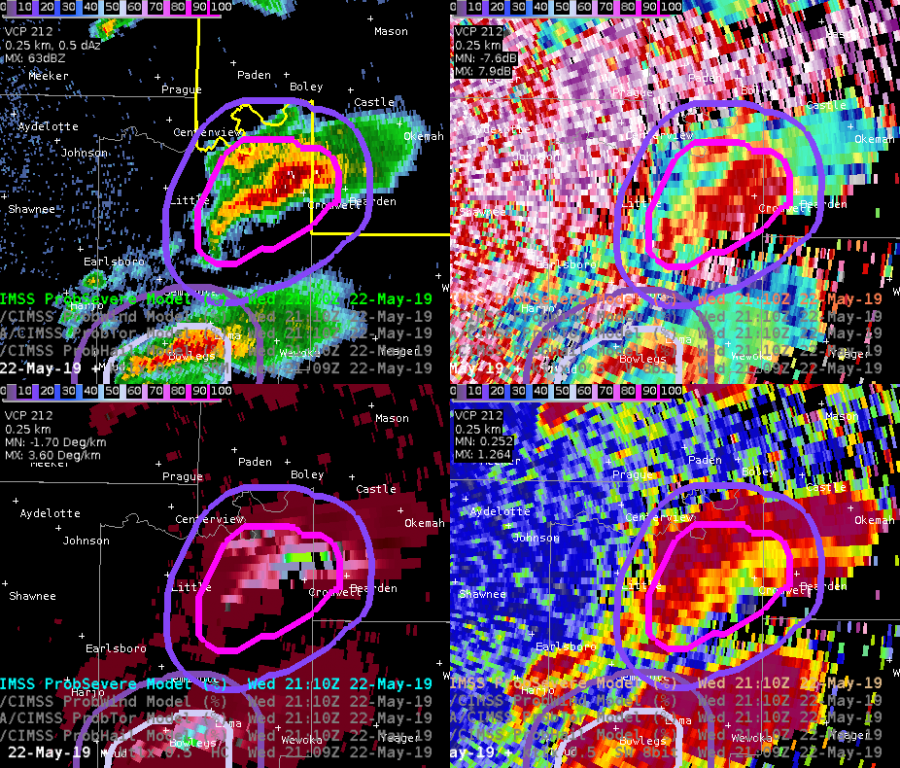
The new MDA seems to be missing out an area of obvious rotation in central OK Wednesday afternoon. The new MDA (upper right) has no storm ID on the couplet, but the digital MDA (bottom right) has correctly identified the mesocyclone. The problems may be due to quality control within new MDA, as the rotation is occurring within an area of low reflectivity (upper left) and high spectrum width.

Dave Grohl
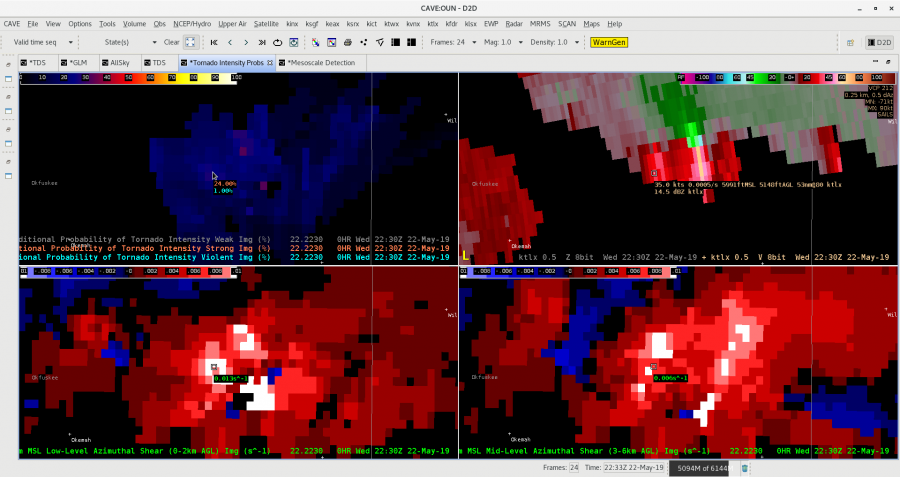
On May 22 at around 2130Z, a tornado warning (test) was issued for Okfuskee County in the Tulsa CWA. Besides the usual examination of base velocity data, other tools that were used to help the decision were the merged AzShear products and the CPTI products. Watch the loop below.
In this four-panel, the upper left has the 0-2 km merged AzShear, the upper right has the 3-6 km AzShear, the lower left has the Weak/Strong/Violent CPTI products overlayed on each other, and the lower right has the 0.5 degree base velocity.
At the beginning of the loop, the max 0-2 km AzShear values were .008 s^-1, but increased throughout the loop, eventually reaching .012 s^-1, exceeding the .010 threshold. The 3-6 km AzShear showed a similar trend.
The CPTI product showed a noticeable trend as well. At the beginning of the loop the weak/strong/violent values were 89/11/0 %, respectively. Since most every value of AzShear starts with 100% weak, the values were not overly supportive. However, by the end of the loop, the values were 75/23/2 % respectively, a significant increase in the threat of both strong and violent tornadoes. With the limited experience I have using the product, once the strong gets to 20% or higher, and the violent gets to 2% or higher, it greatly increases the confidence in needing a tornado warning.
Thorcaster
The best storm so far went up in the far NE part of the OUN CWA and the ProbSevere model handled it well:
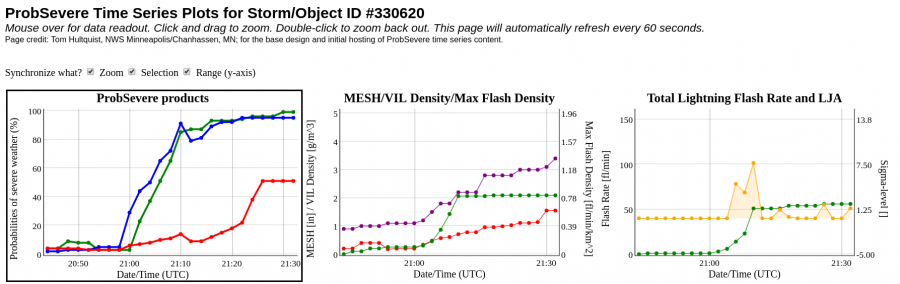
Note the lightning jump that occurs shortly after 21Z as well.
This is a nice supercell case! -Atlanta Braves
The NMDA had trouble locking on to the area of strongest rotation in a supercell moving from Seminole to Okfuskee Counties:
The DMD seemed to do a little better:
Ron Dayne
This post is going to compare the significant differences between the modified and unmodified NUCAPS sounding near Tulsa, OK at 19Z on May 22.
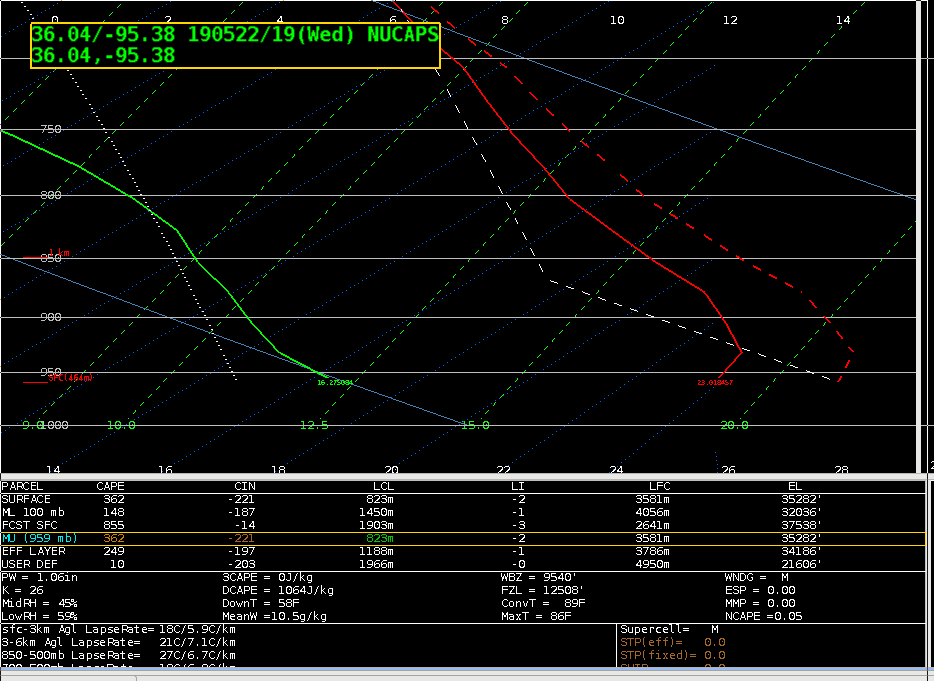
First a look at the unmodified sounding. It actually shows a small temperature inversion near the surface in the boundary layer, with a surface temperature of 75, and a surface dew point of 61. This resulted in a computed surface-based CAPE of 362 J/kg, and a mixed layer CAPE of 148 J/kg. Now let’s look at the NUCAPS sounding modified for the 19Z observed surface temp and dew point.
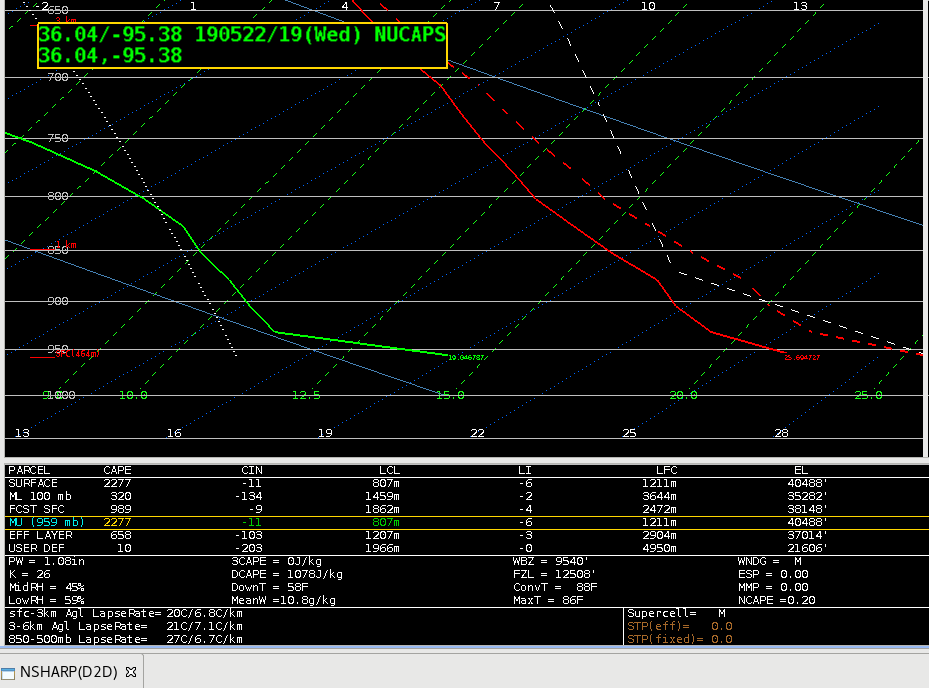
the modified NUCAPS soudning used the surface temp of 78 and surface dew point of 69. This caused a very large difference in the surface-based CAPE, with a value of 2277 J/kg (about 7X the unmodified). The MLCAPE also more than doubled to 328 J/kg. Interestingly, the All Sky CAPE (which is designed to match the MLCAPE more closely then the SBCAPE) at the same time in the same area gave an estimate of 1627 J/kg (not shown). That would indicate that both the modified and unmodified versions significantly underestimated the instability, but the modified gave forecasters a much better idea of the potential based on the much higher SBCAPE.
I also noticed that the mixing process the modified NUCAPS used for the surface observation produces a rather unrealistic near surface profile. I think an improvement in the mixing scheme could improve the use of the modified NUCAPS soundings further. Despite that, the current modified does give a better indication of the convective potential in this case.
Thorcaster
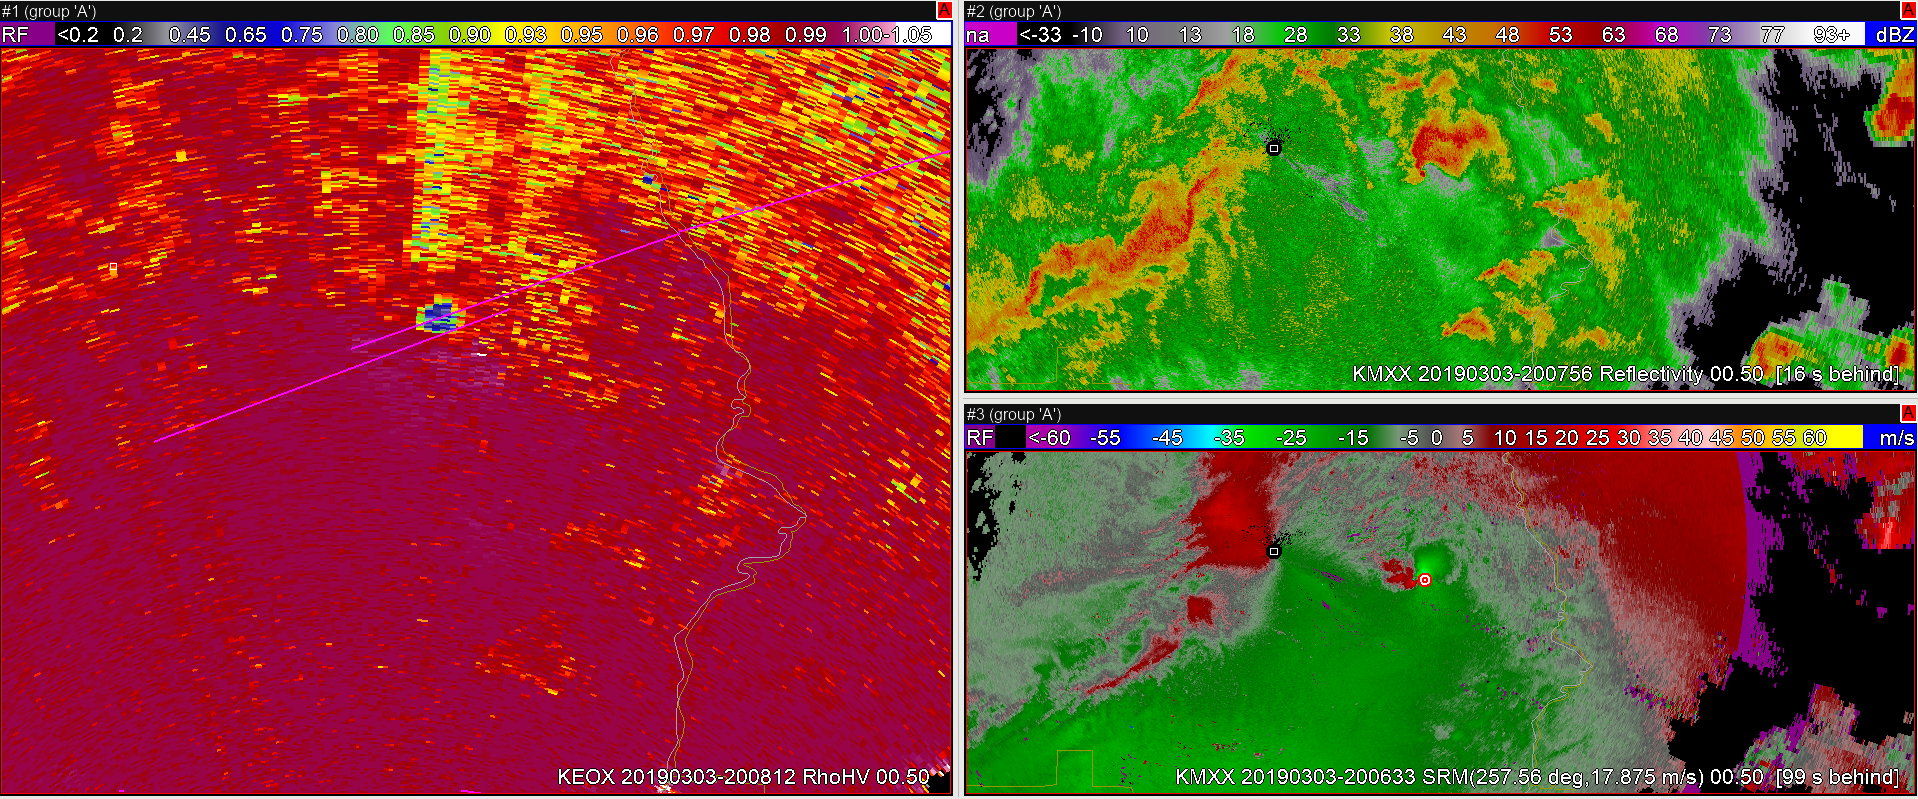
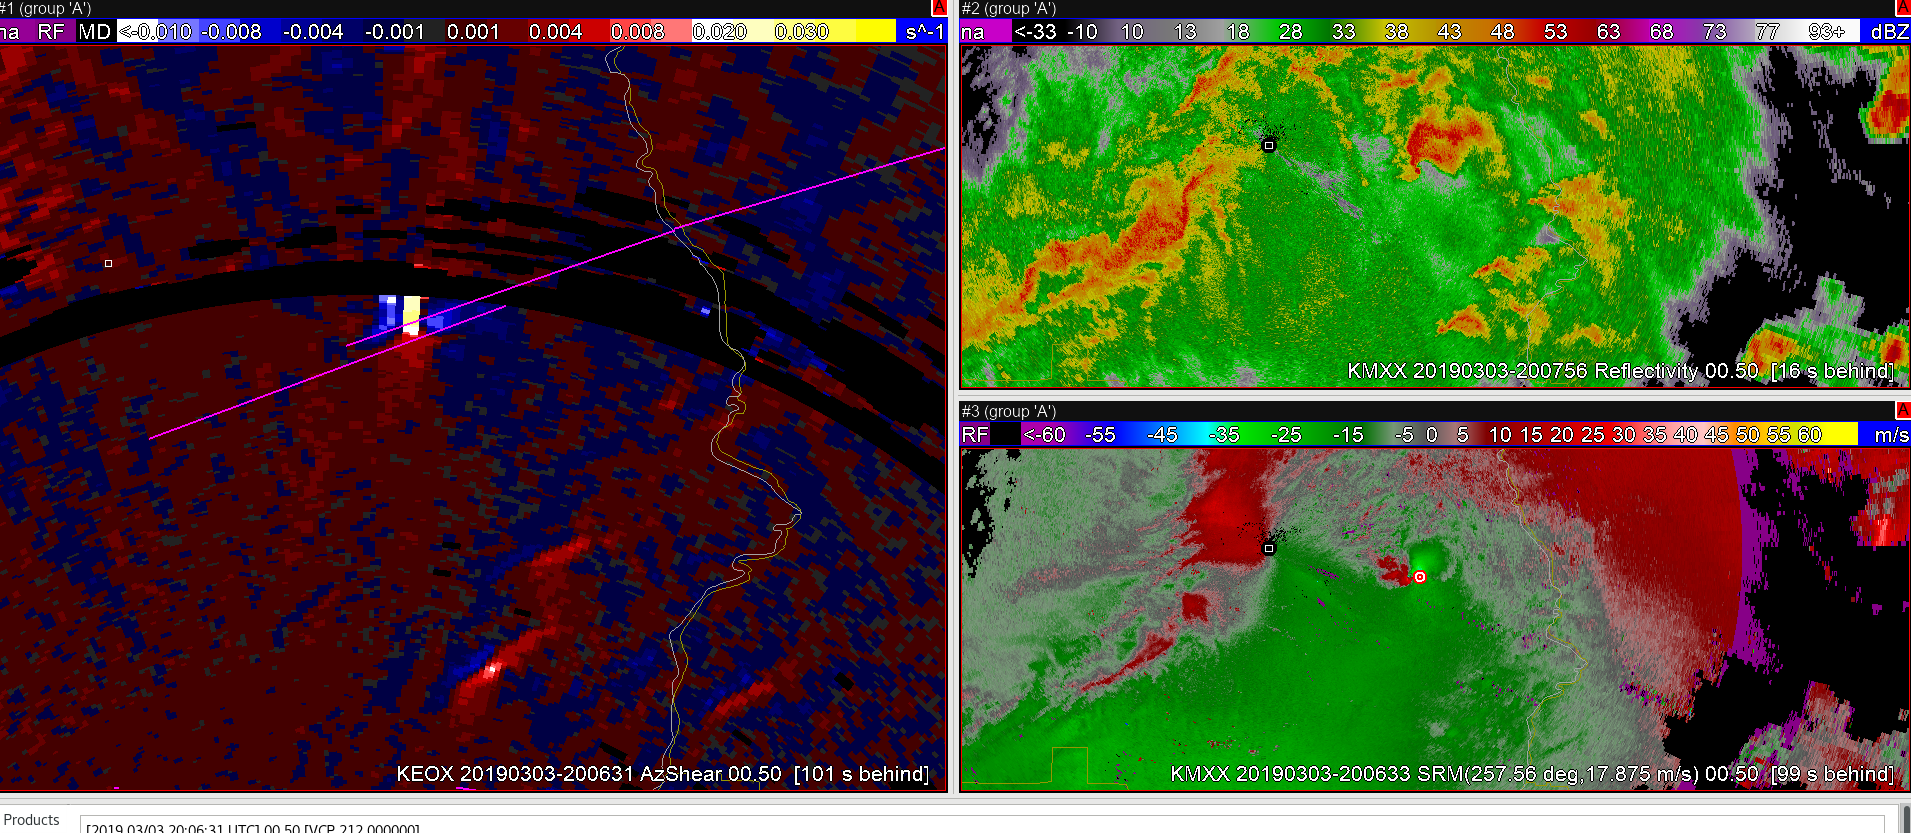 The Fort Rucker, AL (KEOX) radar, well south of the storm of interest, shows strong azimuthal shear values up to 0.028 S-1. The maximum values are slightly offset to the north of the surveyed tornado track (pink line) likely due to distance from the radar. A mature hook echo is apparent in the reflectivity with a corresponding tight couplet in the 0.5 degree SRM.
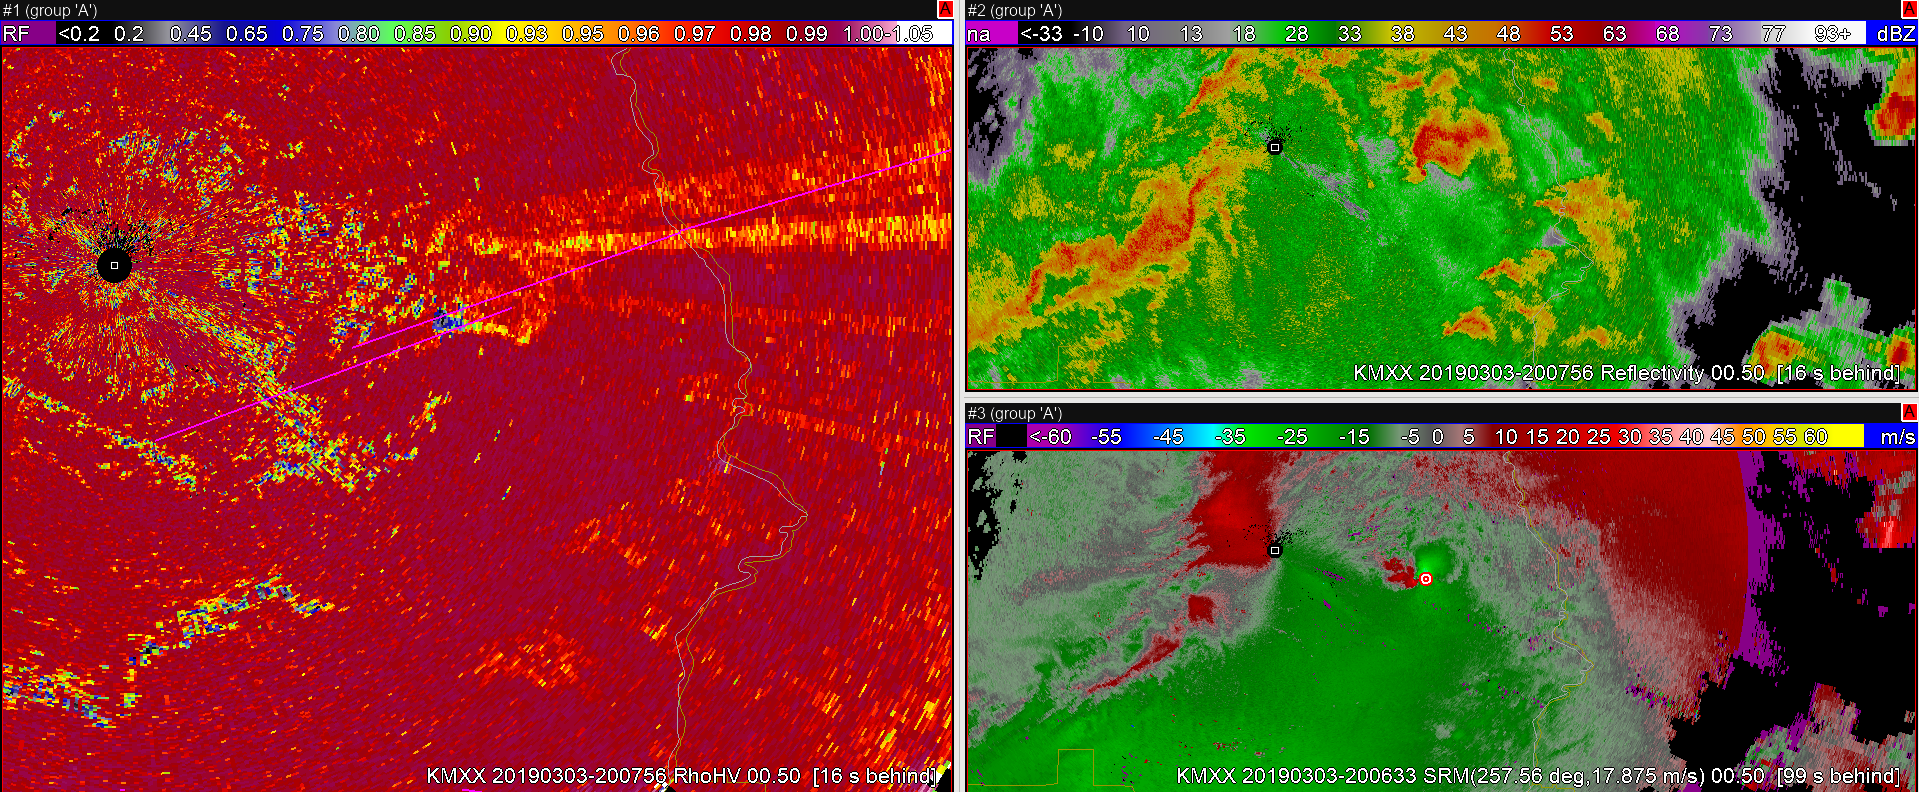
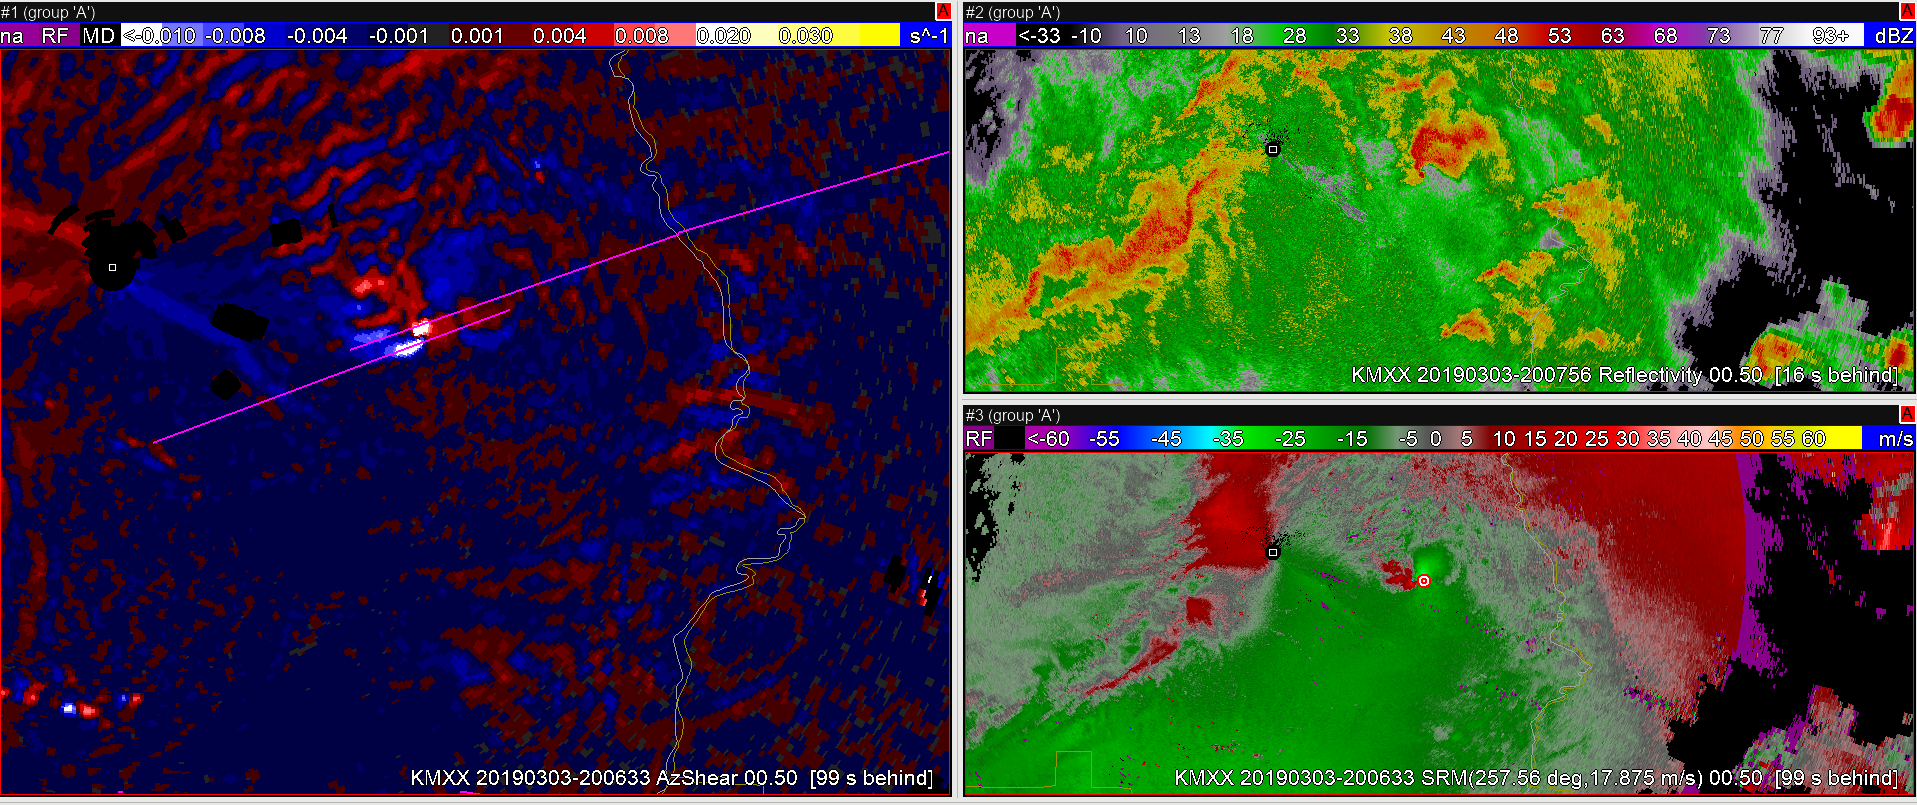 The Maxwell, AL (KMXX) radar, located closer and to the west the tornadic supercell, was also detecting strong azimuthal shear up to 0.021 S-1. An area of negative shear was located immediately to the south of the SRM couplet, along a weaker anticyclonic inbound-outbound interface. This corridor of blue shades to bright white was a bit distracting from the more important red to white positive shear associated with the cyclonic rotation. The maximum positive shear values were located exactly on the track of the surveyed tornado. Reflectivity and SRM KMXX data were similar to KEOX.
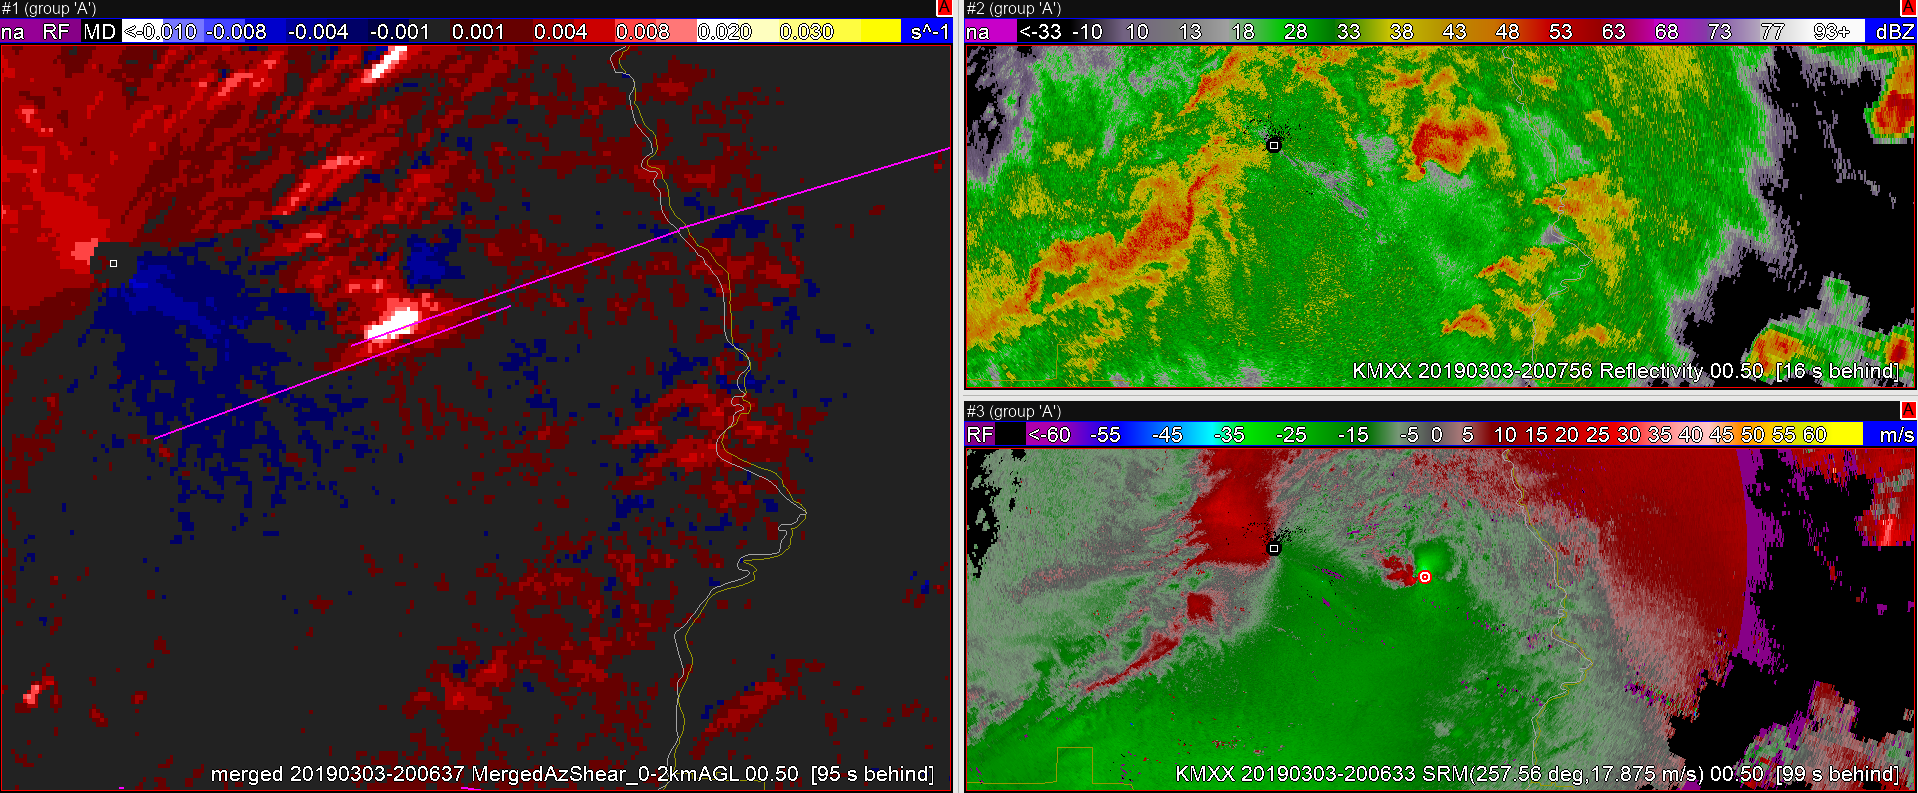 Merged 0-2 km azimuthal shear provided an accurate location of the meso/tornado and washed out the negative shear signal from the KMXX data. The shear values are lower than the single radar data.
 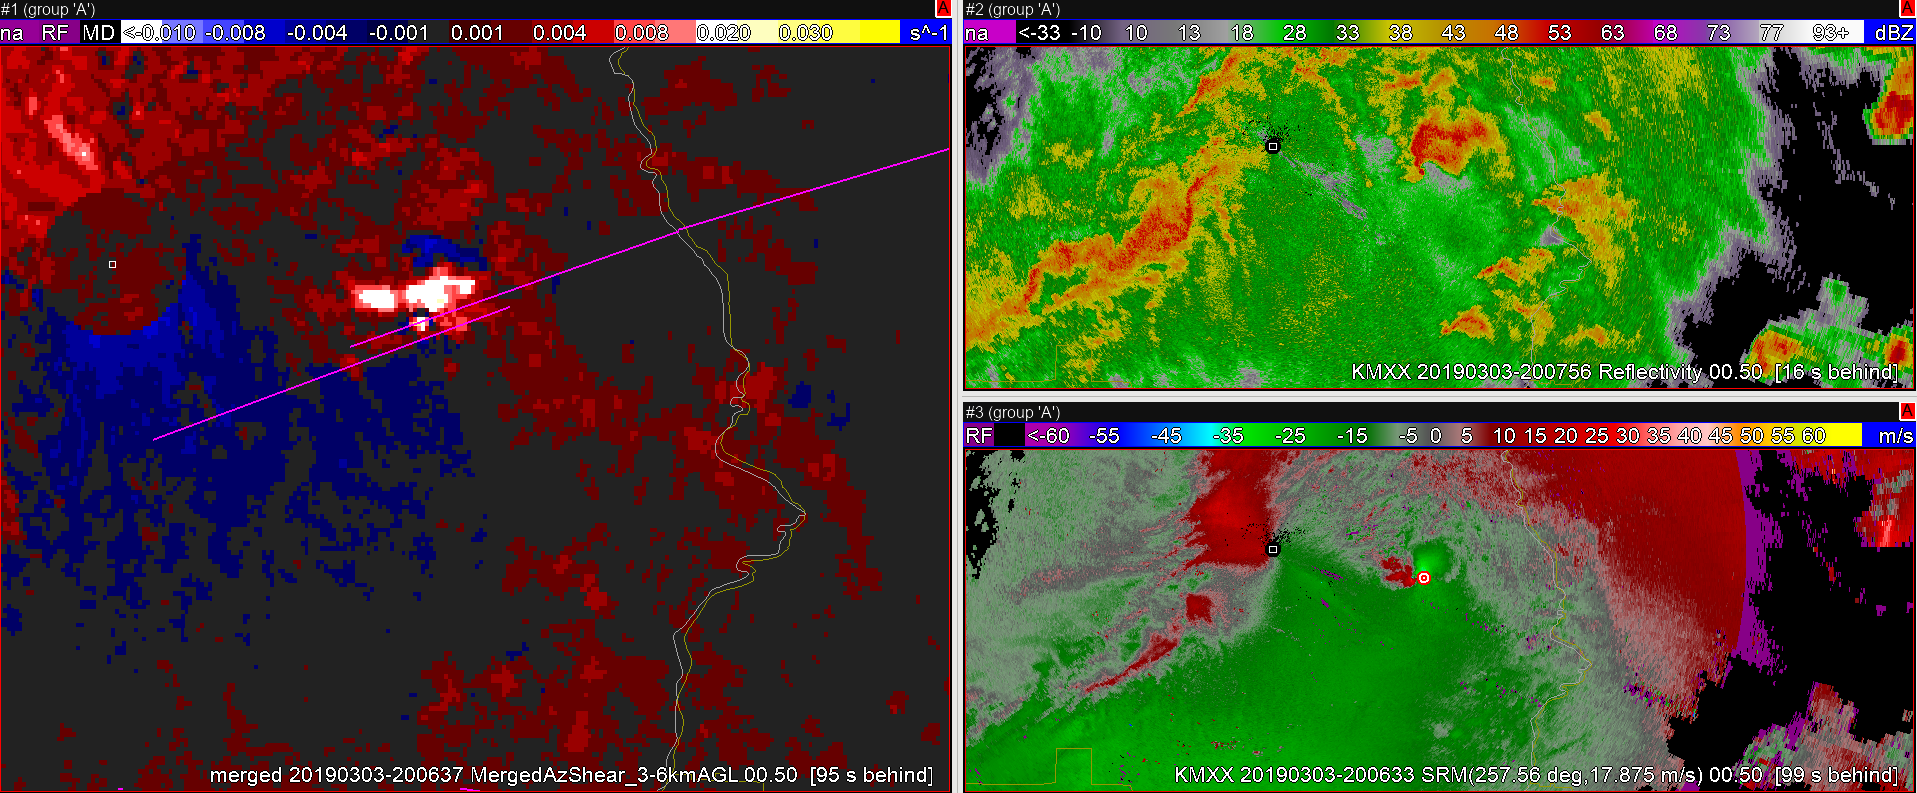 Merged 3-6 km azimuthal shear is displaced to the north of the tornado path (pink line).
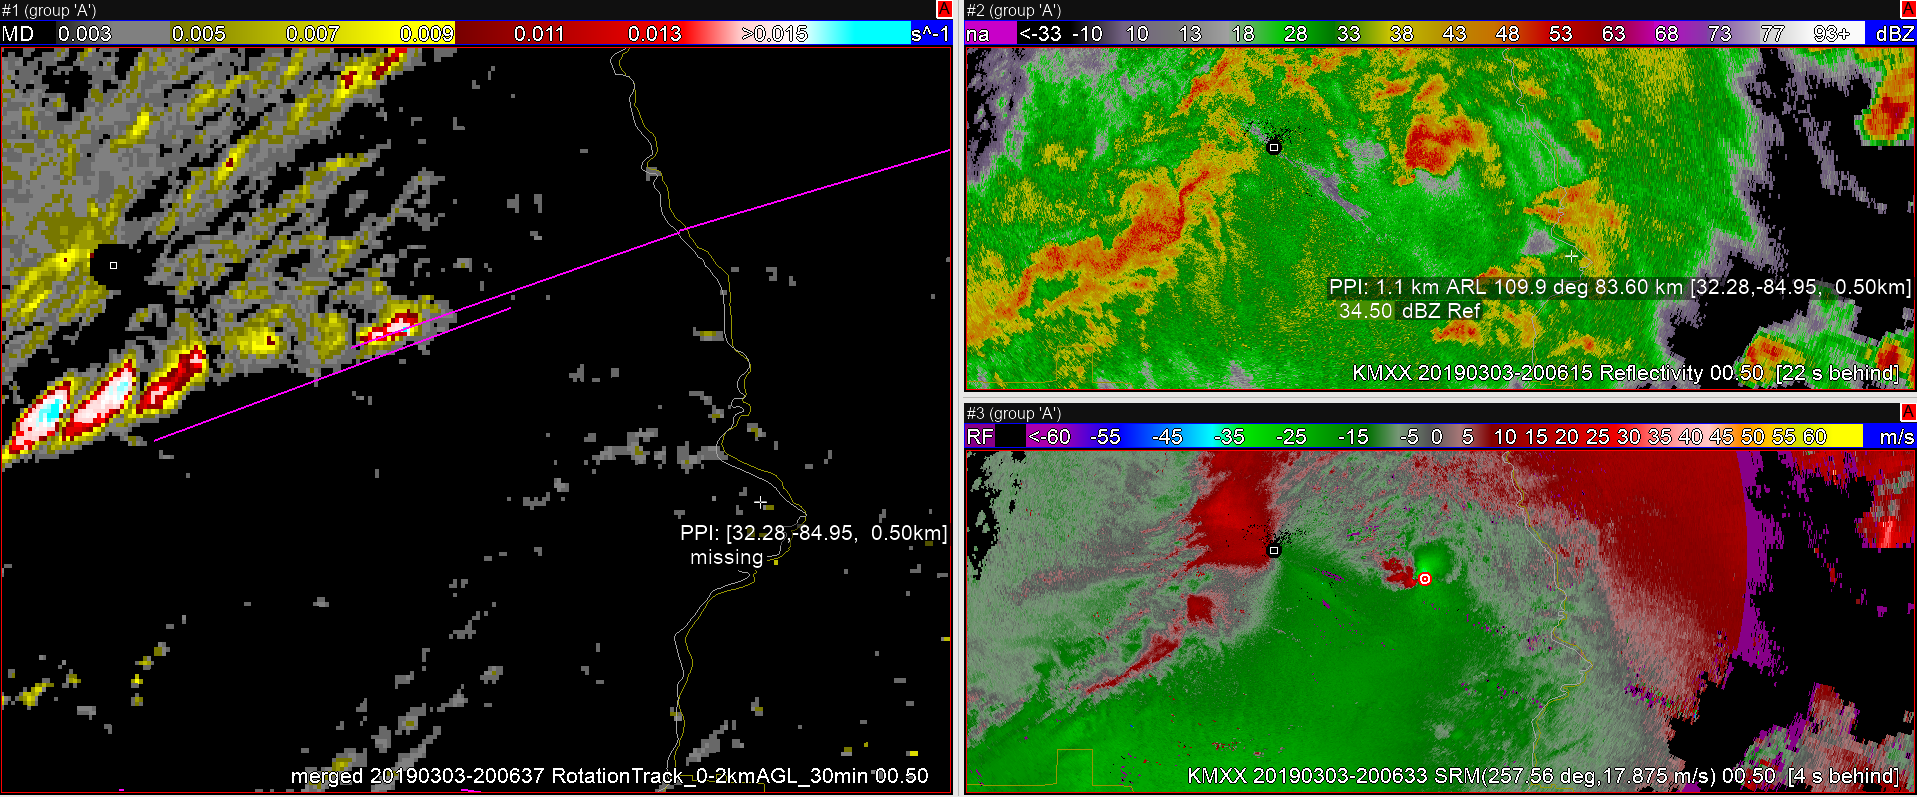 The merged 0-2 km rotation track has a very nice color scale (yellow to red to cyan) — key features really stand out.
CC plume or TDS were present on both radars. – Roy