An official website of the United States government
Here’s how you know
Official websites use .gov A
.gov website belongs to an official government
organization in the United States.
Secure .gov websites use HTTPS A
lock (
) or https:// means you’ve safely connected to
the .gov website. Share sensitive information only on official,
secure websites.
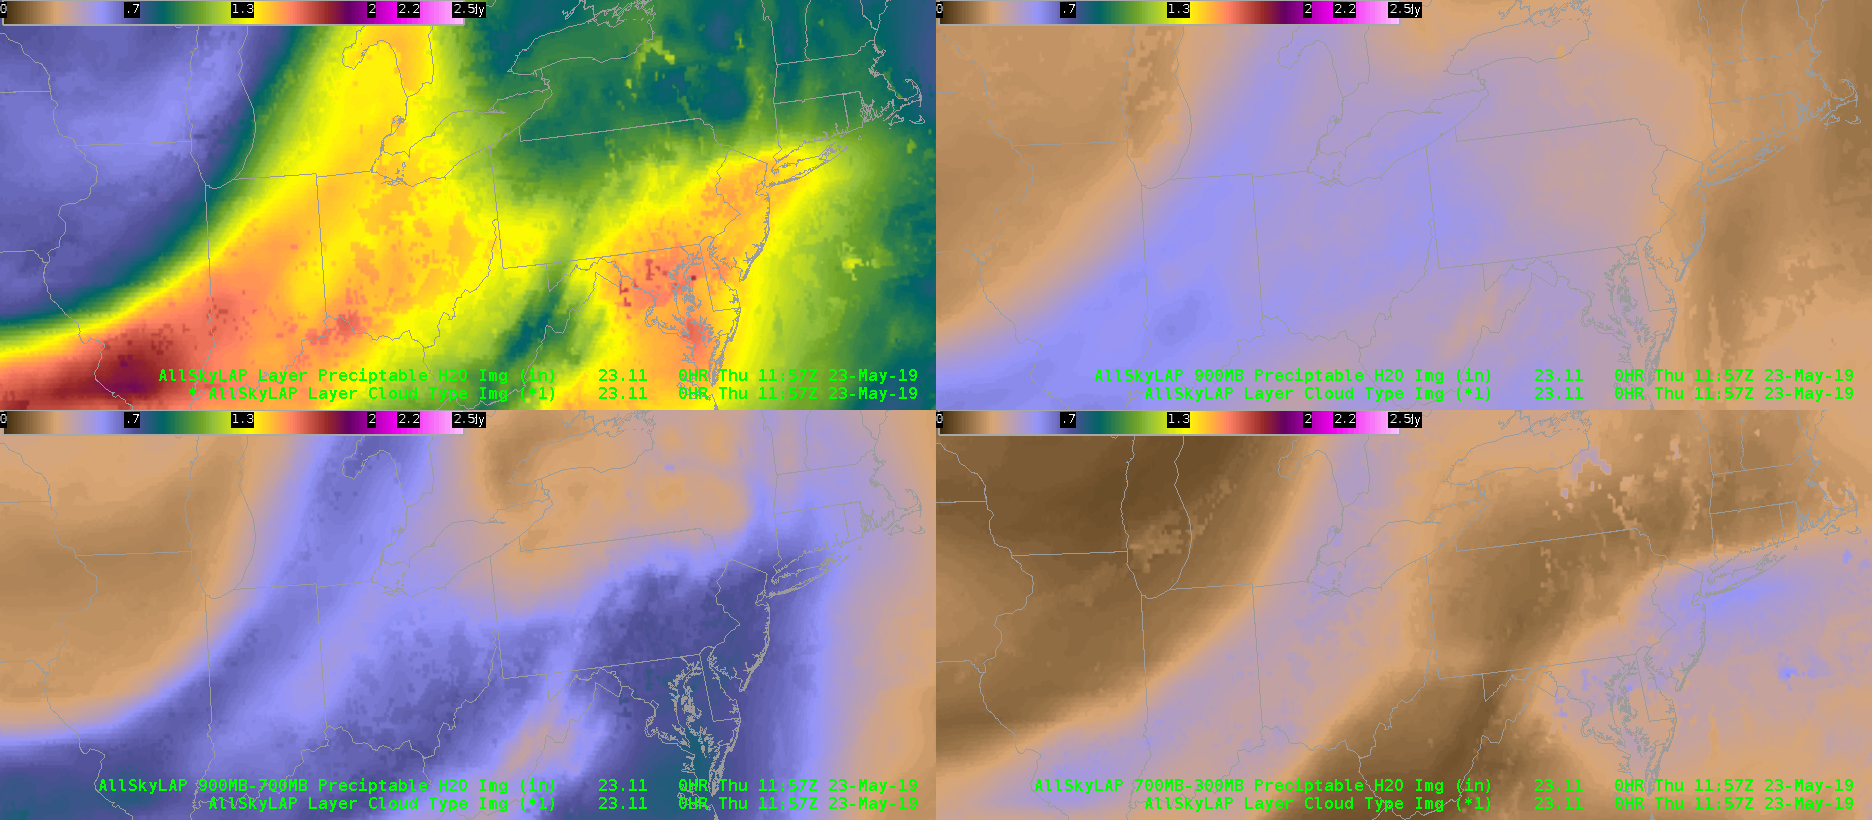
Covering the CTP (State College) area today. Initial convection has moved through, but models are suggesting redevelopment later in the afternoon along a front. The help see changes in the atmospheric moisture, I’ve captured an animation of a 4 panel AllSkyLAP PW.
For reference, the upper left is the total column PW, the upper right is 1-0.9 sigma, the lower left is 0.9-0.7 sigma, and the lower right is 0.7-0.3 sigma. What stands out to me surging eastward of lower values of the upper-most layer (0.7-0.3) towards the CWA, while the lowest layer (1-0.9) is remaining mainly unchanged. This suggests that the drying above the 0.7 sigma level (approximately 600-700 mb for CTP) may lead to increased values of DCAPE later this afternoon, so that any storms that do manage to initiate could have a threat of severe winds.
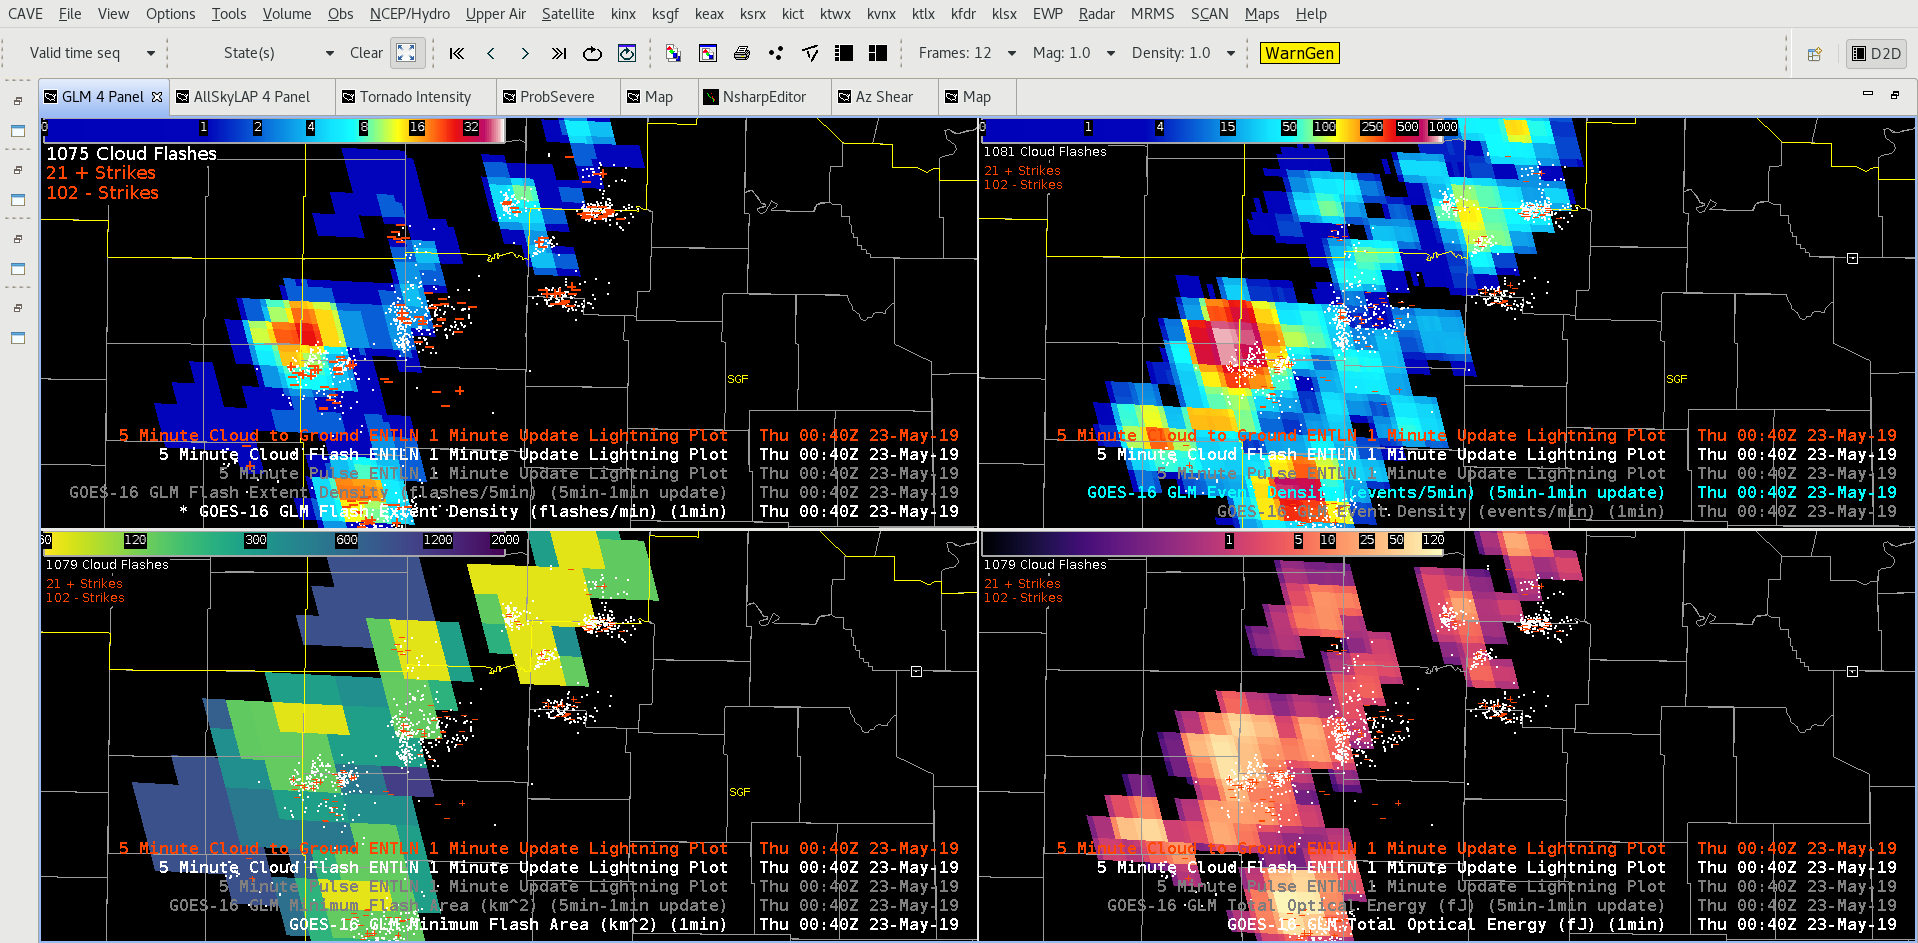
Comparing GLM flash extent density and GLM event density to ground based ENTLN data along the Kansas/Missouri border region, there is a notable minimum in GLM data with a couple of the large clusters of ground based lightning clusters, while the other ground based lightning clusters seem to correlate relatively well with GLM data. Very strange indeed
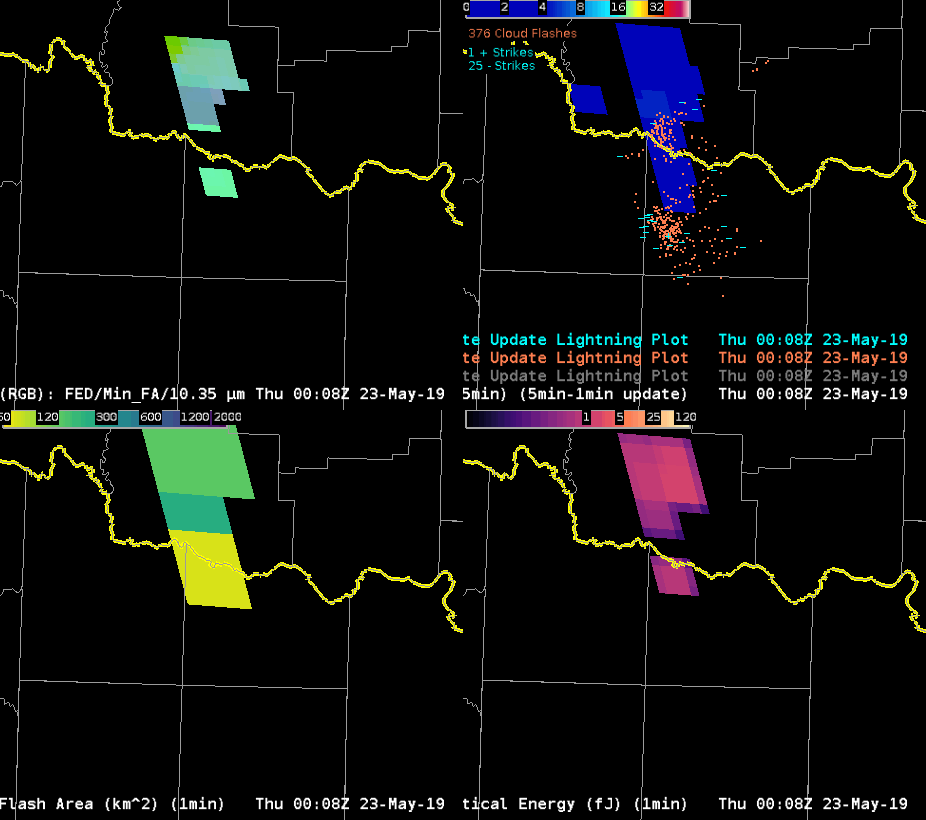
Storms continue just after 7pm near the Oklahoma/Texas border. A currently severe-warned storm saw a substantial and rapid increase in lightning activity observed by the GLM Flash Extent Density product. However, the ground based lightning network did not follow the same trend and remained fairly steady. The ground based data is more reasonable considering the storm did not experience any sort of significant strengthening during this time period. Earlier discussions with lightning detection experts suggested the low GLM FED count may be due to the location of lightning within the storm updraft region, which could impact how well GLM can sense it. That is difficult for the typical operational meteorologist to consider in real-time since it goes well beyond current training, and leads to decreased forecast confidence in the lightning data.
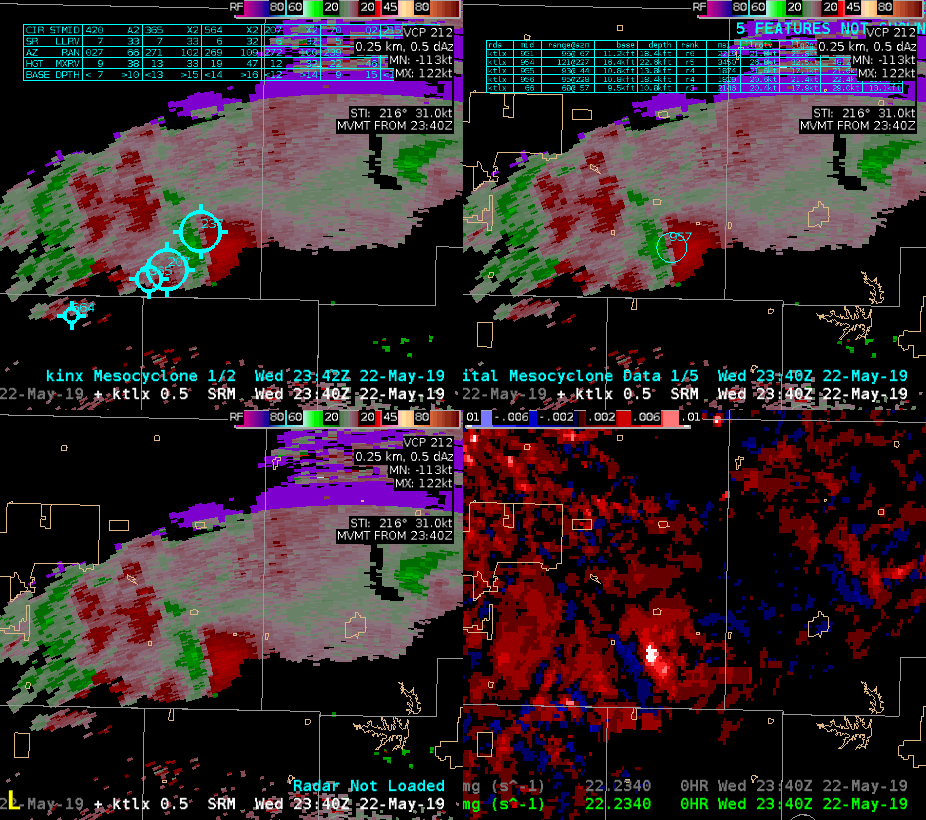
A cluster to 2 merged supercells traversed across northern Oklahoma this evening. The loop below shows the performance of all three mesocyclone detection algorithms.
The legacy MDA performed the most poorly of all 3 detecting several inaccurate mesocyclones with inconsistent tracking. The DMD performed remarkably well in both tracking and intensity on the main meso The NMDA experienced occasional dropouts where data was unavailable, but also performed pretty well on this storm. It particularly detected intensity well through the lifecycle of the meso. The AzShear product also tracked the main mesocyclone very well. The DMDA performed best of all three for this storm but the NMDA also showed promise. -Atlanta Braves
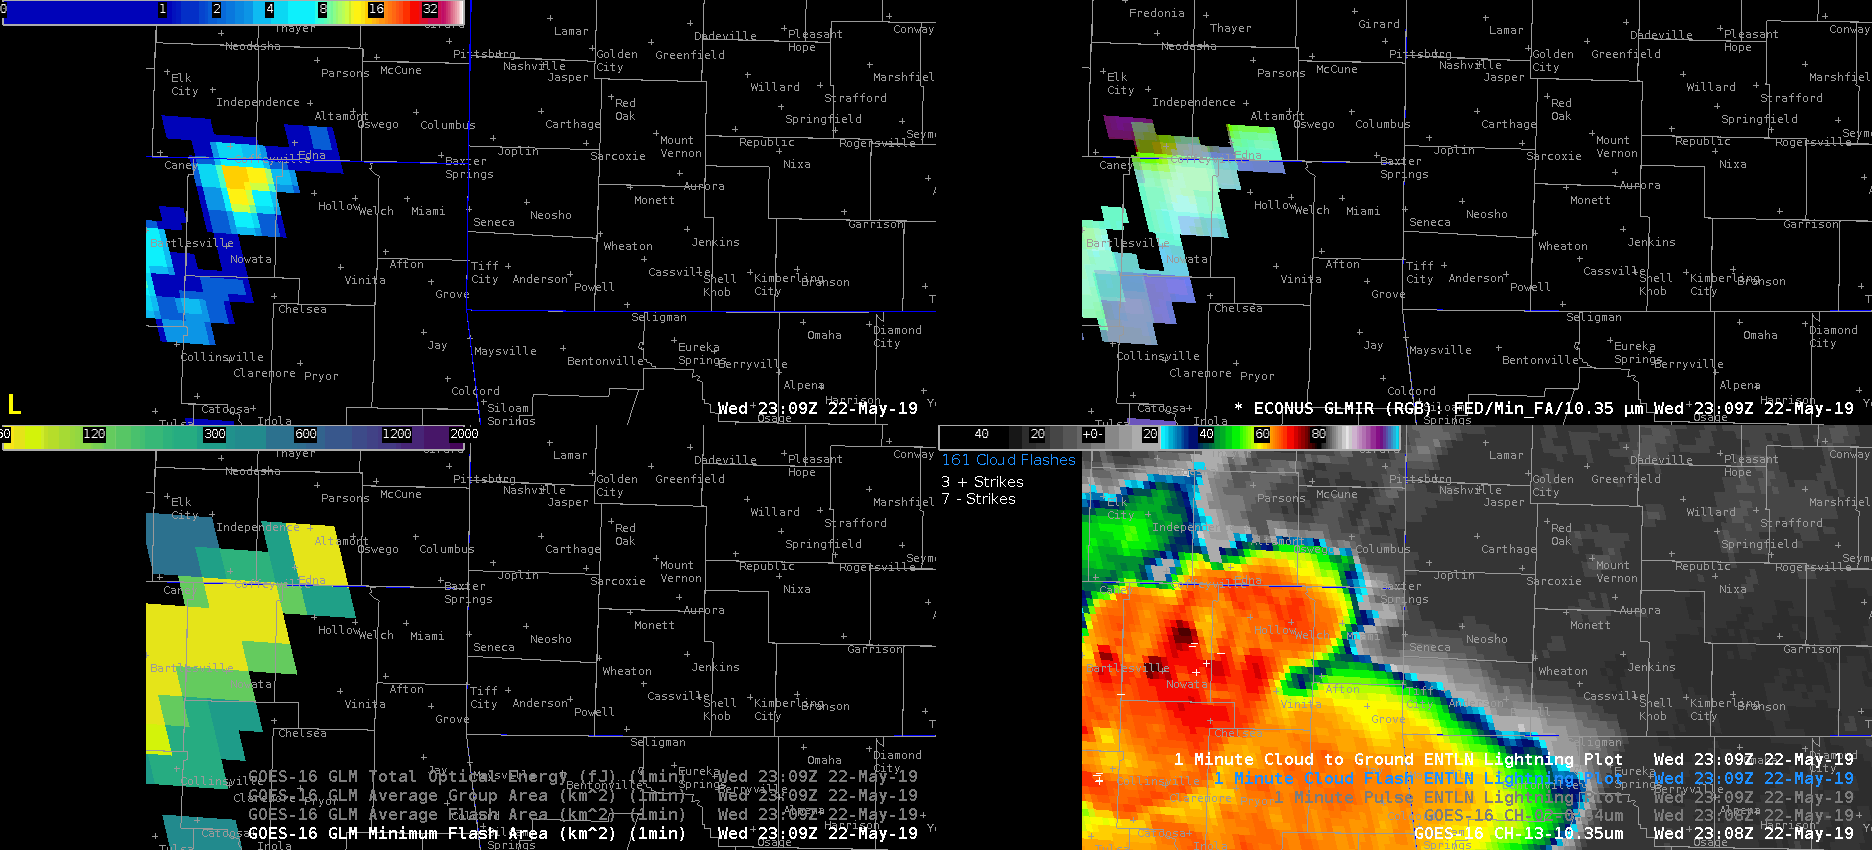
GOES-16 10.3 um IR channel in the lower right panel captured an exceptionally cold overshooting top at -82 C. This occurred toward the beginning of the animation at 2311Z in far northern Oklahoma (south of Coffeyville, KS) and preceded a large jump in the flash extend density (upper left). The minimum flash area did not change much during this loop, so it may be advantageous for this component of GLM to have a higher spatial resolution than what is currently used. The GLM RGB product (upper right) merges the flash extent density, minimum flash area, and 10.3 um cloud top temperatures. A group of bright cyan and white pixels helped highlight where all three of the aforementioned components were maximized. In addition to a substantial increase in the flash extent density 5-10 min following the -82 C cloud top temp., ENTLN ground based lightning flash counts doubled during the same time.
Although the environmental conditions already supported warning on this storm prior to the overshooting top (OT), seeing the FED and ground based lightning double, likely in response to the intense OT, may push a forecaster to upgrade the severity of the warning (larger hail, higher winds etc.) -Roy
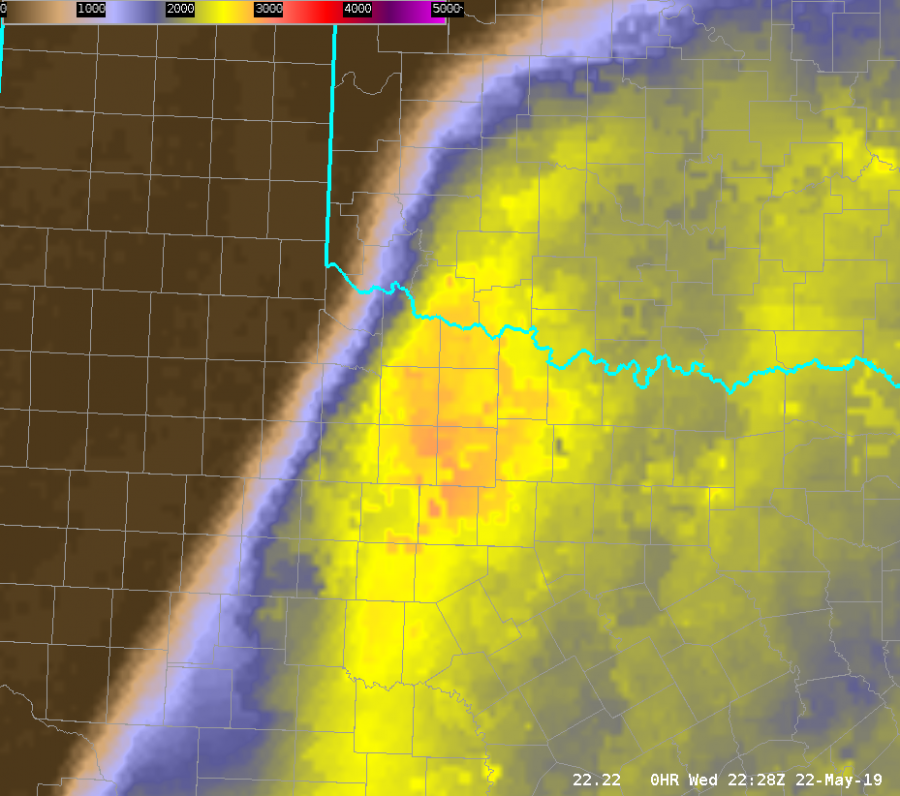
Additional convection was possible over southwest OK and/or northern Texas early this evening. AllSky product depicted a concentrated area of enhanced CAPE just south of the Red River, which is where the most robust CI took place right around 6pm.
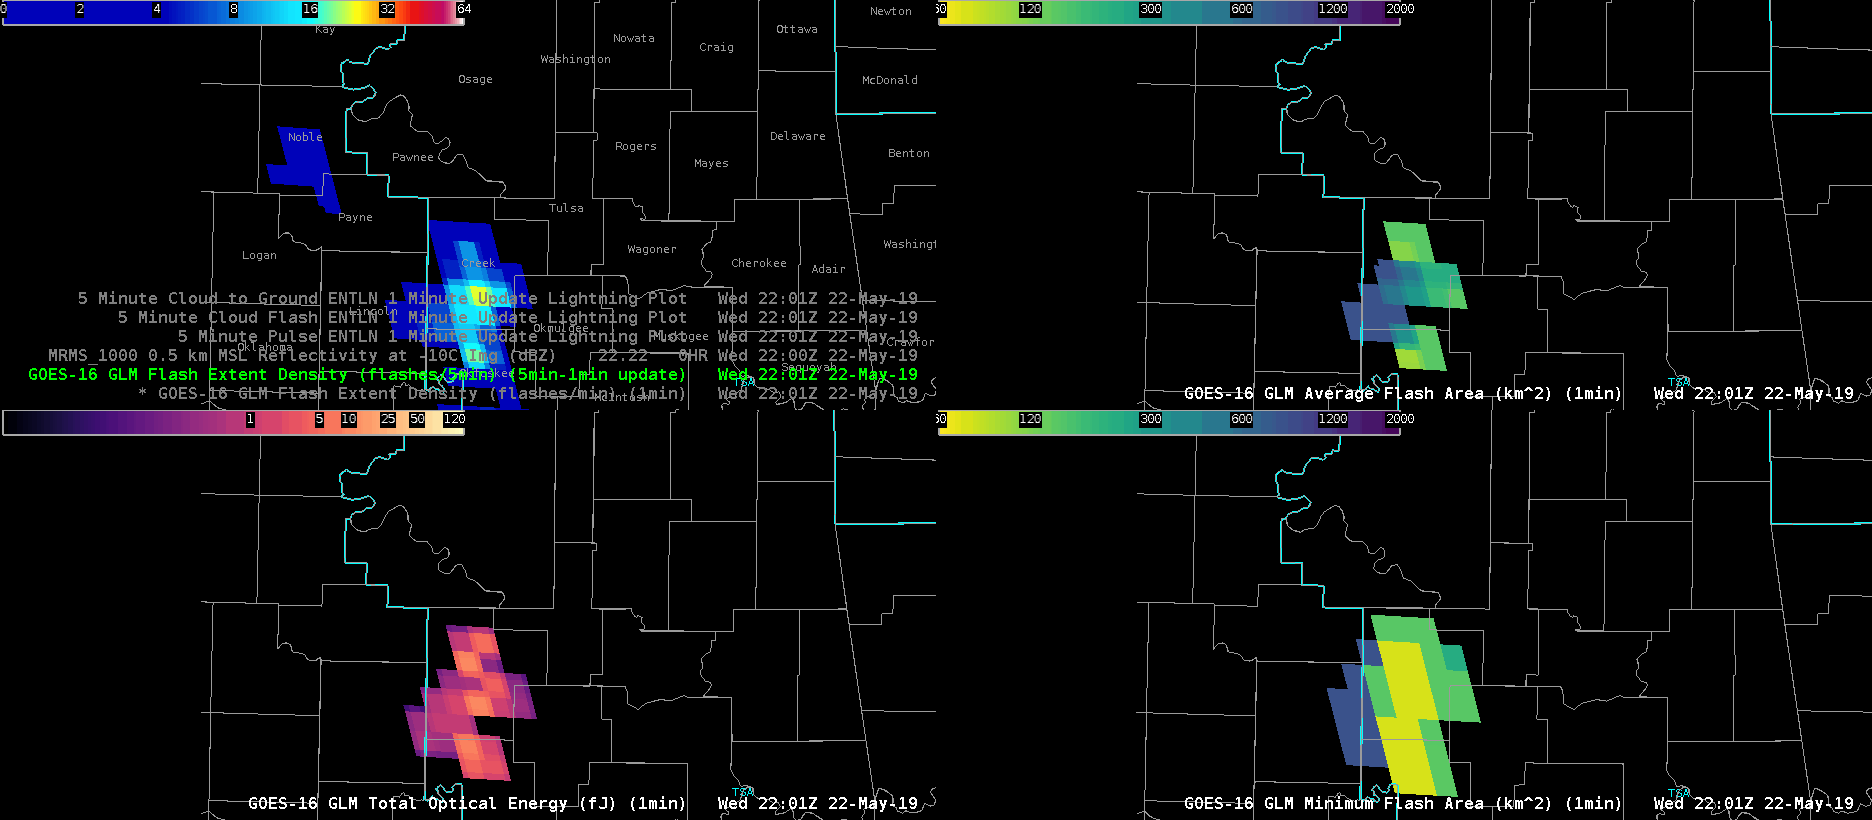
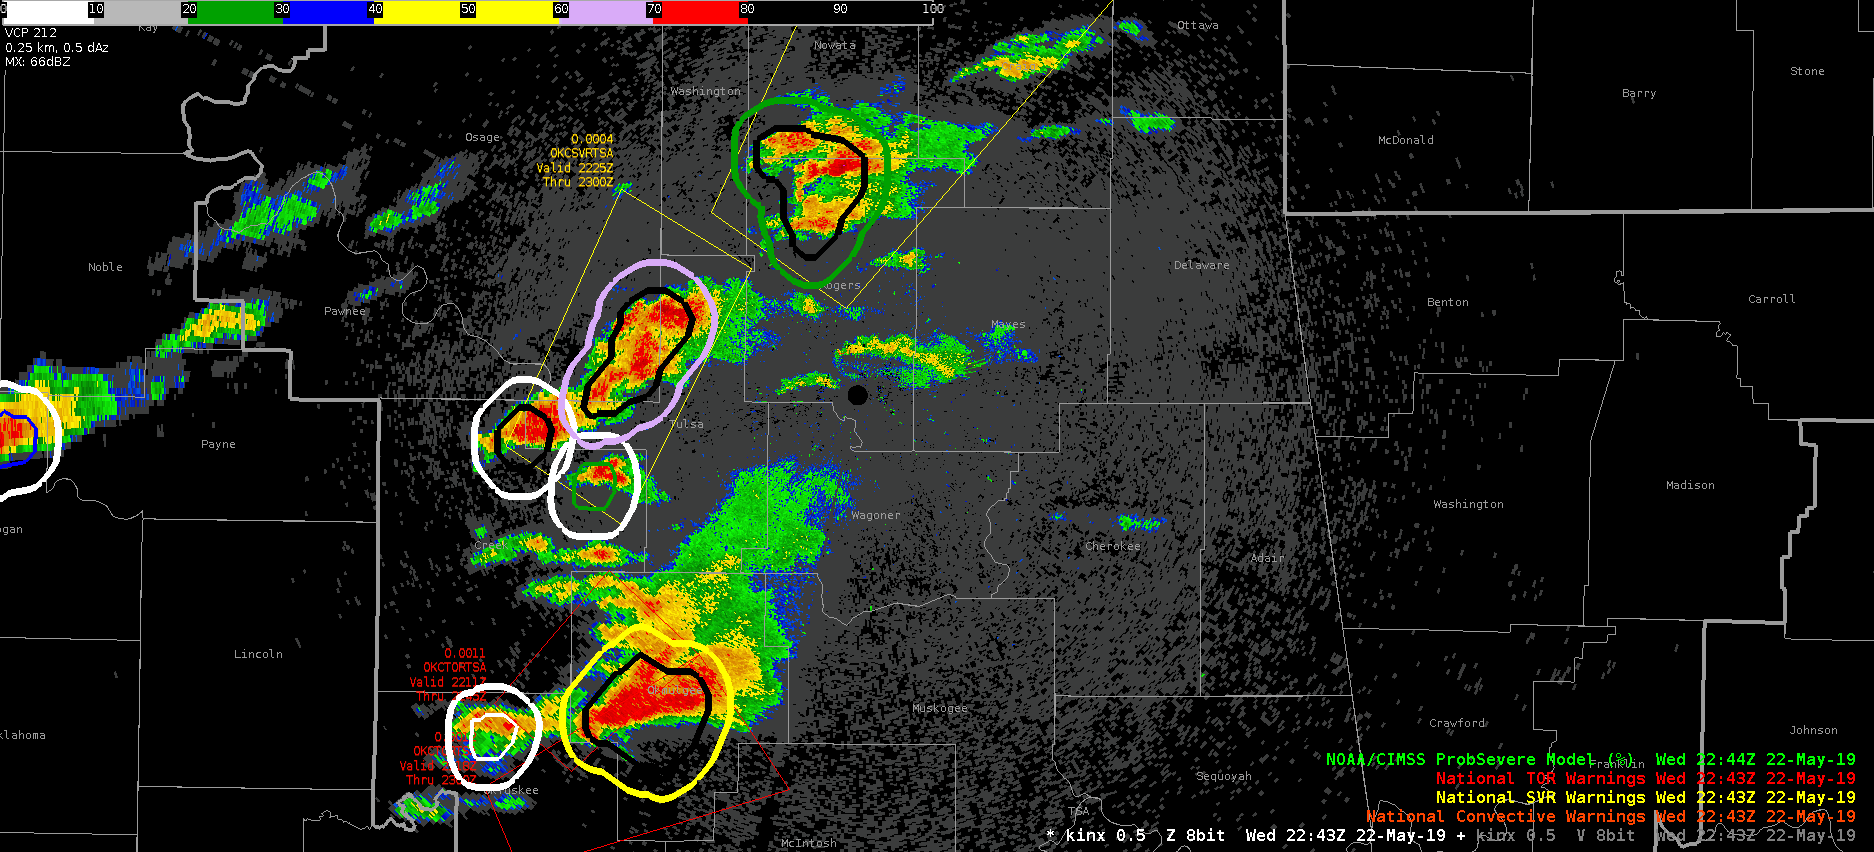
A loop of GLM products, particularly the Flash Extent Density and the Minimum Flash (top left and bottom right, respectively), appear to have depicted strengthening updrafts in the Tulsa area. In particular, notice the uptick in Flash Extent Density going from Creek to Osage Counties, as well as the area over northwestern Rogers County. The increases in FED coincided with low areas of Minimum Flash Area.
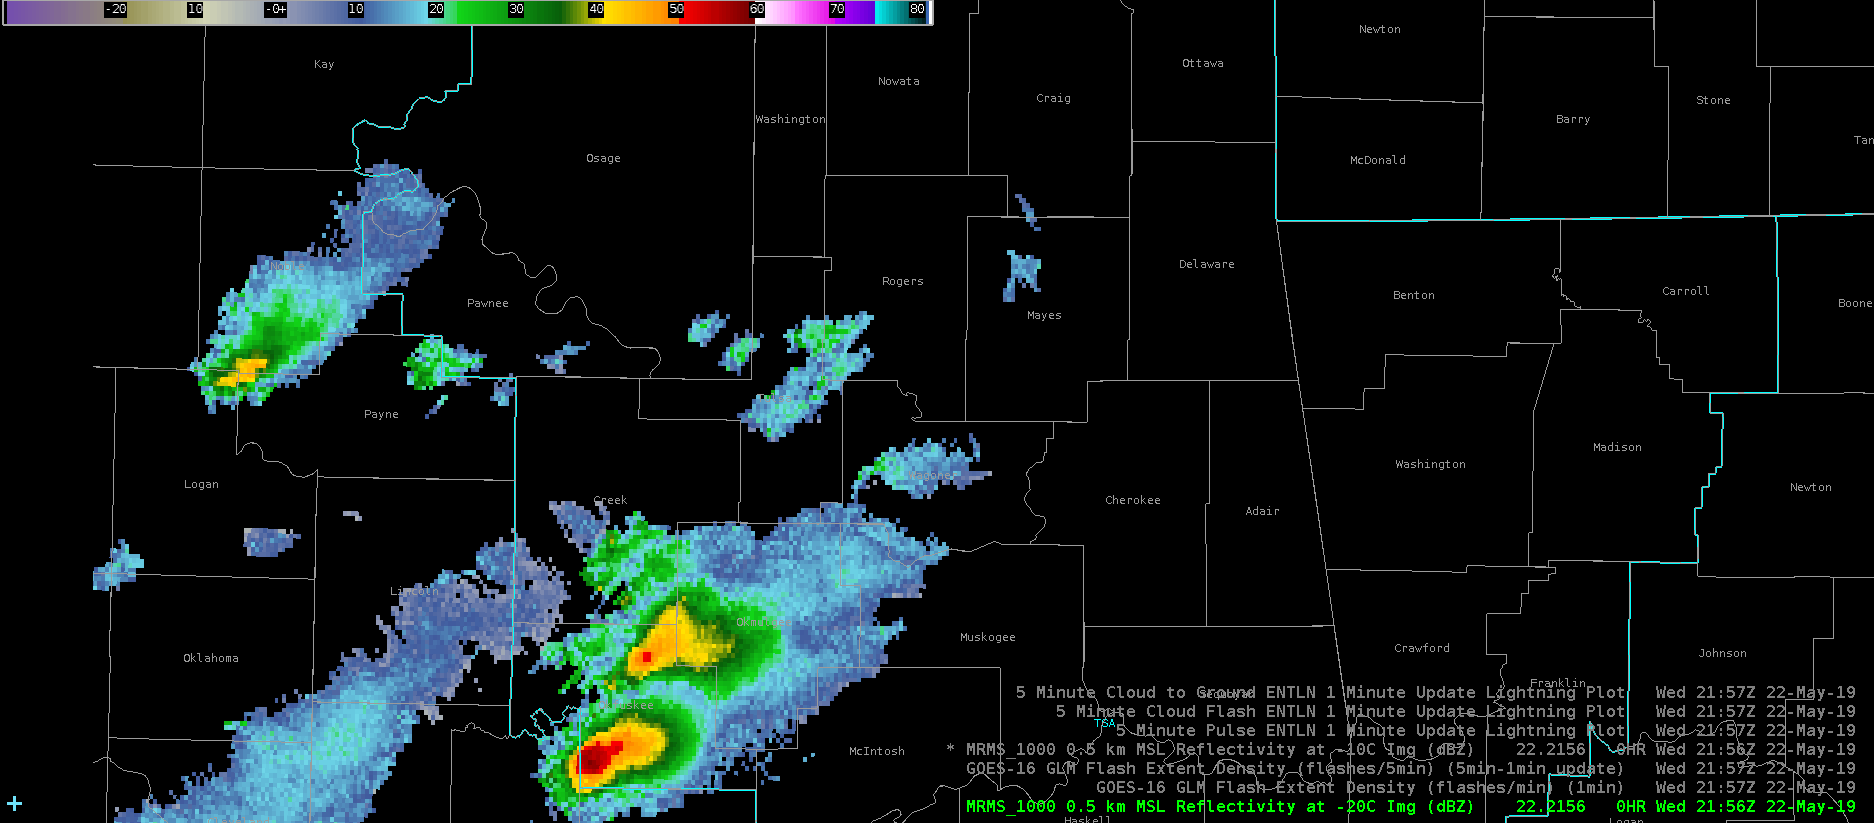
The MRMS -20C Reflectivity product shows the strengthening updrafts over the same time frame:
The GLM products increased confidence in a decision to issue two SVRs.
The Prob Severe Product has been very good for guidance today. See an example below.
Notice I have used an alternative color scale for the Prob Severe, but every cell with a Prob Severe of 80%+ (in black) was placed under some kind of warning. The prob severe was not the only tool used in the warning decision making process (as usual), but it was very effective in confirming the decision process using the base data.
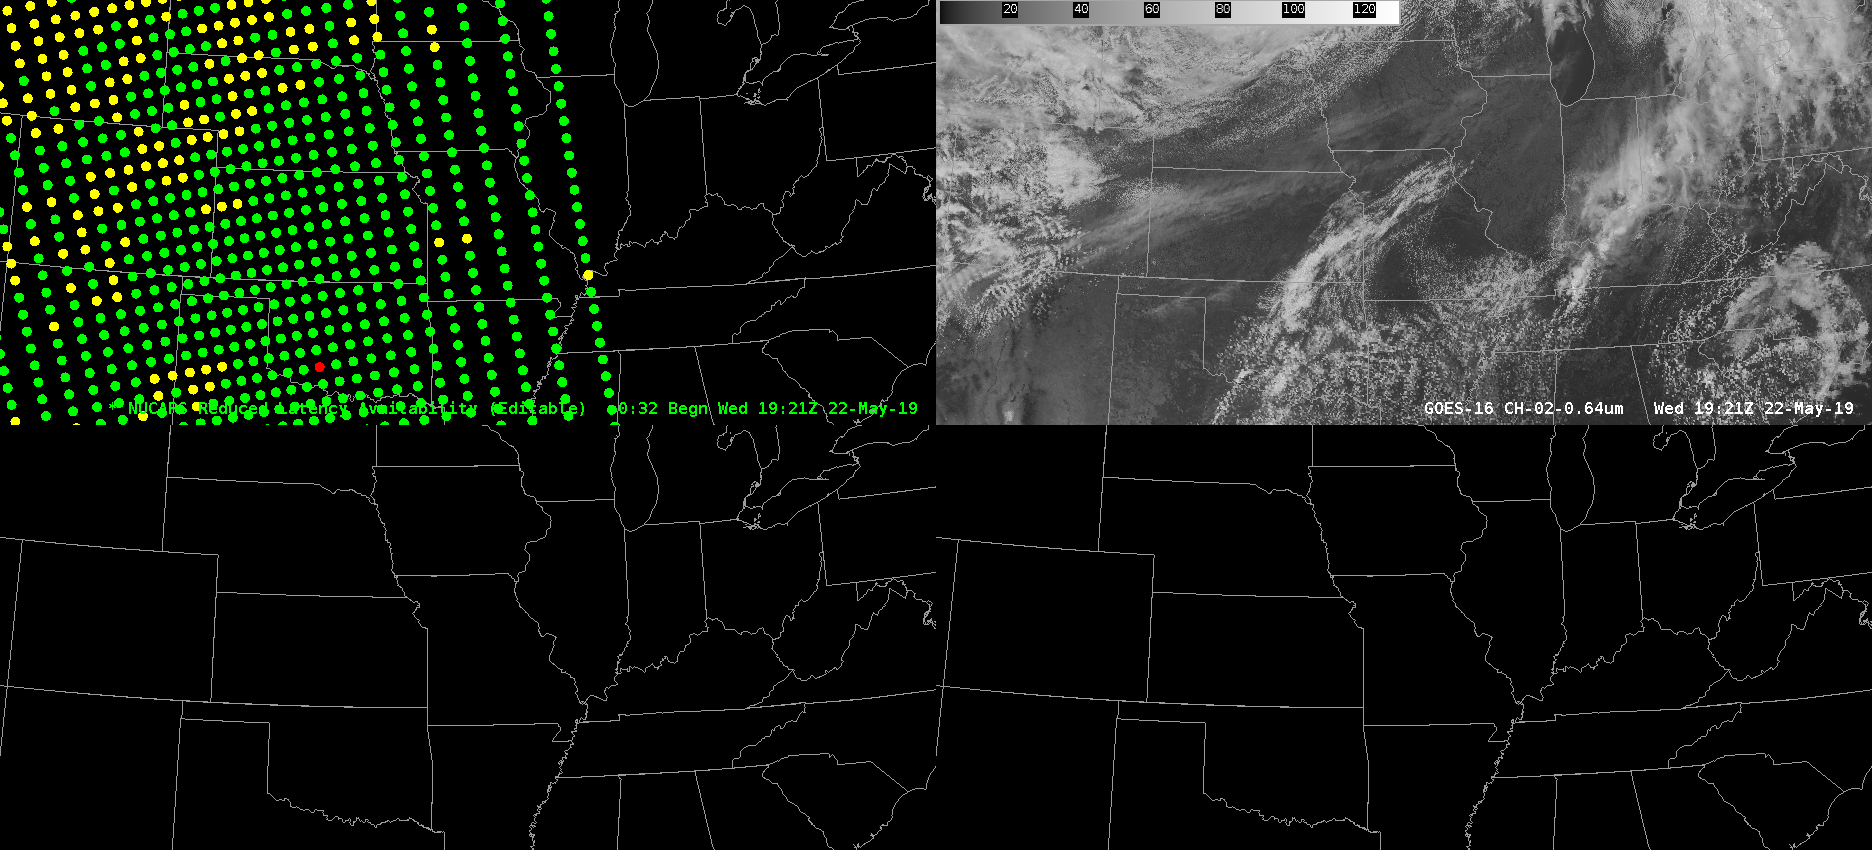
NUCAPS data points from a polar orbiting NOAA-20 pass matched up with clear skies. The following NUCAPS profiles were from the extreme southwest part of Missouri.
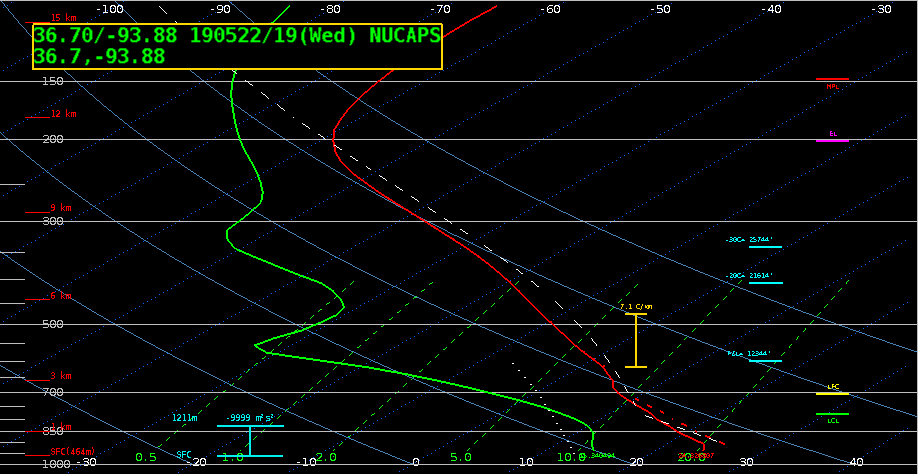
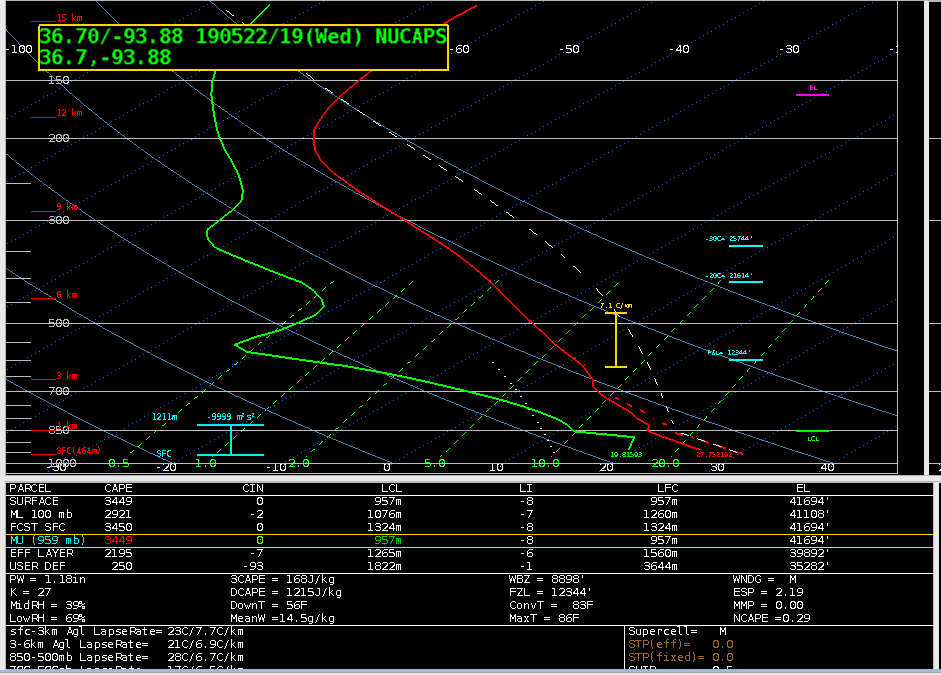
Unmodified NUCAPS profile from southwest Missouri, well south of Springfield. Surface dewpoint was estimated at 57-58 F. MUCAPE only up to 600 J/kg, with MLCAPE of 500 J/kg.
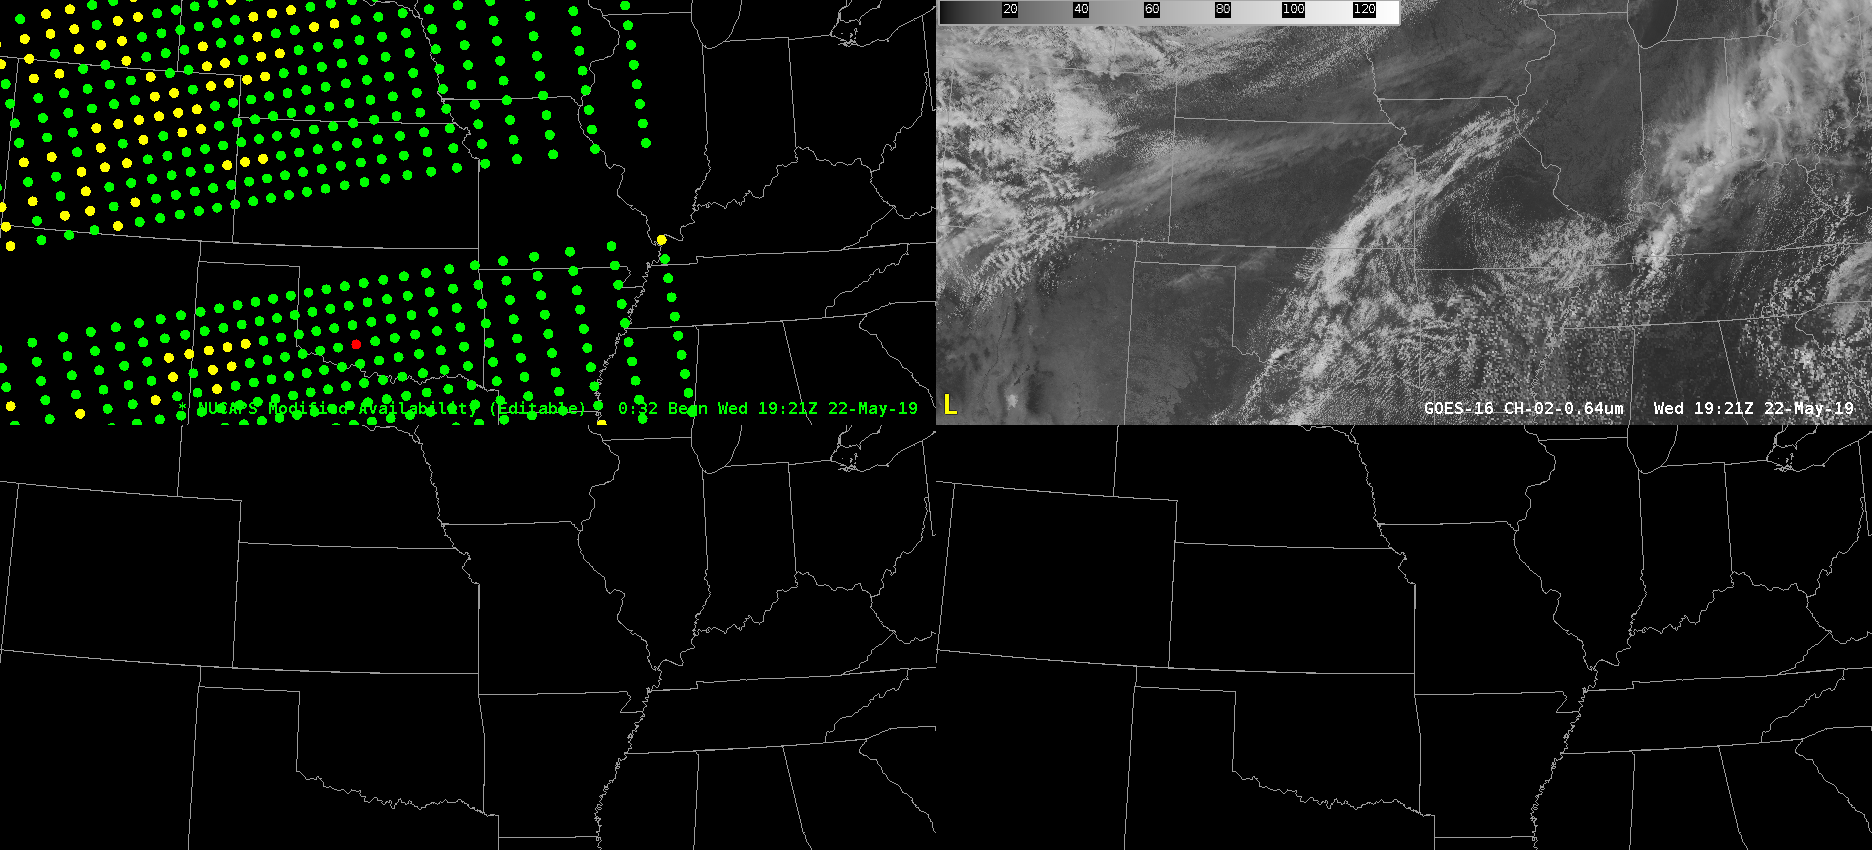
Modified NUCAPS data points from a NOAA-20 pass. Note data void through central Missouri….??? 🙁
Modified NUCAPS profile in same location as the unmodified sounding. Surface dewpoint was estimated at 67-68 F. High MUCAPE up to 3500 J/kg, with MLCAPE at 2900 J/kg.
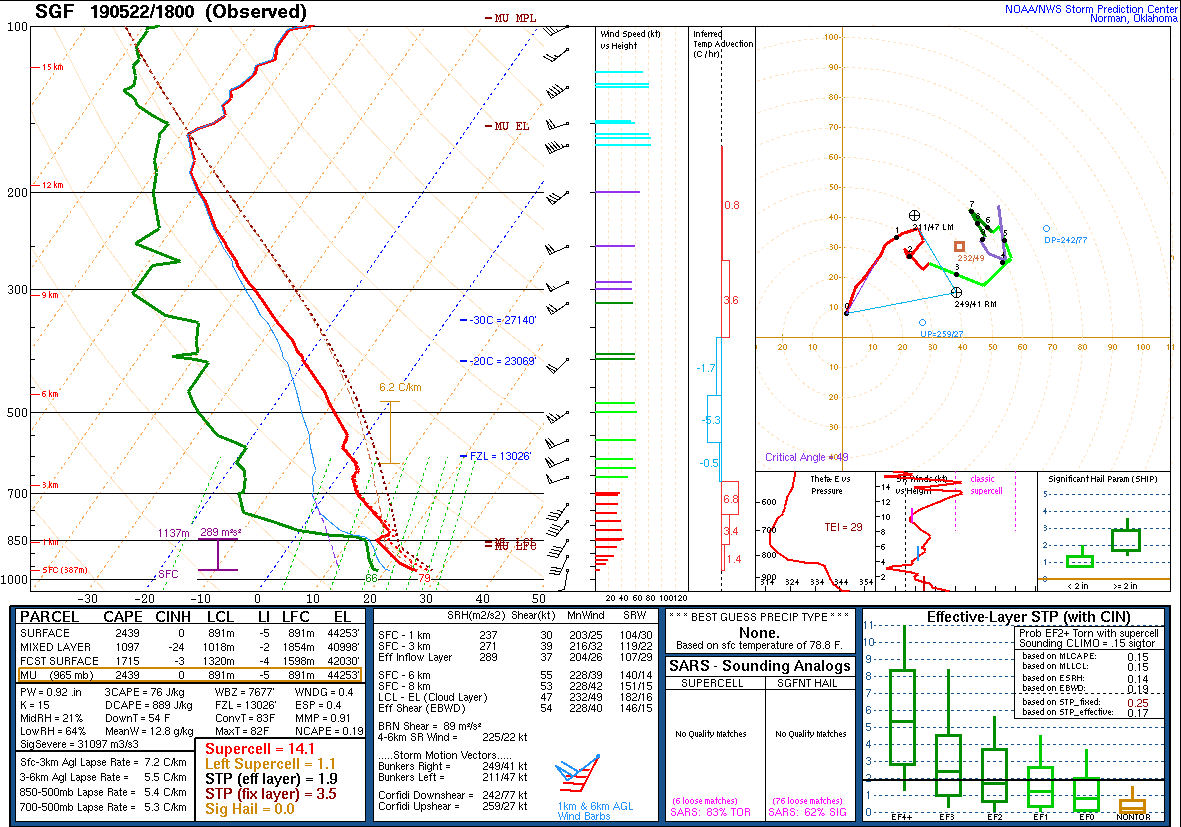
Observed sounding from Springfield, MO at 18Z. MUCAPE is 2500 J/kg, mixed layer down to 1000 J/kg. The surface dewpoint was about the same as that of the modified NUCAPS. But the difference in MU/MLCAPE is significant. I think the modified NUCAPS added value over the unmodified. Unfortunately, it seems a little overdone. With that said, the instability probably increased between the observed sounding time of 18Z and the satellite pass near 1920Z. An MUCAPE closer to 3000 J/kg is probably not too far off — maybe by ~500 J/kg. -Roy
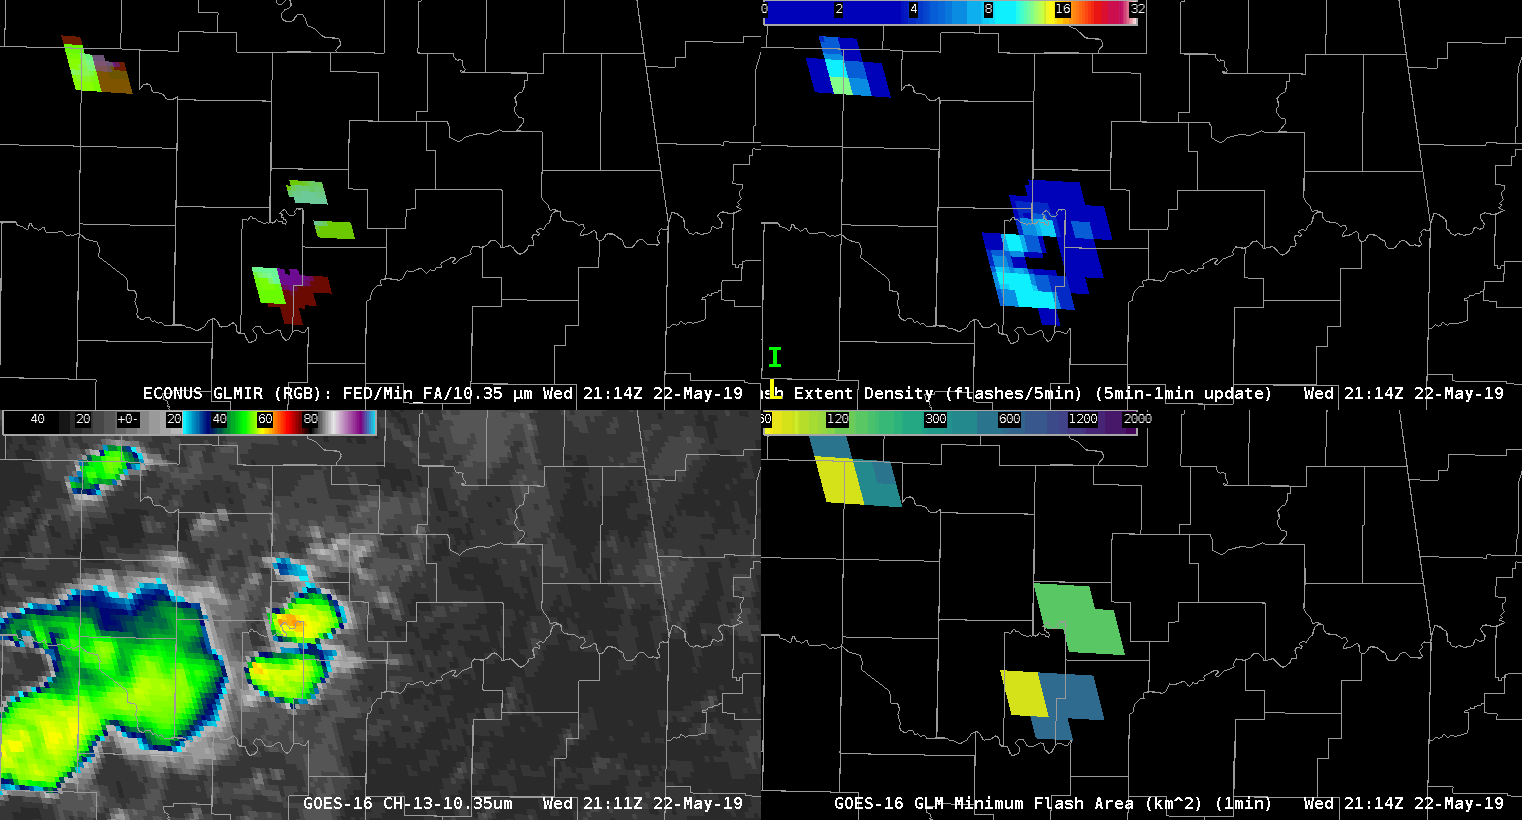
Loop on 22 May 2019, 21:36-22:06 UTC, showing a combined view of ABI Ch 1610.3 micron IR and GLM minimum flash area and flash extent density (top left). Other panels show the individual channels that contribute: FED (red), AFA (green) and IR (blue)
This pair of supercells near Tulsa, OK illustrates how flash rate and flash area information can complement one another. High flash rates and small flashes usually go together in a small updraft. However, at 2145 UTC the flash rate is much higher in the southern storm at the same time its minimum flash size is larger, with the opposite pattern in the northern storm. The northern storm was tornadic at this time. Shortly thereafter, the large flash rates decreased in the southern cell, and the average flash size became smaller, while cloud top brightness temperatures rapidly cooled and the extent of the anvil spread. The southern cell would soon go on to produce its own tornado.
The RGB panel in the top left combines the flash information together with the ABI 10.3 thermal infrared data: the coldest cloud tops and small flashes lead to a bright cyan color, and high flash rates push the colors further toward white. Early on the northern cell exhibits cyan colors while the southern cell is green and burgundy. Later, the southern cell becomes more cyan, while the northern cell takes on a more green hue.
Apparently, the jump in flash rate in the southern cell was an indicator of a strengthening updraft and the development of a mesocyclone. The drop in flash rate and minimum flash size might have been due to (1) a shift to small flashes that didn’t make as much light, (2) extinction of light by an increasingly ice-rich, optically thick cloud, or (3) other instrument artifacts. While the explanation is less than clear-cut, synthesis of multiple sources of information improves the ability to understand the observations.