GLM Lightning Preset 4-Panels

GLM lightning data provides very useful information to the operational forecaster, especially when properly combined with radar/satellite imagery. Would it be possible to take best practices suggestions from frequent users to lead to the creation of some pre-set 4-panel procedures that could be found in the AWIPS GLM data section (similar to what is available with radar base date, etc.)?

Sample 4-panel image pulled from the GLM Quicklook Guide

– Guillermo

Tags: None

Derived Motion Winds in AWIPS vs Rabin Optical Winds

Had attempted to compare the AWIPS Derived Motion Winds to Bob’s Optical Winds: https://www.ssec.wisc.edu/~rabin/winds/goes16/b13/1/m1/iris/layers_loop.html but encountered eventual CAVE crashes each time. While, on occasion, being able to display and toggle different layers of DMW in AWIPS before crashing, I did find that the Optical winds had much higher resolution wind data than what was available in AWIPS (with max density) and wind directions, by layer, seemed to well agree.

It is my opinion, though, that, while the DMW winds in AWIPS could be useful, they seem resource-intensive and come with a significant likelihood of freezing or crashing the CAVE instance. I find it much quicker and more reliable to view the similar data via Bob’s webpage.

– Guillermo

Tags: None

Modified NUCAPS Soundings-FSD

Noticed some issues with the modified NUCAPS soundings in the FSD area.  In some of the cases where the odd errors in the soundings.  Not sure what caused them or why they showed up but here are some examples.

First pass of NOAA-20.

Note the odd look of the temperature trace in the mid levels (note the sharp increase in temp just above 700mb).  This was noticed in a number of the neighboring dots.  This error seemed to get better the further away you got from this location.  We were hoping this would improve when the second pass came overhead later at 20Z.  Below is an example of this error from the second pass.

Second pass NOAA-20.

As can be seen from the image above, the second pass still had this error (note the sudden change in the temperature trace at about 600mb).  After looking at the conditions in the area, several questions as to why this was occurring came up.  It appeared the surface temperatures were rather reasonable and the atmospheric conditions were also close to what the sounding may be trying to depict.  There was some thought the modified NUCAPS may be having difficulty with the moisture trace rather than the temperature trace.

It was also noted that when using the “pop up skew-T” function it would not see this error.  It was discovered the reason for this is the “pop up skew-T” function would not see the modified soundings that Nsharp would display.  

Why this was occurring I really could not tell.  One of the PIs indicated the algorithm may not be handling the moisture trace well.  It was also noticed the surface wind fetch was coming from the southwest and that is coming off the sandhills of Nebraska.  This is a very wet area and is perpetually wet.  Is it possible that some localized moisture advection was not accounted for?  Can’t say for sure but mention it here to indicate what could be going one.  

-Strato-Dragon

Tags: None

NUCAPS MultiSat Sampling

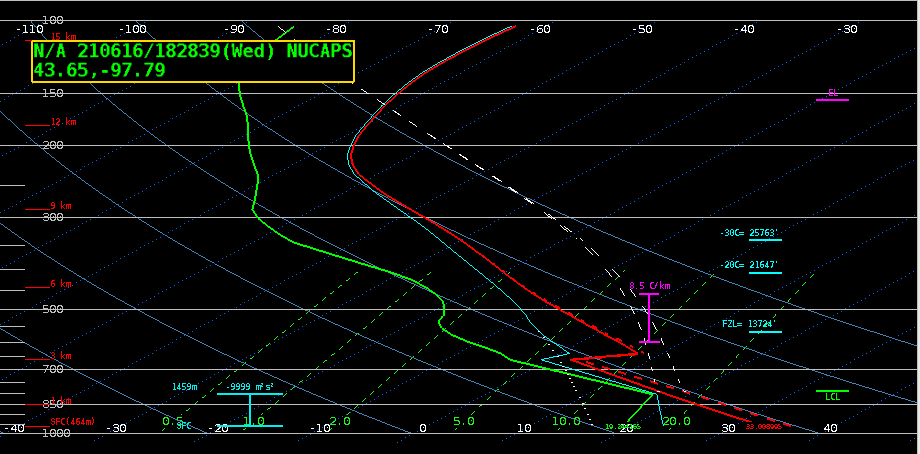
I was pleasantly surprised to see that when multiple sources of NUCAPS data were displayed at the same time that I could sample, via the pop up Skew-T and moving the mouse across the sounding swath, all sets of NUCAPS data and that it wasn’t dependent on which source of NUCAPS was ‘editable’.

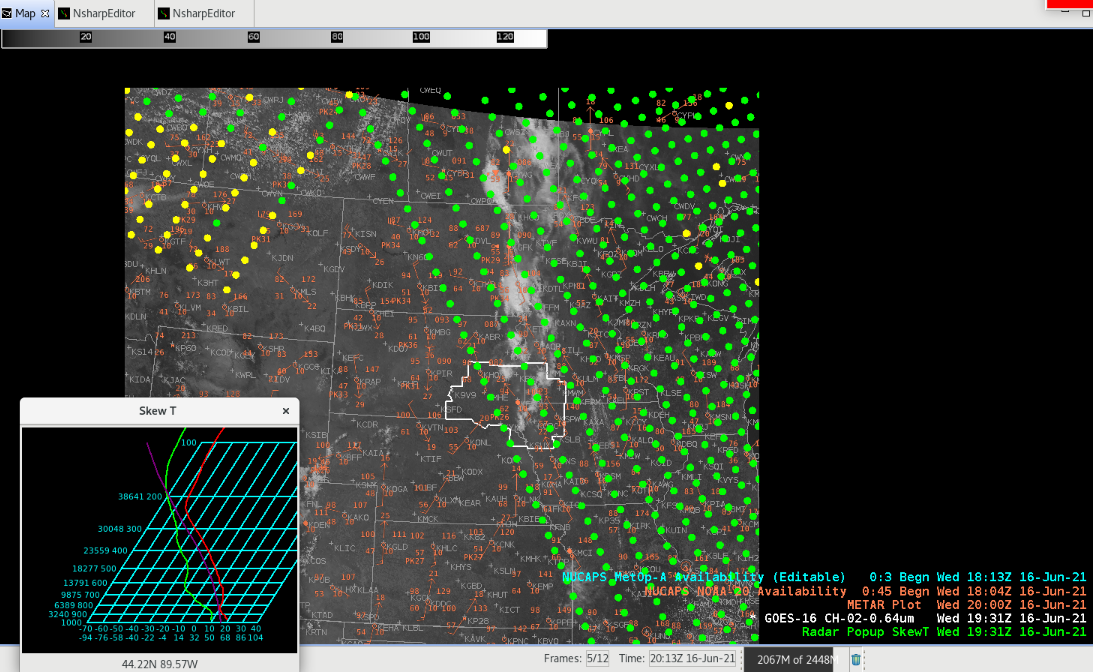
However, depending on WHICH source of NUCAPS soundings was indicated as ‘Editable’ (in this case, the METOP-A – in blue), only those soundings could be opened in the NsharpEditor. Not necessarily a big deal but it is something that some folks may need to have explained to them.

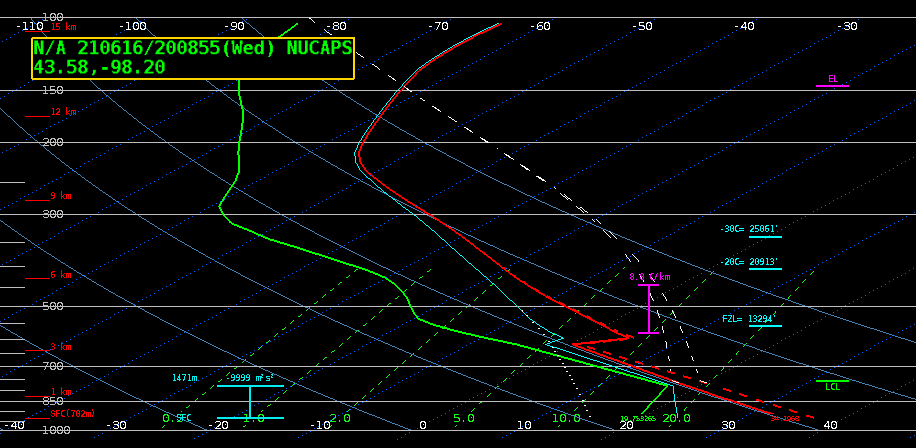
Additionally, I have found the pop up Skew-T doesn’t always work. Often, it seems that when the NUCAPS data is more than an hour old or so, moving the mouse across the soundings results in no changes in the pop up readout. Is this related to the ‘age’ of the NUCAPS data or a bug with the pop up Skew-T?

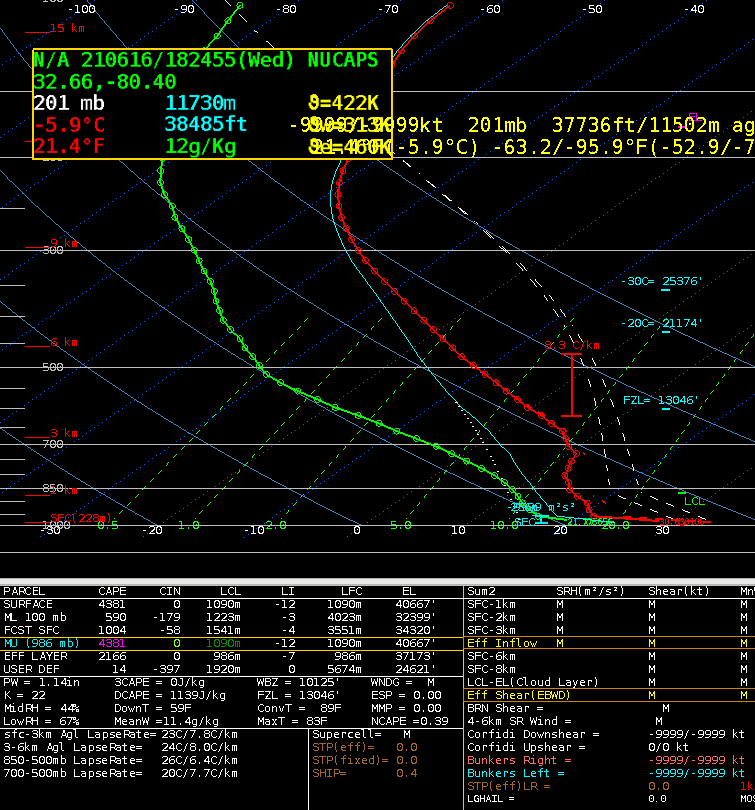
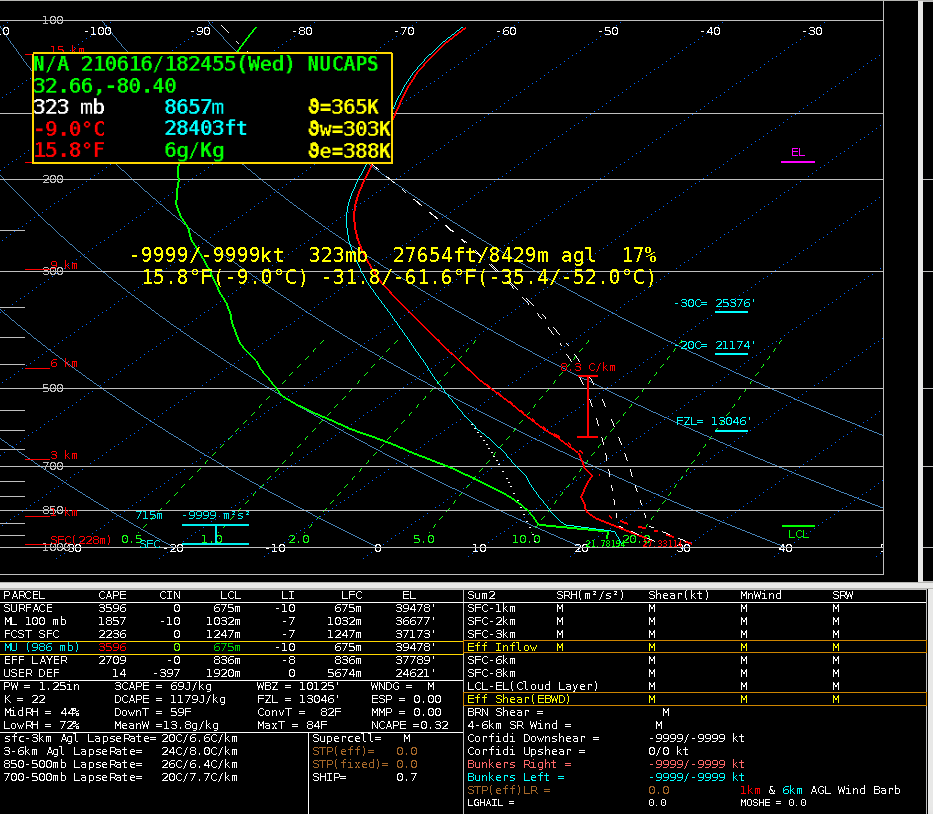
Similarly, a new pass of data came in and I was unable to get updated readouts from the pop up Skew-T, therefore I ‘unloaded the “Radar Popup SkewT” (green legend, above), turned off sampling, then went back through the process of Volume > Popup Skew-T, turning on Sampling (right click), and sample cloud heights from NUCAPS (top of right click menu) and was able to then sample the NUCAPS.

– Guillermo

Tags: None

NUCAPS sounding near Charleston

I made some comparisons between a NUCAPS sounding at 1824z near Charleston, SC and the 12z observed sounding at Charleston, SC. Both soundings were manually modified to a surface temp/dew point of 87/72 (modified NUCAPS soundings were unavailable at this location). Overall the NUCAPS sounding matches the overall profile fairly well with mid-level drying and a fat CAPE profile aloft, with similar SBCAPE, PWATs, and DCAPE values.  I did notice a warm layer centered near 700mb (the base of what appears to be an elevated mixed layer), which resulted in higher MLCIN values and higher 700-500mb lapse rates. This could indicate more capping than is actually present, though perhaps stronger convection where the cap does break. This warm layer also appears warmer than in an 18z HRRR initialized sounding at the same location.

I also looked at Gridded NUCAPS 700mb temperature data compared to 18z 700mb temperatures from the RAP and GFS. While there was some missing data in the area of interest from Gridded NUCAPS, the values just south of that area are higher than what the models were showing.

Late day update: the modified NUCAPS soundings eventually filled in.

It was a few degrees cooler at the surface, but that may be because it went off the 17z RTMA rather than the 18z METARs at that time.

– Barry Allen

Tags: None

ProbSevere and GLM with supercell moving offshore the South Carolina coast

A thunderstorm located east of Charleston appeared to have some supercell characteristics as it moved south-southeastward towards the coast, with a kidney bean shape in reflectivity and a weak mid-level mesocyclone, as well as some deviant motion from the northwesterly flow. As it was over land it appeared to be strong but sub-severe, and maintained generally consistent 20 to 35 percent ProbSevere in v3. ProbSevere v3 seemed more consistent overall, with v2 jumping up and down more often, dropping down into the single digits at times. ProbSevere v3 did jump down below 20 percent briefly when GLM FED really dropped down. But the consistent lower-end probabilities at least indicated that this was a storm to be watched relative to the lower v2, and this may have at least allowed lead time on a low-end special marine warning before it moved offshore and strengthened.

The timeseries is somewhat useful if you just have one storm to look at, but with multiple storms I would probably just look at the loop in the ProbSevere plan view instead.

After it moved offshore, GLM FED increased, slightly in advance of a jump in MESH and associated jump in ProbSevere v3. ProbSevere v2 jumped ahead of v3 in probabilities as often occurs, though at that time MESH around 0.9 inches may have warranted the more conservative ~50-60% v3 approach. Later MESH jumped up to around 1.3 inches, and ProbSevere v3 jumped above 70 percent at this time as well.

Clockwise from top left: MRMS 18dbz echo top, MESH, reflectivity/ProbSevere/low-level azimuthal shear at 2130z.
Clockwise from top left: GLM FED, minimum flash area, reflectivity/ProbSevere, total optical energy at 2130z.

– Barry Allen

Tags: None

ProbSevere v3 for Low End Storms

In the training we reviewed for ProbSevere v3, it was frequently mentioned that overall the values we would see in v3 would tend to be a bit lower than in v2, which is what you’d expect in a better calibrated model. (Given what we know about storms and their potential severity, v2 often seemed a little too sure of itself, right?)

However, in looking at the relatively puny convection over Charleston’s CWA today, I’m seeing a lot of the opposite. That is, instances where v3 is noticeably higher than v2. As I think about it, I believe we’re seeing more evidence here of a better calibrated model, as it’s ultimately showing less certainty than v2 about storms not being severe which seems to make sense intuitively. We’ve all had our share of days where a storm one thinks is relatively benign ends up overperforming and though I don’t have any actual evidence to prove this, it appears that ProbSevere is, in its way, taking that into account. Ultimately, this is giving me a bit more confidence in its output.

An example of a somewhat low end thunderstorm where v3’s percentage (29%) is noticeably higher than v2’s (2%). V2 seems a bit too certain that this storm is not severe. As forecasters, we know better.

– Earl Grey Tea

Tags: None

Random NUCAPS Observations

Thunderstorms in the Charleston CWA are marginally interesting at best today so I have been spending some time browsing some parameters that aren’t necessarily severe weather related. NUCAPS availability across the eastern United States looks pretty good today!

I haven’t had the opportunity to use the pop-up skew-t functionality in AWIPS until now (didn’t even know it existed, in fact). It is a bit buried and it took me a few tries to get it to work, but this makes it a lot easier to go through all of these different points and try to find an area of interest without having to go into the occasional information overload that is NSHARP unnecessarily.

After looking at some soundings I went to explore the gridded NUCAPS data, which looks very promising. There was a slight learning curve as I had to get used to the polar orbiting satellite paradigm once again, but being able to see the data from all of the points in a plan view format can help with the information overload mentioned above. I noticed the gridded NUCAPS has some ozone and Haines Index fields. Air quality and fire weather are kind of a big deal where I forecast out west, so these fields will be fun to explore once they’re available in my home AWIPS. Seems like the Ozone Anomaly fields might be a bit easier to understand than the Total Ozone, as apparently Dobson units measure the ozone differently than something like PPM. I tried to investigate this data for the west after that NUCAPS pass came in today but a lot of the gridded data was incomplete. I suspect it was due to the lack of available soundings (saw a fair amount of yellow and red for whatever reason). I’ll take another look tomorrow.

– Earl Grey Tea

Tags: None

ProbSevere in Jacksonville

The 0.5 degree SRM from JAX shows a concentrated area of wind within the cluster of storms in St. John County, FL with radar estimates of the wind near 50kts. Given the lightning jump illustrated by FED values quickly rising to ~170 flashes per 5 min, the storm is intensifying.

However, ProbSevere values are rather low with version 3 showing only 22% and version 2 showing 33%. ProbWind surprisingly was even lower with only 19%. This is a reflection of the lack of base radar data involved in the ProbSevere and ProbWind algorithms. Especially for ProbWind, base radar velocity data needs to be included in ProbWind for this product to be useful in identifying wind producing severe thunderstorms.

It would be useful to integrate base radar data from multiple single radars and combine these values into one algorithm. It may be useful to identify notable/sharp changes within velocity data between pixels which could help in picking out downdrafts.

– Fear the Shear

Tags: None

Modified NUCAPS Sampling: PopUp vs Nsharp

When trying to sample NUCAPS and modified NUCAPS soundings (via Volume > Popup SkewT) I realized that the popup SkewT only showed the actual NUCAPS profile (there was a notable peculiarity in the modified profile boundary layer that I was looking for in the popup).

I don’t think this was an error in AWIPS, because when right-clicking and selecting ‘sample cloud heights/radar skewT’, the options presented only include NUCAPS, not also modified NUCAPS. So, by my understanding, when displaying modified NUCAPS, the popup SkewT will reference the original.

This second image, perhaps, further illustrates the issue. When displaying only the modified NUCAPS on the map and selecting the profile of interest (in the FSD CWA), the sounding with the interestingly-generated inversion (I believe the subject of another blog post) displays in NsharpEditor. However, the popup SkewT profile does not, because it seems to be showing the original NUCAPS profile.

– Guillermo

Tags: None