

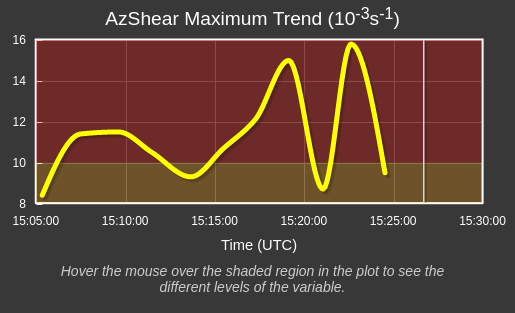
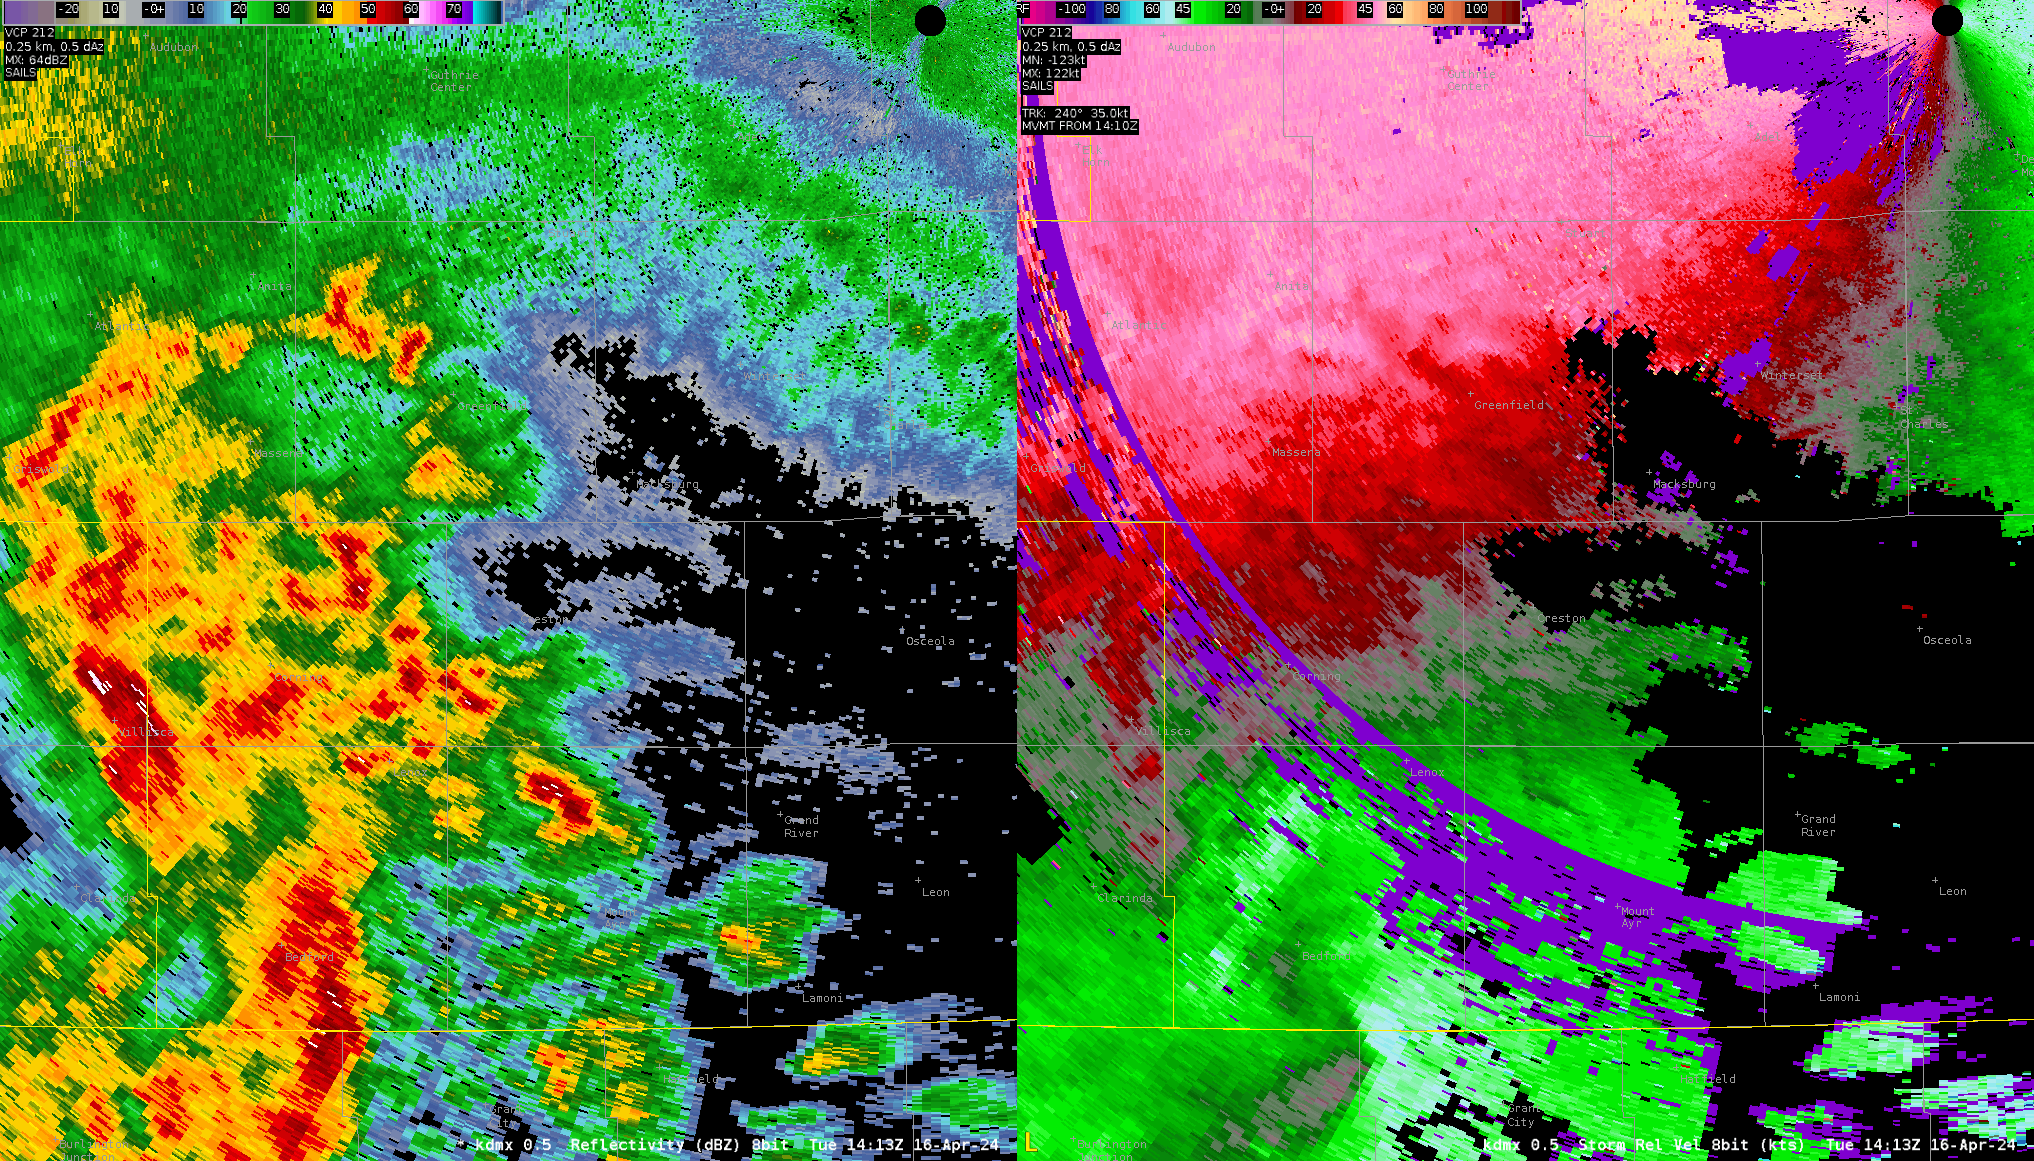
With a storm in close proximity (~20 miles) to the KEAX radar, AzShear had some rather large jumps in maximum values. The data was pretty noisy due to the proximity to the radar, so the rapid change in AzShear makes sense in this case.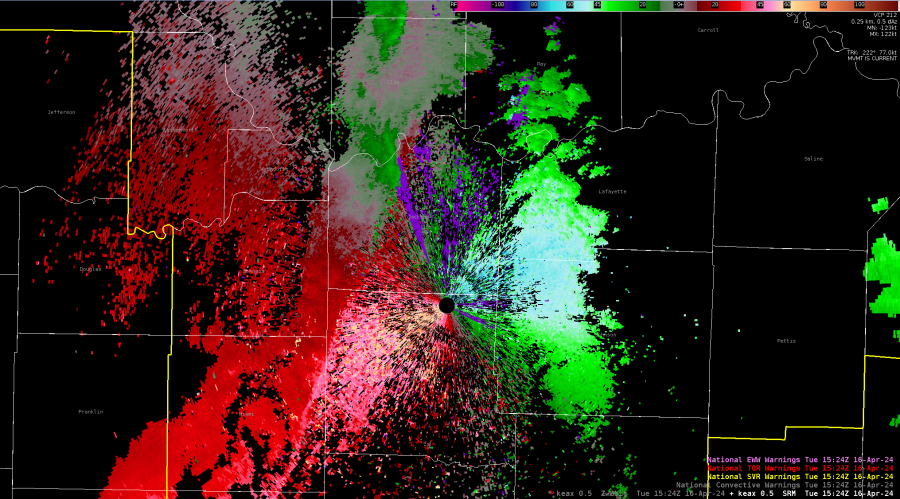
After looking at the base velocity data, it looks like to drop off of the max AzShear had to do with range folding or bad radar data close to the radar. When the range folding affected the couplet pasing to the NNW of the radar, AzShear dramatically dropped off in response.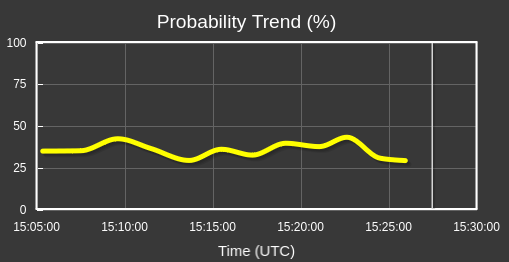
TORP also displayed various jumps as well in response to the variance in AzShear, but was way more tamed than the AzShear. This is good to see that there is not as much variability in TORP even with the jumps in AzShear as AzShear is the top parameter TORP relies on. This could be confusing if TORP jumps back and forth from 20% and 60% (just throwing out numbers), so it is good to see it’s more smooth than the jumps in AzShear.
-Stormy Surge
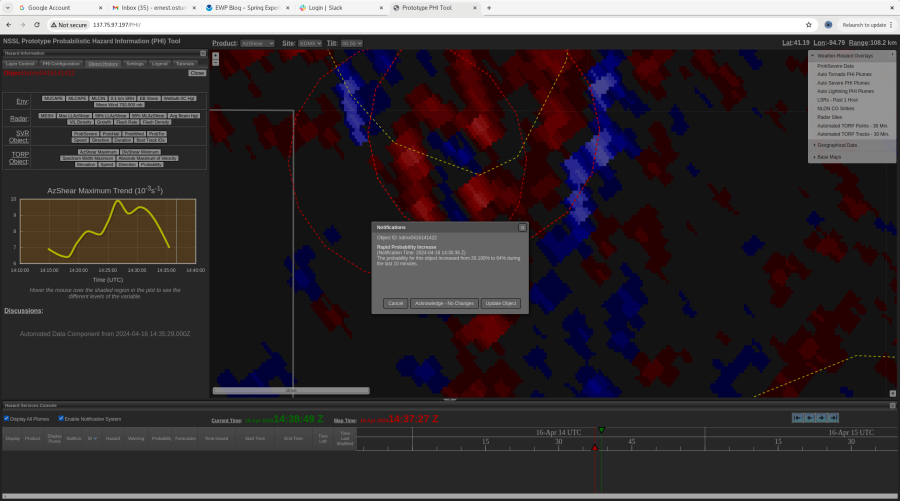
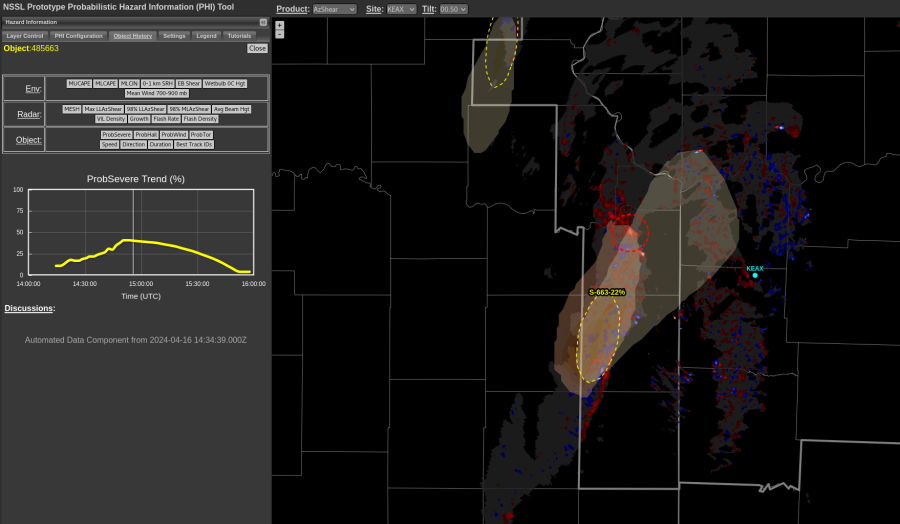 Initially, prob severe detected a small area for it’s algorithm and it tagged it with low severe probabilities. As the storm progressed, prob severe picked up a larger area for the object, and when it did that, the probabilities increased.
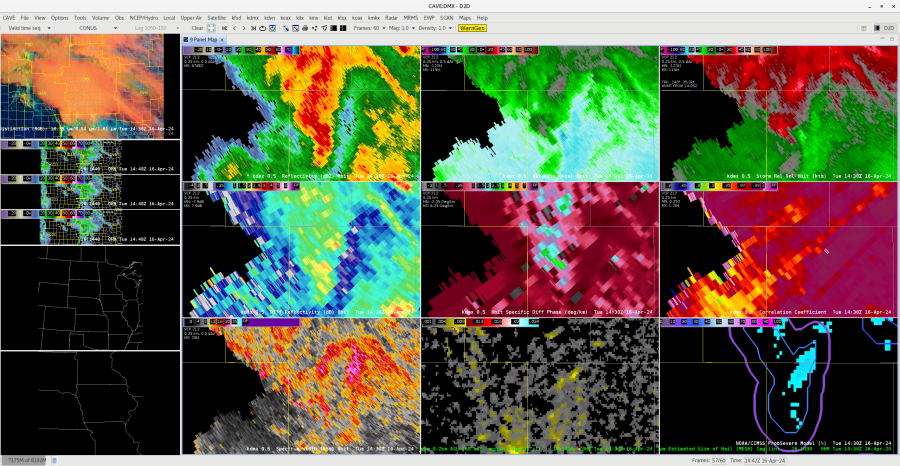
  This could indicate that the storm is gaining strength, but radar presentation has remained almost steady state. This could be a detection issue as when it picks up a larger area, the probabilities increase due to size.
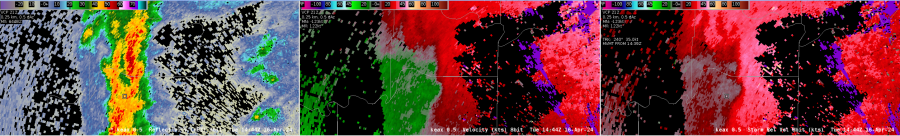
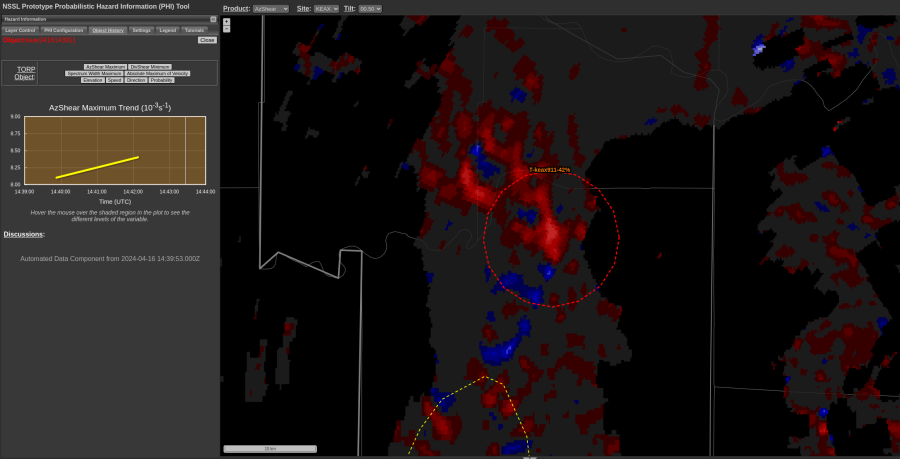
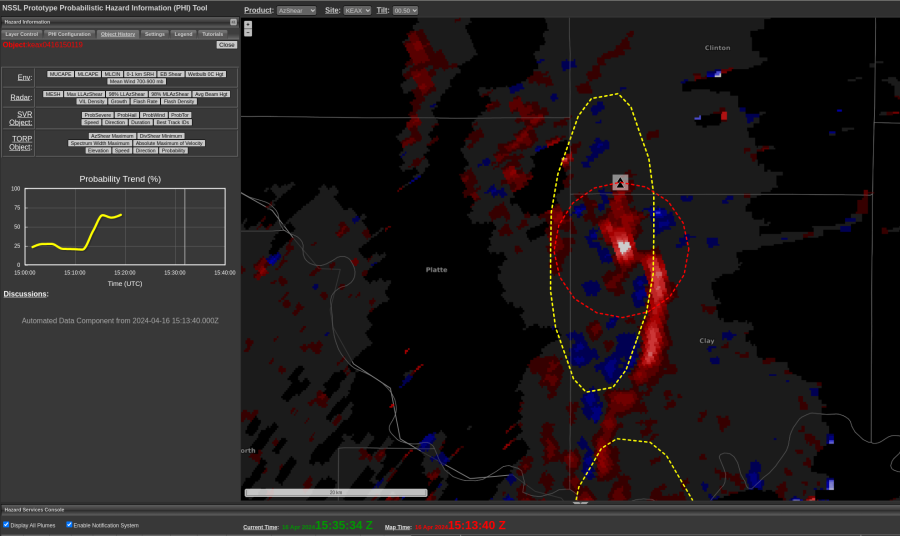
 I still don’t know if this will turn into anything, but AZ shear signal that is being picked up along with the trend is concerning. This storm is just starting to show some inbound velocity and this may be a very early warning signal. Definitely worth watching at this point.
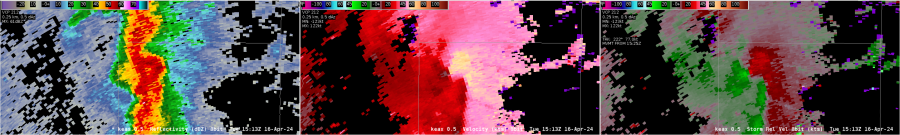
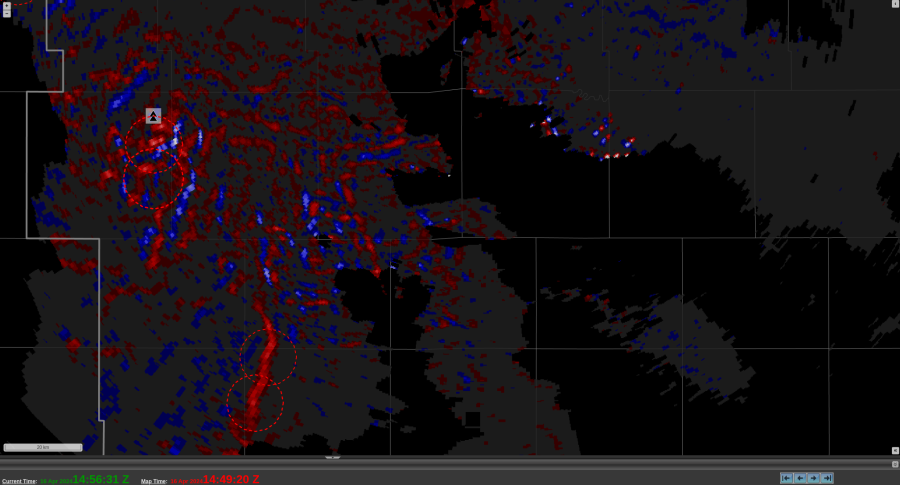
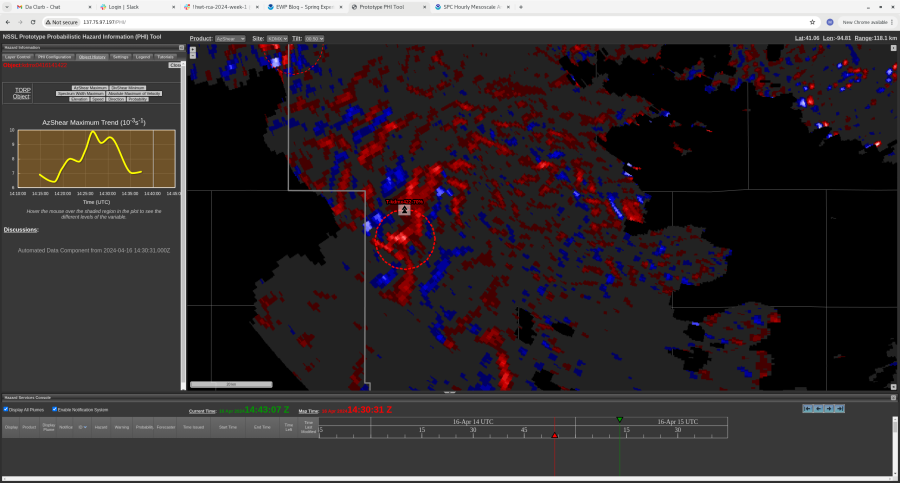
 Quick example of a very small false signal (low prob around 30%) that appears in AZ shear data. That said, I think this is good. It forced a quick look at V/SRM data to see if it was real, and it could be quickly eliminated – and it quickly disappeared from AZshear in the next couple of minutes. Showed up on multiple radars – also good. I also think setting filter lower to say 15% would be better. Having the extra circles there is not problamatic and does not prevent you from seeing the data behind it.
