Forecaster Thoughts – Pete Wolf (2009 Week 5)

Sincerely appreciate the opportunity to attend HWT EWP the week of June 1st… definitely a worthwhile experience.  Viewed phased-array radar (PAR), lightning mapping array (LMA), the CASA radar concept, and multi-radar/multi-sensor (MRMS) algorithms, and was given a peek at the PHI probabilistic warning program. Here is a summary of input provided (by myself and other participants) on each of these technologies based on EWP efforts that week…

LMA:
1) Viewed several real-time cases. Found this data potentially useful in the warning program in areas where radar data are sparse (e.g. western U.S.). Had a lower-resolution GLM version, similar to planned output from GOES-R, to review…and appeared sufficient in these areas despite lower resolution.
2) Interesting observation…some cells produced cg strikes first, others produced inter-cloud before cg, while others produced inter-cloud with no cg at all. Is there something about these different lightning patterns that can tell us something about storm structure or environment? Perhaps a future research topic.
3) When it comes to overall warning decision-making, LMA does not indicate anything that radar reflectivity structure doesn’t show. In fact, there is often a short lag between reflectivity trends and subsequent lightning trends.
4) Noted some problems with data beyond 100km from center of LMA sensor network…data seemed better closer to the center of network. In some instances, had cells producing impressive 1-minute cg strike rates on NLDN data (nearly continuous cg), while the LMA showed very little, despite apparently being located within range.
5) We had 5-minute averaged LMA data in AWIPS at the HWT…lower resolution of this data proved to be less useful than the high-resolution real-time data available online. For LMA data to be useful, the data in AWIPS will need to be the highest-resolution possible.

PAR:
1) Viewed data from < 1 minute volume scans for an impressive inland tropical storm event in OK.
2) Very helpful in assessing mini-supercells and tropical-cyclone tornado features. Velocity enhancement signatures (VES’s) stood out well, and in one instance, could watch strong low-level convergence evolve into rotation, allowing a possible warning with decent lead time before the TVS.  In dealing with problem issues such as mini-supercells and TC tornadoes, PAR shows promise!
3) The resolution of the data was similar to current 88D super-res. The faster volume scans provided considerably more data to look at. This offers both a positive and a negative in the warning process. Positive: easier to monitor evolutions and view small scale features, with potential for a few extra minutes of warning lead time.  Negative: Easier to “wait one more scan” knowing it was less than a minute away, compared to the longer 88D volume scans…which could minimize the potential increase in lead time.
4) Viewing rapid changes to small scale features requires research into understanding what we’re looking at. At times, I was fascinated at what I was seeing, but had no idea what exactly was occurring, and what it meant with regard to severe weather potential (e.g. was it increasing or decreasing). This also led to a feeling of “wait one more scan” to try to understand what was going on.

CASA:
1) Viewed a few different cases. Viewed data at scan rates of 1 minute or less.
2) Key benefit is greater coverage of low-level radar data, with more frequent data updates. Certainly beneficial when it comes to tornado threat detection.
3) Same positive and negative as for PAR above (#3).
4) Not a stand-alone warning tool…needs to be augmented with 88D data. CASA best as a tool that provides enhanced low-level radar coverage when it is needed (e.g. tornado or downburst potential). CASA radars have significant attenuation problems, this was seen in cases viewed. Less of a problem if used in conjunction with (rather than in place of) available 88D radar data.

MRMS:
1) Viewed several real-time cases covering the western, central, and eastern U.S.
2) Numerous algorithm fields available, with considerable redundancy (most focused on hail, tornado/meso, not much for wind threat).
3) Viewed situations when MRMS is very useful, such as for storms moving within the “cone of silence” of one radar, and for prioritizing numerous storms on display. At other times (e.g. few storms on radar), does not provide anything more than other displays (e.g. VIL).
4) Found Maximum Estimated Hail Size (MESH) quite useful in the real-time events. The MESH utilized was an improved version over what’s available now in the field.
5) Several reflectivity layer products (e.g. reflectivity depth above -10C, 50dBZ echo top, etc) that were also potentially useful in warning process.
6) MESH tracks and MESO tracks useful, particularly in post-event verification efforts.
7) Was interested in the time-height series of 18dBZ, 30dBZ, and 50dBZ echo tops overlaid on one display. Can storm intensity changes with time be related to periods when these lines press closer together with time, vs. times when the lines spread further apart?

PHI:
1) Came in early one day to get a peek at the probabilistic warning program, in which the warning areas move with the threat (rather than being fixed areas). This requires a change in philosophy, which can be challenging in the NWS.
2) Was impressed at the program…could graphically illustrate complex situations (merging cells, splitting cells, etc) much easier than trying to explain the threat areas in lengthy text products. In addition, by “advecting” the threat area, one can always provide maximum lead time downstream of the warned storm (rather than waiting for storm to approach end of polygon before issuing new polygon warning).
3) Did not view program as terribly complex, nor one that would involve considerable forecaster workload.  In fact, if text product generation and dissemination can be mostly automated (since most products are worded similarly), workload could actually decrease, particularly in major events, allowing more time for data analysis (important if the above technologies are provided in operations).

Also gave a presentation on my Probabilistic-Augmented Warning System (PAWS) concept, suggesting it as a “middle-step” toward what is proposed with the PHI program. While viewed positively, the general viewpoint was to focus effort on PHI. There was no estimate as to when the PHI concept might become an operational entity for the NWS, though I would guess a 5-10 year range if not later (much later if introduced with Warn on Forecast concept in which it is linked to high-res numerical model output).

Key Concluding Thoughts:
1) EWP attendance very beneficial…and would encourage others to get involved.  While there, I expressed the fact that the SOO community could provide a resource for additional evaluation, even if not located in Norman.
2) The technology evaluated was impressive, and offers much…not only in the area of operations, but also research, especially when viewing high-resolution output in rapid scan updates. Despite this, getting the money for operational implementation could be a tough sell, especially if “selling” requires a demonstration of verification score impact. Despite a favorable view of the technology in operations and research, I did not sense that it would positively impact verification scores that much. For example, < 1 minute radar scans offer the potential of adding a few extra minutes lead time to warning. However, this also makes it easier to wait another scan, since only 1 minute away (rather than 5 minutes), which would diminish this potential gain. Also watched SHAVE verification efforts during some events worked…amazing to see the difference in their report coverage vs. that of the WFO…a demonstration of the inaccuracy of our verification scores (our future funding is based on inaccurate numbers?).
3) Implementation of these technologies at the WFO will result in data overload, which gets even worse if you add high-res model output that could utilize these datasets. Of course, more data isn’t always better data. The forecaster will need to learn how to process the data (better prioritizing), and know when to stop looking at data and make the warning decision. Further automation (through algorithms) will be necessary to help forecasters process the data load. (This makes concepts such as PAWS and PHI very important, by placing forecaster focus on data analysis and not on product design.)  In other words…SOO job security! 😉 Dual-pol will be a good start in this regard, as it will add products to the warning decision-process.  Training needs to be developed, perhaps with the WES machine, that allows the SOO to evaluate the impact of adding more and more data (e.g. more products, faster update times, etc.) to forecaster warning decision-making.  At the conclusion of the EWP, I suggested the need for continued leadership from the WDTB in this regard.

Again, I thought this was a beneficial experience, and appreciate the opportunity to participate.  Thanks….

Pete Wolf (NWS Jacksonville FL – 2009 Week 5 Evaluator)
Tags: None

Forecaster thoughts – Bill Martin (2009 Week 5)

Attending the EWP was an excellent experience, and I appreciate all the time and effort that people put into it.  The EWP kept the attendees very busy with a series of relatively intense exercises.  One’s skill at issuing warnings is much enhanced by issuing so many warnings in such a short period of time.  I wish my forecasters had the opportunity to go through these exercises as well.  In fact, one of the things I carried away from the EWP was the power of hands-on training of this kind.  We try to use WES cases in the field for training purposes to get something like this effect, but the experience in Norman is superior to what we can do with the WES.

Both the CASA radars and the PAR were found to be valuable for their rapid update capabilities.  We were able to get routine 1-minute volume scans from both.  In several instances, warnings were issued several minutes earlier than possible with 88D radars.  Also, from some cases, the high-resolution of the CASA radars helped identify severe features that might have gone unnoticed in 88D data.  If anything like a national network of CASA radars is ever developed, we will need to decide if we want to warn for every little vortex these radars are able to detect.  CASA radars do suffer from beam attenuation problems, though.  The original concept was for CASA to use phased-array antennas, but this has not been achieved as yet.  Also, the evaluation of a larger CASA array is probably needed and, I’m told, is planned.

On the CASA radars, there is a sense in the field that CASA radars are primarily valuable as potential gap-filling radars.  However, this is not the original intent of the CASA program, and, in fact, gap filling radars have been available for decades from a number of vendors.  The ground-breaking collaborative properties of a CASA network are not widely appreciated.  Still, gap-filling radars are much needed in the west, probably more so than collaborative or phased array radars.  If new money is available for more radars, solving the gap problem may be more of a priority than an innovative new technology.

The LMA I found to be pretty interesting.  The thousands of VHF sources detected from lightning channels are mapped into a vertically integrated lightning density product.  When color-contoured, this product looks similar to a radar composite reflectivity map, with comparable resolution.  Any electrically active storm can be imaged.  It was also possible to look at the 3D images of the lightning channels for storms, but this was just too much information.  LMA also provides 1-minute updates.  What is still being learned is how to associate the severity of a storm with its lightning density history.   With some experience, we were able to expedite warnings on storms based on a lightning pulse.  The ability to image storms from lightning, I found to be a fascinating concept, and I found the LMA to be a valuable companion to radar when deciding whether to issue a warning.  As I work in a CWA with large radar gaps, having LMA data would be particularly valuable.  Even with good radar coverage, the detailed LMA data helps to fill-in the picture we get from radar, and at a small cost.  The cost of a nationwide LMA capability would seem to be a small fraction that of a radar network, making the LMA attractive from a cost-benefit stand point.

The MRMS algorithms are run off of existing operational data sources.  For one real-time case we warned for, the storm went right over the top of the radar, so the multi-radar approach was shown to be valuable in this case.  One of the new MRMS algorithms is for hail size.  We found this to be pretty good, and tended to agree well with reports.  It was at least as good as the “VIL of the day” concept.  The “rotation track” product was also useful.  As MRMS is derived from available data, some of the products duplicate what might be easier to see another way.  Storm heights, for example, might be better found by consulting a cross-section in FSI

We considered the problem of information overload in integrating new data sources into operations.  For any of these technologies to succeed, they need to make it easier for a forecaster to issue a product.  Having to evaluate a flood of new data every minute may be paralyzing to some.  Even though dense new data sources have more information for producing more precise warnings, they need to be integrated in some user-friendly way into operations.  This leads to a need for better algorithms for analyzing some of these data streams in the background.

There are no set plans that I am aware of currently to expand CASA, PAR, LMA, or MRMS nationally.  Of these, MRMS would be the easiest to implement as it only requires the fielding of algorithms.  The LMA may also be cost-effective.  CASA and PAR are both expensive technologies, each one at least as expensive as the current 88D network.

Bill Martin (NWS Glasgow MT – 2009 Week 5 Evaluator)

Tags: None

Week 5 Summary: 1 – 5 June 2009

On Friday morning, the group got together to discuss June 4 activities and overall thoughts from their week in the HWT.

  • want to transition from RPG-only algorithms to including NSE data into any radar algorithms
  • If looking at 1 min radar scans…hard to keep tabs on changes in 0-1 km wind shear for example, or any other NSE parameter for that matter.  Would like to see an envionmental algorithm paired or integrated into radar algorithms
  • The NSE data needs to be reliable and accurate, otherwise it would be detrimental

PUB/BOU/CYS IOP:

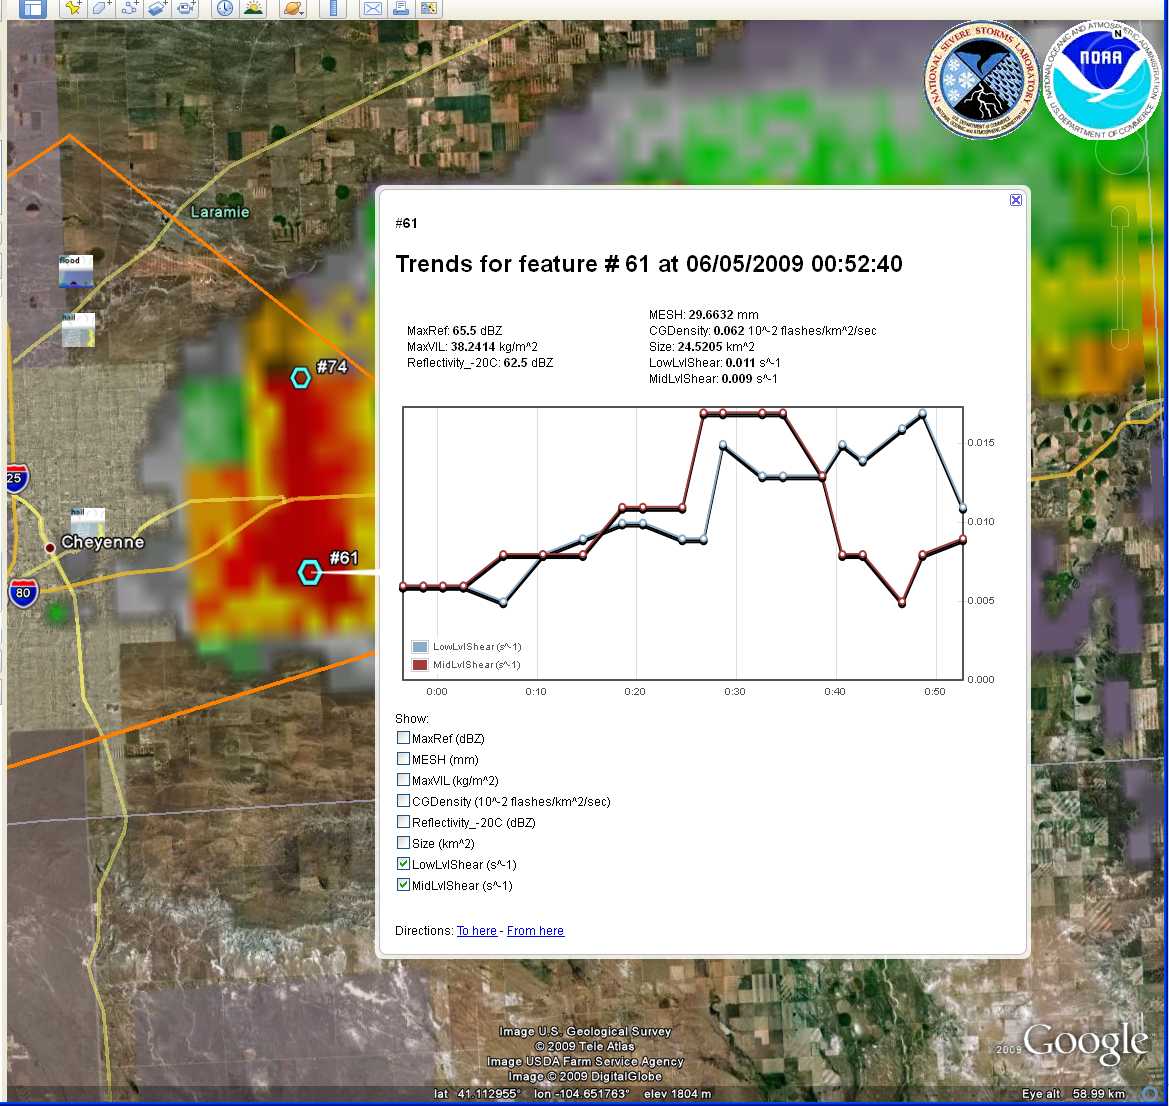
  • Near end of IOP a storm moved right over the KCYS radar, MESH did it’s job using multiple radars to fill in the cone of silence.  However, MESH seemed to be overestimating compared to the reports that SHAVE were getting (1.00 inch vs. 1.7-1.9 inches)
  • MESH tracks showed where storm had been going and was consistent, allowing the warning polygon to be oriented the right way

MR/MS Discussion

  • MR/MS doesn’t account for refraction properties yet, though a QC check does eliminate much of the AP
  • Mid-level rotation tracks were useful to help find a consistent track of the rotational signatures.  They also help confirm you have a supercell when the tracks are consistent
  • Like examining the trends in -20C reflectivity
  • Lots of the gridded products are redundant, containing the same type of information.  Have to be careful not to get tunnel vision when using all these gridded products. Redundancy also helps you transistion from products you are use to using to the new products and grow expertise and confidence.
  • Be comfortable with the gridded products in order to properly integrate them into the warning decision process
  • Plan view plot of scan-to-scan change would be useful…like change in MESH from scan-to-scan.  They all thought that trends were every bit as important as the max values reported.
  • Google map displays:  really want those in their local offices

LMA

  • impressive, never used the data before but very useful in areas were radar data may be lacking
  • need research to see if LMA data vs. cloud to ground data in the early stages of storm formation means anything
  • LMA is an average, then AWIPS smooths it further, thus losing information
  • They like the high res appearence, how it is similar to radar reflectivity.
  • Using it to help forecast when a storm first becomes severe, at the very least use it to get some led time on rapid intensification
  • #1 killer in FL is lightning…Pete hopes that there is a focus on provided an improvment on service for lightning threat

CASA

  • Need low-level altitude resolution that CASA provides.  This is crucial information the 88D can’t always provide.  This is a “big positive”
  • A consideration with CASA is that it provides rapid scan updates that could give a few extra minutes of lead time, but won’t be more than a few minutes.  Selling point will not be verification scores but the one devastating tornado you catch that formed well below the 88D’s lowest scan
  • Will see lots of signatures on CASA that haven’t been seen before and don’t currently know how to interpret.  Will be steep learning curve for these new/different signatures
  • Used reflectivity quite a bit to infer presence of a tornado becuase with the high resolution in time and space they were able to see the “do-nut” signature common with tornadoes
  • Will see a lot more low-level rotational signatures, do you warn on every little 30 sec dust whirl that shows up on CASA that you would never see with the 88D?  Obviously if each one is an actual tornado then yes, but gray area if they are very short lived and weak.  Could see a lot more warnings come out.
  • 1 min data might be more tempting to hold off on a warning, waiting one more scan, then waiting one more scan.  Can ride the fence on warn/don’t warn a little longer.  Not sure if this might be a real impact, will need to do some research on this, maybe on the WES.
  • Big learning curve and training will be needed to grow accustomed to 1 min updates

PAR

  • Provided more rapid updates but didn’t have any other advantages, since resolution is about the same if not worse at the edges of the scan sector, and also the same elevation angles.
  • Pete will take PAR data capabilities back to JAX with lots of excitement because it helps with the low-topped, weak signature supercells in tropical environments.  PAR allows for detection and tracking of rapidly evolving weakconvergent and rotational signatures.  PAR should also help with pulse-type storms because of rapid evolution, getting early detection of cores aloft that the 88D might miss.

Liz Quoetone and Paul Schlatter (EWP Weekly Coordinators, 1-5 June 2009)

Tags: None

Summary – 4 June 2009

Ended operations for today  for us and V2 crew with storms weakening and moving out of WY. (Note: During debrief below, storm reintensified and produced the biggest hail of the evening – such was the night). Also exhausted the PAR archive list as well as a couple more CASA events.

Some general thoughts for discussion tomorrow on today’s events:

  • Good cone of silence case for MR/MS
  • Beneficial to compare base data with MR/MS output to get a sense of the values
  • MESH did very well with hail size estimates
  • Trends very useful
  • Google map display very useful
  • Lots of new products to check out in addition to looking at base data

Will touch on these and more points tomorrow.

Liz Quoetone and Paul Schlatter (EWP Weekly Coordinators, 1-5 June 2009)

Tags: None

Live Blog – 4 June 2009 (7:05 pm)

Both groups have gone SVR for Quarter size hail on storm near Cheyenne. Coincidentally, both teams came up with storm motion of SE at 21mph. Pete/Geoff team looking at rotation attm.

Liz Quoetone and Paul Schlatter (EWP Weekly Coordinators, 1-5 June 2009)

Tags: None