LJA: data collection update

SHAVE is currently on break for the first week of classes, activity should restart next week 27 Aug as needed.

Continuous data collection is still ongoing.  A brief outage of the WTLMA prohibited data from coming into NSSL realtime, but that has been restarted as of 0600 UTC on 21 Aug 2012.

Storm activity this week has been marginally severe at best, with most of the networks having no activity.

21 Aug 2012:  FL-LDAR domain, 1800-2200 UTC

20 Aug 2012: WTLMA (did not receive data from this network in realtime, but event could be reprocessed if necessary.  May have been outside of network 3d range)

17 Aug 2012:  NALMA (likely out-of-range of severe activity)

Tags: None

Lightning Jump Field Test: Data Collection Update

Data collection is still ongoing with back-ups moved to tape daily.  (If anyone is interested in analyzing a particular day just let me know!)

Here is a summary of activity in the LMA domains since the last update:

10 July 2012:  NALMA, [SHAVE available] 1700-2330 UTC; OKLMA 2200 UTC {SHAVE null case}

12 July 2012:  COLMA (DC3 domain) [SHAVE available] 2000-2300 UTC;  FL-LDAR [SHAVE available] 1800-2000 UTC

14 July 2012: OKLMA (range questionable) 2100-0130 UTC

15 July 2012:  DCLMA (range questionable) 1900-0000 UTC

16 July 2012: NALMA [SHAVE available] 2100-0000 UTC; WTLMA [SHAVE available, 1 storm, null case] 2230 UTC

17 July 2012: NALMA [SHAVE available, 3 storms] 1900-2300 UTC; COLMA [SHAVE available, 1 storm, null case] 2100 UTC

18 July 2012: DCLMA [SHAVE available, 6 storms] 1600-0000 UTC; NALMA [SHAVE available, 3 storms, null & non-svr] 1800-0100 UTC, FL-LDAR 2230-2330 UTC

19 July 2012: NALMA [SHAVE available, 1 storm, full swath] 2230-0130 UTC; DCLMA [SHAVE available, 3 storms, null & non-svr] 2100-0000 UTC

20 July 2012:  NALMA [SHAVE available, 1 storm, null case] 2200-2300; OKLMA [SHAVE available, 1 storm, null case] 2030-2130

22 July 2012: FL-LDAR 1800-2000 UTC

23 July 2012:  DCLMA [SHAVE available, 4 storms] 1900-2100 UTC

24 July 2012:  DCLMA [SHAVE available, 6 storms] 1500-2200 UTC

25 July 2012:  COLMA [SHAVE available, 2 storms, non-svr] 1900-0000 UTC

26 July 2012:  DCLMA [SHAVE available, 4 storms] 2200-0230 UTC; OKLMA [SHAVE available, 2 storms, non-svr] 2030-2300 UTC

27 July 2012:  NALMA [SHAVE available, 4 storms] 2000-2300 UTC

28 July 2012: DCLMA [SHAVE available, 5 storms] 2000-0100 UTC

29 July 2012: COLMA (questionable range) ~2300 UTC

30 July 2012: COLMA [SHAVE available, 2 storms] 2200-0100 UTC; NALMA 0400-0800 UTC (31 July); FL-LDAR [SHAVE available, 1 storm, null case] 2125 UTC

31 July 2012:  DCLMA 1600-2200 UTC; NALMA 1630-1730 UTC

1 Aug 2012:  DCLMA [SHAVE available, 4 storms] 1800-0100 UTC; NALMA [SHAVE available, 3 storms] 2100-0100 UTC

[SHAVE data collection currently unknown for August, to be updated later]

2 Aug 2012: NALMA 1900-2100 UTC; COLMA 0000-0100 UTC

3 Aug 2012: DCLMA 1900-2200 UTC

5 Aug 2012: DCLMA 1700-2300 UTC

7 Aug 2012: OKLMA 2000-0100 UTC, DCLMA 2130-2230 UTC

8 Aug 2012: FL-LDAR 2130-2230 UTC; OKLMA (range questionable) 2130-0030 UTC

9 Aug 2012:  DCLMA 1700-0000 UTC; NALMA 1600-1730 UTC

10 Aug 2012:  DCLMA 2130-0100 UTC; NALMA 2000-2300 UTC

13 Aug 2012: NALMA 1630-1800 UTC

14 Aug 2012: DCLMA 1900-0300 UTC

15 Aug 2012: DCLMA 2000-2200 UTC

Tags: None

Lightning Jump Field Test: Status/SHAVE data update

SHAVE students are currently working to compile the data for each particular day, but here is the summary of SHAVE data collected in each network (using a range of roughly ~200km from center) so far for the experiment:

CO: 195 (0 wind-related reports)
DC: 1971 (413 wind-related reports)
AL: 881 (130 wind-related reports)
FL: 432 (10 wind-related reports)
OK: 1951 (402 wind-related reports)
SWOK: 20 (1 wind-related report)
WTX: 162 (0 wind-related reports)
note: OK/SWOK and WTX/SWOK could have overlapping reports.

The range was expanded for SHAVE data collection so the status of storms entering / leaving the official network area (e.g., “lightning jump range”) could be known.

—————

Summary of data collection June 2012- current:

1-2 June 2012: DCLMA, 1800-0000 UTC; WTLMA/OKLMA, 2300-0200 UTC

2-3 June 2012: COLMA, 2000-2300 UTC;  OKLMA/WTLMA, 2300-0800 UTC

3-4 June 2012: NALMA, 0300-0600 UTC; OKLMA/WTLMA, 0100-0400 UTC; DCLMA 2300-0100 UTC

4-5 June 2012: WTLMA/OKLMA, 2100-0300 UTC

6 June 2012: COLMA, 2300-0300 UTC (questionable range); WTLMA, 1300-0000 UTC

7-8 June 2012: COLMA, 2200-0500 UTC

10-11 June 2012: FL-LDAR, 0000-0100 UTC

11-12 June 2012: NALMA, 2200-0100 UTC; OKLMA 0200-0600 UTC (questionable range)

12-13 June 2012: WTLMA, 0100-0800 UTC

14-15 June 2012: WTLMA, 2300-0400 UTC;

15-16 June 2012: WTLMA, 0200-0800 UTC;  COLMA, 1900-0200 UTC

16-17 June 2012: WTLMA/OKLMA, 2100-0400 UTC (late might be at questionable range)

22-23 June 2012: DCLMA, 1900-0100 UTC; COLMA, 0100-0300 UTC

24-25 June 2012: FL-LDAR, 0000-0400; DCLMA, 1900-2000 & 0300-0500 UTC

25 June 2012: DCLMA, 1600-1800 UTC

27 June 2012: COLMA, 2100-2300 UTC

28-29 June 2012: DCLMA, 2300-0900 UTC

29-30 June 2012: DCLMA, 2300-0400 UTC

30 June 2012: DCLMA, 2200-0100 UTC

1-2 July 2012: NALMA, 1900-0200 UTC

2 July 2012: NALMA, 2200-0000UTC, possibly out of range, over OHX forecast office.

3 July 2012: DCLMA, 2200-0100 UTC

4-5 July 2012: DCLMA, 2000-0800 UTC,

5-6 July 2012: NALMA 2000-0500 UTC,  DCLMA 2200-0000 UTC

6 July 2012: NALMA, 1800-2000 UTC, SHAVE data collected

8-9 July 2012:  DCLMA, 1800-0500 UTC

Tags: None

Forecaster Thoughts: Cloud Top Cooling Products for Aviation

From an email conversation:

Kristen Schuler (CWSU, Kansas City, MO) writes:

“So right now the cloud top cooling and sat cast products are a great way to predict severe storms /areas of severe hail potential. It would be nice to have a product that forecasts echo tops exceeding FL400…something that poses a significant impact to aviation. Is that possible? What are your thoughts?”

Wayne Feltz (UW-CIMSS, Madison, WI) replies:

“Yes, we received this same feedback from another CWSU forecaster out of Houston.  I have attached a paper (currently in review with major revisions so it should be published soon) where this relationship has already been established for 18, 30, and 50 dBZ echo top heights.  I think we can do more to provide better correlation between expect echo top height and CTCR.  We also want to compare CTCR and cloud top growth (feet or meters per 15 minutes) to see how this relationship fares.

“The relationship in paper is within figure 7.  We plan on making a separate CTC training module but with a focus on aviation meteorologist decision support issues rather than severe thunderstorm warning focus.”

Greg Stumpf, EWP2012 Operations Coordinator

Tags: None

The EWP2012 Thank You Post

Here is our Thank You post for EWP2012, expressing our gratitude to the hard work and long hours put in by our forecasters, developers, and other participants for our spring experiment.  Even though we had a quiet severe weather season this year, we found storms on pretty much all the operational days in the five weeks we operated.  This was the first year we used AWIPS2, and it was a great success and mostly-well received by our participants and staff.

The biggest expression of thanks goes to our new full-time AWIPS2 support person Darrel Kingfield(CIMMS/NSSL), who put in many extra hours to pull off the transition to the new software.  AWIPS2 performed very well, both due to Darrel’s efforts, and the fact that it is a better software package than AWIPS1.

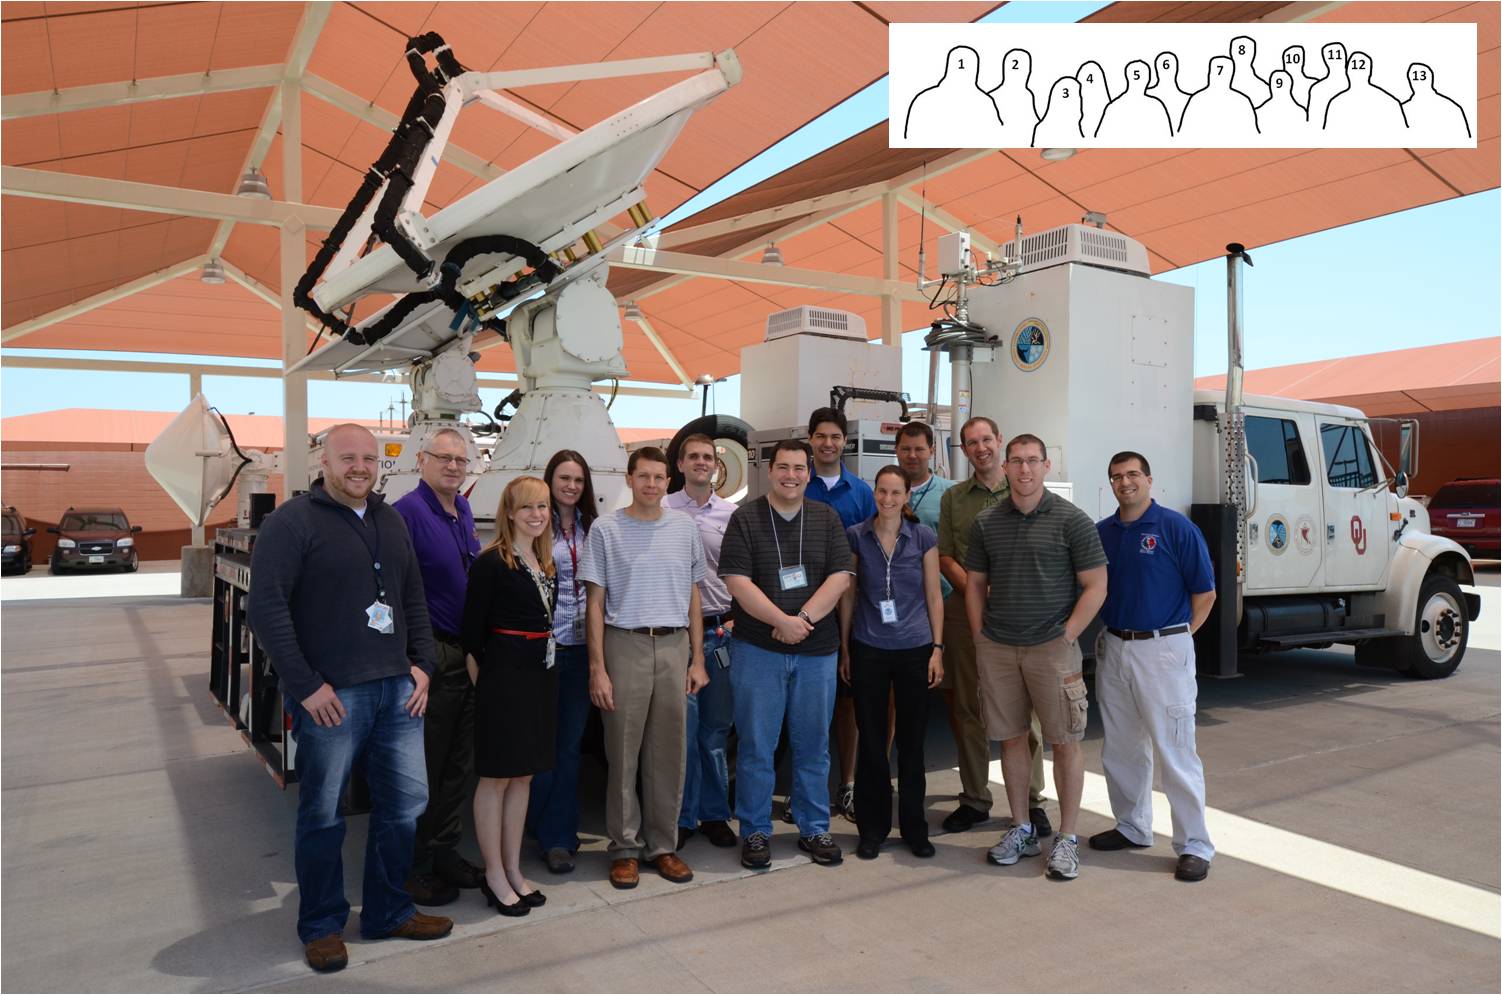
These scientists brought their expertise to the experiment and were available to observe live operations and provide support to our visitors:

For the Warn-On-Forecast 3D Radar Data Assimilation project we’d like to thank the principle scientists, Travis Smith (CIMMS/NSSL), Kristin Calhoun (CIMMS/NSSL), and Jidong Gao (NSSL).

For the OUN WRF project, they included principle investigators Gabe Garfield (CIMMS/NWS WFO OUN) and David Andra (NWS WFO OUN).

For the GOES-R Proving Ground experimental warning activities, including the Pseudo-Geostationary Lightning Mapping (pglm) array experiment, our thanks go to principle scientists Chris Siewert (CIMMS/SPC) and Kristin Calhoun (CIMMS/NSSL), along with John Walker (UAH), Chris Jewett (UAH), Lori Schultz (UAH), Wayne Feltz (UW-CIMSS), Justin Sieglaff (UW-CIMSS), Lee Cronce (UW-CIMSS), Bob Aune (UW-CIMSS), Jordan Gerth (UW-CIMSS), Dan Lindsey (CSU-CIRA), Amanda Terborg (GOES-R AWC liaison, Kansas City, MO), and Chad Gravelle (GOES-R NWSTC liaison, Kansas City, MO).

We had undergraduate students helping out in some real-time support roles including monitor real-time severe weather reports.  They included Bethany Hardzinski, Madison Miller, Christopher Reidel, Craig Schwer, and Jennifer Tate (all CIMMS/NSSL).

Next, we’d like to thank out Weekly Coordinators for keeping operations on track: Greg Stumpf (CIMMS/NWS-MDL), Jim LaDue (NWS/WDTB), Kristin Calhoun (CIMMS/NSSL), Travis Smith (CIMMS/NSSL), and Gabe Garfield (CIMMS/NWS WFO OUN), as well as “guest” co-coordinator, Chris Karstens (Iowa State University).

We also want to thank our overall EWP2012 Operations Coordinator who handled the experiment logistics, Greg Stumpf (CIMMS/NWS-MDL).

The following individuals from NWS/WDTB were instrumental in facilitating the “Tales From the Testbed” Webinars:  Clark Payne, Robert Prentice, Mark Sessing, and  Steve Martinaitis. And thanks to Ed Mahoney for spearheading the idea.

We had IT help from Aaron Anderson (NWS/WFO Norman, OK), Jeff Brogden (CIMMS/NSSL), Karen Cooper (INDUS/NSSL), Vicki Farmer (INDUS/NSSL), Paul Griffin (NSSL), Darrel Kingfield (CIMMS/NSSL), Brad Sagowitz (NSSL), and Greg Stumpf (CIMMS/NWS-MDL).

Public Relations were handled by Susan Cobb (CIMMS/NSSL) and Keli Pirtle (NSSL).

The EWP leadership team of Travis Smith (CIMMS/NSSL) and David Andra (NWS/WFO Norman, OK), along with the other HWT management committee members (Steve Weiss (SPC), Jack Kain (NSSL), Mike Foster (NWS/WFO Norman, OK), Russ Schneider (SPC), and Steve Koch (NSSL), Stephan Smith (MDL Decision Assistance Branch), Steve Goodman (GOES-R program office), and Jeff Waldstreicher (NWS Eastern Region Headquarters and Decision Support Services Pilot Project) were all instrumental in providing the necessary resources to make the EWP spring experiment happen.

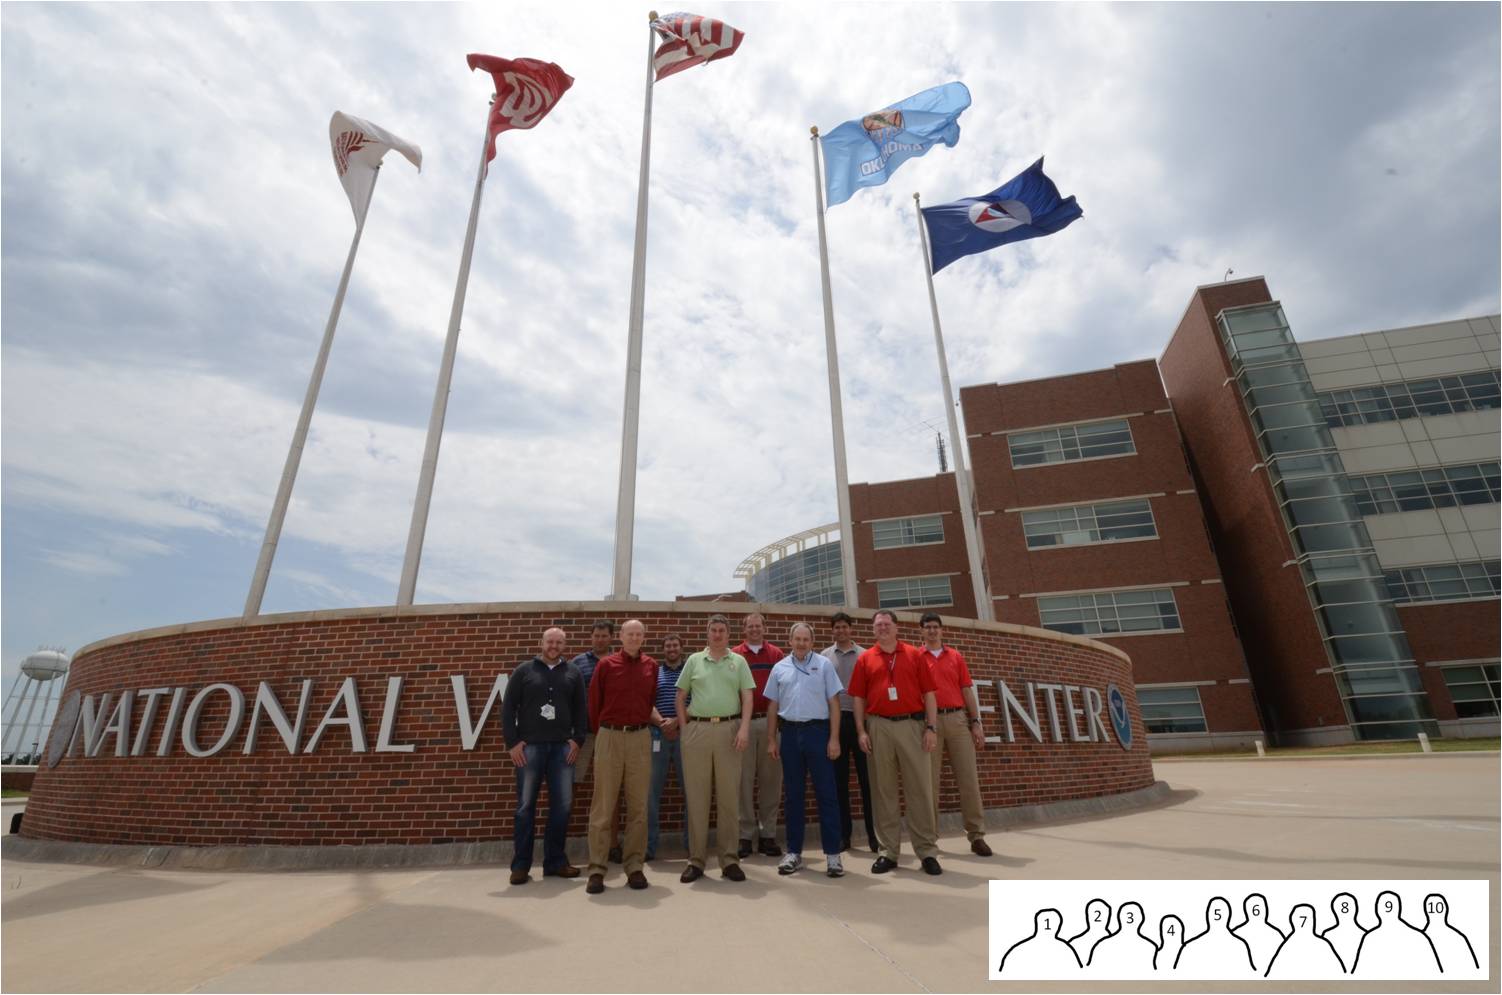
Finally, we express a multitude of gratitude to our National Weather Service and international operational meteorologists who traveled to Norman to participate as evaluators in this experiment (and we also thank their local and regional management for providing the personnel). They are:

Marc Austin (WFO, Norman, OK)

Ryan Barnes (WFO, Norman, OK)

Brian Carcione (WFO, Huntsville, AL)

Dave Carlsen (Environment Canada)

Todd Dankers (WFO, Denver, CO)

Michael Dutter (WFO, Marquette, MI)

Jeff Garmon (WFO, Mobile, AL)

Rich Grumm (WFO, State College, PA)

Matt Hirsch (WFO, Phoenix, AZ)

Jeffrey Hovis (WFO, Charleston, WV)

Ty Judd (WFO, Norman, OK)

Stephen Kearney (CWSU, Kansas City, MO)

Andy Kleinsasser (WFO, Wichita, KS)

Chris Leonardi (WFO, Charleston, WV)

James McCormick (AFWA, Offutt AFB, Omaha, NE)

Chris McKinney (WFO, Houston, TX)

Steve Nelson (WFO, Peachtree City, GA)

Roland Nuñez (CWSU, Houston, TX)

Jennifer Palucki (WFO, Albuquerque, NM)

Julia Ruthford (WFO, Charleston, WV)

Andrea Schoettmer (WFO, Louisville, KY)

Kristen Schuler (CWSU, Kansas City, MO)

Randy Skov (CWSU, Atlanta, GA)

Gary Skwira (WFO, Lubbock, TX)

Gordon Strassberg (CWSU, New York, NY)

Tim Tinsley (WFO, Brownsville, TX)

Helge Tuschy (Deutscher Wetterdienst, Germany)

Kathrin Wapler (Deutscher Wetterdienst, Germany)

Many thanks to everyone, including those we may have inadvertently left off this list. Please let us know if we missed anyone. We can certainly edit this post and include their names later.

The EWP2012 Team

Tags: None

EWP2012 Week 5 Summary: 11-15 June 2012

EWP2012 PROJECT OVERVIEW:

The National Oceanic and Atmospheric Administration (NOAA) Hazardous Weather Testbed (HWT) in Norman, Oklahoma, is a joint project of the National Weather Service (NWS) and the National Severe Storms Laboratory (NSSL).  The HWT provides a conceptual framework and a physical space to foster collaboration between research and operations to test and evaluate emerging technologies and science for NWS operations.  The Experimental Warning Program (EWP) at the HWT is hosting the 2012 Spring Program (EWP2012).  This is the fifth year for EWP activities in the testbed.  EWP2012 takes place across five weeks (Monday – Friday), from 7 May through 15 June.  There are no operations during Memorial Day week (28 May – 1 June).

EWP2012 is designed to test and evaluate new applications, techniques, and products to support Weather Forecast Office (WFO) severe convective weather warning operations.  There will be three primary projects geared toward WFO applications this spring, 1) evaluation of 3DVAR multi-radar real-time data assimilation fields being developed for the Warn-On-Forecast initiative, 2)  evaluation of multiple CONUS GOES-R convective applications, including pseudo-geostationary lightning mapper products when operations are expected within the Lightning Mapping Array domains (OK/west-TX, AL, DC, FL), and 3) evaluation of model performance and forecast utility of the OUN WRF when operations are expected in the Southern Plains.

WEEK 5 SUMMARY:

We had six visiting NWS forecasters this week: Tim Tinsley (WFO, Brownsville, TX), Michael Dutter (WFO, Marquette, MI), Ty Judd (WFO, Norman, OK), Steve Nelson (WFO, Peachtree City, GA), Randy Skov (CWSU, Atlanta, GA), and Jeff Garmon (WFO, Mobile, AL).  Once again, we were all over the map with our severe weather events.  But continuing the trend of a quiet spring, there were no large severe weather outbreaks.

Photo:  1)  Chris Siewert (CIMMS/SPC/GOES-R)c, 2)  Travis Smith (CIMMS/NSSL), 3)  Randy Skov (CWSU, Atlanta, GA), 4)  Ty Judd (WFO, Norman, OK), 5)  Steve Nelson (WFO, Peachtree City, GA), 6)  Michael Dutter (WFO, Marquette, MI), 7)   Tim Tinsley (WFO, Brownsville, TX), 8)  Gabe Garfield (CIMMS/WFO Norman, OK), 9) Jeff Garmon (WFO, Mobile, AL), and 10)  Jordan Gerth (UW-CIMSS). Photograph by Greg Stumpf (CIMMS/NWS-MDL).


REAL-TIME EVENT OVERVIEW:

11 June: Memphis (MEG), Huntsville (HUN), Tulsa (OK), San Angelo (SJT), Jackson (JAN), Birmingham (BMX)

12 June: Albuquerque (ABQ), Midland (MAF), Lubbock (LBB), Amarillo (AMA)

13 June: Albuquerque (ABQ), Midland (MAF), Sioux Falls (FSD), Fort Worth (FWD)

14 June: Minneapolis (MPX), Sioux Falls (FSD), Hastings (GID), Omaha (OAX), Amarillo (AMA)

FEEDBACK ON EXPERIMENTAL PRODUCTS:

3DVAR:

  • for ease of comparison, color tables should match other experimental products
  • storm top divergence was helpful to determine if storm would strengthen
  • four panel of divergence and updraft intensity is helpful
  • MESH seemed to peak 5-10 minutes after maximum in updraft intensity/divergence
  • suggest visualizing divergence/convergence/vorticity in an “all-tilts” format
  • use “AGL” instead of “MSL”
  • need a storm-based four-dimensional storm investigator for 3DVAR
  • integrate CAPPI

OUN WRF:

  • generally good forecast
  • cold pool event on Monday night was forecast well
  • forecasters will need to be trained how to use it: don’t want them to dismiss the model because of timing and placement issues.
  • model trends were helpful
  • on Wednesday, forecasters felt convection was going to happen; OUN WRF developed nothing, and verified
  • hourly column hail product worked well on at least two days
  • updraft helicity was a little noisy
  • did well on Thursday in the Dallas area
  • it would be helpful if the color tables matched the 3DVAR
  • suggest using high-resolution models to write aviation forecasts
  • model might also be useful for lake-effect snow events, to determine future position of important boundaries
  • suggest that more high-resolution models be set up; one for each region

GOES-R NearCast:

  • useful up to 3-6 hours into the future — then, not so good
  • on Thursday, showed unstable airmass northwest of Hastings after the front had clearly moved through
  • to its credit, kept instability in central area when OUN WRF had moved it to the south
  • theta-e difference product was considered to be the most accessible product
  • proposed a merger of GOES-East and GOES-West to cover gap in coverage
  • difficulty in using pressure changes owing to the changes in elevation from the Plains to the Rockies
  • NearCast CAPE closely agrees/associates well with the model CAPE
  • color scales for products could use contrast enhancement

GOES-R UAH SatCast/UW Cloud-Top Cooling:

  • SatCast useful product, but might be good to filter lower signal
  • some forecasters thought they would still appreciate seeing the low values in the CI product
  • products complement each other
  • products do not seem as useful over higher terrain
  • some issues with CI false alarm rate, even when signal approached 70%
  • CI false alarms decreased dramatically for signal greater than 80 or 90%
  • neverthless, CI helped focus attention on areas that needed to be watched
  • many detections in CI product can be overwhelming
  • a few times, a lead time of 50 minutes was observed from convective initiation to hail observation
  • categorical probabilities for CI is not preferred
  • would like to see trends for each CI probability maxima; perhaps, a trend graph
  • the timing of the full disk scan was frustrating; it occurs at the wrong time (during peak initiation time)
  • might be helpful to see verification climatology

GOES-R PGLM:

  • warned sooner on Monday in Huntsville, because of lightning jump

There are more GOES-R feedback details on the GOES-R HWT Blog Weekly Summary.

OVERALL COMMENTS:

  • orientation was much better/organized this year
  • pleased with the ability to change domains on the fly
  • WES case was good, but it took a while to install
  • another WES case might have been helpful
  • it might be helpful to have a 2-3 hour (shorter) displayed real-time WES case at the experiment
  • some difficulty setting up AWIPS procedures
  • suggest having a “mentor” guide visiting forecaster through training on Mondays

CONTRIBUTORS:

Gabe Garfield, EWP2012 Week #5 Weekly Coordinator

Tags: None

Daily Summary: 14 June 2012

Today, we started operations in the Minneapolis (MN), Sioux Falls (SD), and Hastings (NE) county warning areas.  An early morning mesoscale convective system persisted in the Minneapolis CWA, which limited destabilization.  Nevertheless, the Minneapolis forecasters (Ty Judd and Mike Dutter) issued several severe thunderstorm warnings, with half-dollar size hail the most significant report among those received.  These forecasters primarily evaluated the 3DVAR products.

The Sioux Falls forecasters (Steve Nelson and Tim Tinsley) saw no organized convection, which prompted a move to Omaha (NE).  There, they issued several severe thunderstorm warnings and one tornado warning.  Again, the forecasters primarily evaluated the 3DVAR products.

The Hastings forecasters (Jeff Garmon and Randy Skov) issued several severe thunderstorm warnings in their CWA for severe multicellular storms.  Hail up to the size of tennis balls was reported.  The Hastings forecasters were able to evaluate the OUN WRF, in addition to the 3DVAR products.

Finally, after the severe weather event in Minnesota transitioned to a heavy rain event, forecasters Ty Judd and Mike Dutter transferred to the Amarillo CWA.  They issued a few severe thunderstorm warnings; hail up to the size of quarters was reported.  They evaluated both the 3DVAR and OUN WRF experimental products.

-G. Garfield, Week 5 Coordinator

Tags: None

OAX: Nice depiction of wind event over southern Omaha

KOAX 88D and 3DVAR analysis clearly showed a damaging wind event across southern Omaha and Offutt AFB.  The images can speak for themselves. Only if the warning forecaster was paying close attention to the base data from KOAX, would he/she have caught the event much ahead of 3DVAR. Note also the Tim and I had warning out of this area well in advance of the event as the hail threat quickly evolved to a heavy rain and damaging wind threat.

SNELSON/TMT

Tags: None

ABQ: CTC + Situational Awareness = Great Fcst

Although we are in AMA, we took a look at the CTC in NM, since that area has seen significant CTC signals over the last week. Once again, we are seeing strong CTC signals off the terrain in NM with little or no convective development. Here are a series of 3 signals in the same place over several hours. Take home point — this is a great product, however forecasters need to know their environment to use this product in enhanced warning ops and beware of times that the convection is being forced by the terrain. Case in point, although the CTC product showed -20->-25c/15min cooling values over higher terrain areas in SE NM, the sfc dwpts were in the teens and lower 20s. Almost no way convection could develop with this dry air. MRD

2015z:

2215z:

2315z:

Tags: None

AMA: Gonna Eat at the Big Texan Tonight

We have switched CWA’s and now are located in the AMA CWA. Ongoing supercell thunderstorms were severe when we began. Left moving supercell had a max updraft strength of 27 m/s. MESH was appropriately lagging and was giving me 1.5″ hail. Went ahead and added golf ball size hail to the warning, although MESH has now exceeded 2″ in diameter. With only a volume scan or two from the KAMA radar, the warning was based heavily on the MESH 30 minute track.

Tags: None