LAPS performance with decaying thunderstorm cluster

LAPS_23Z
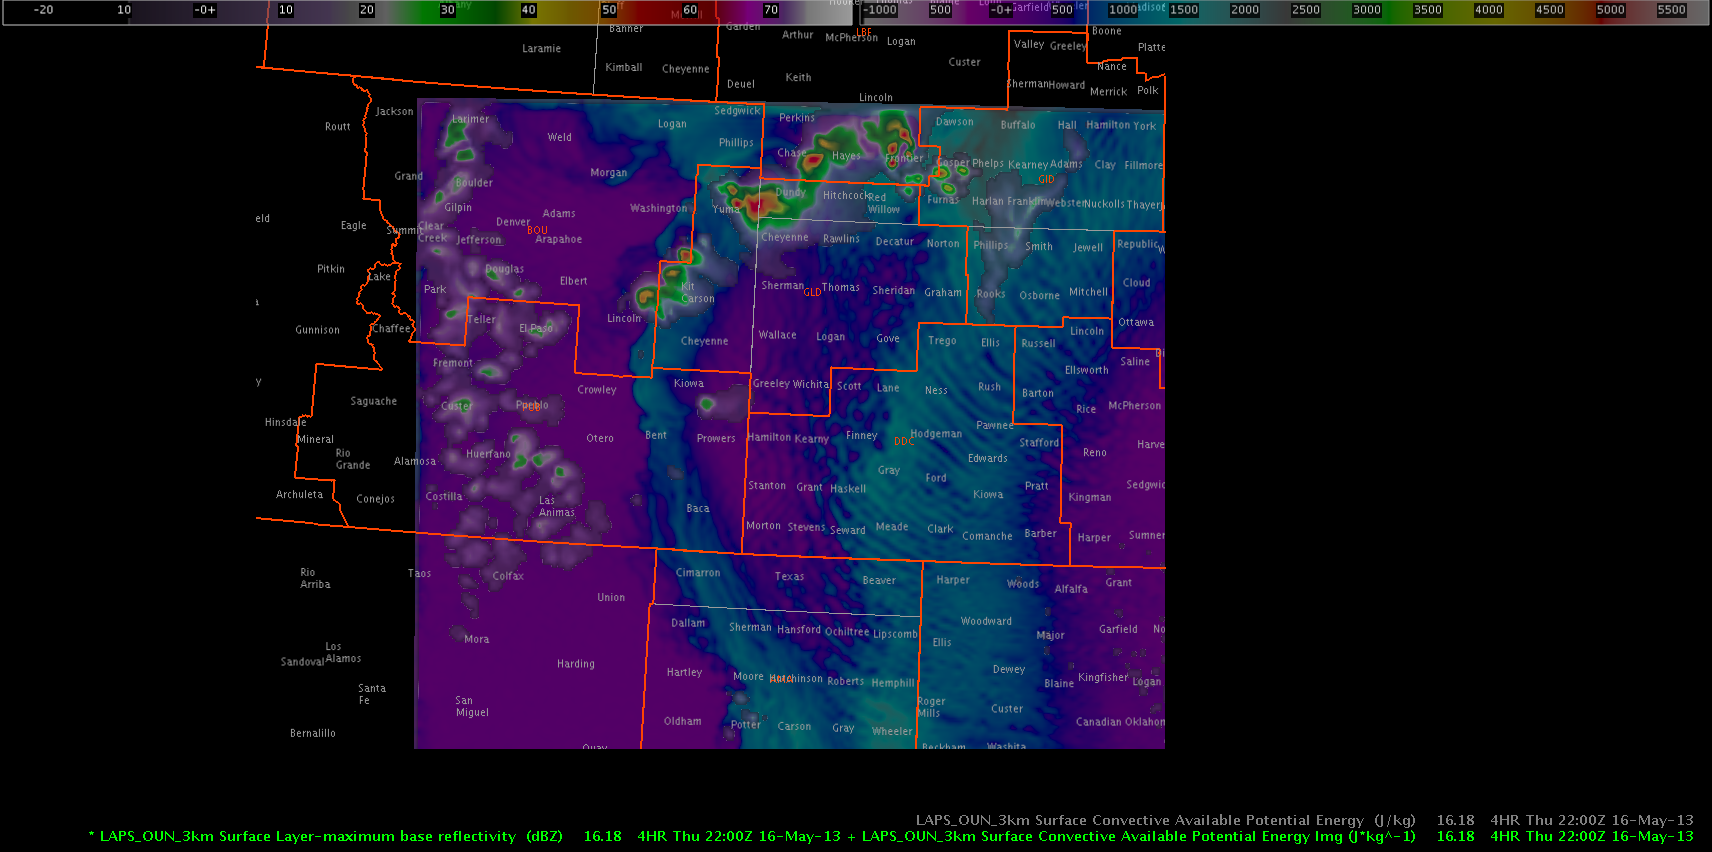
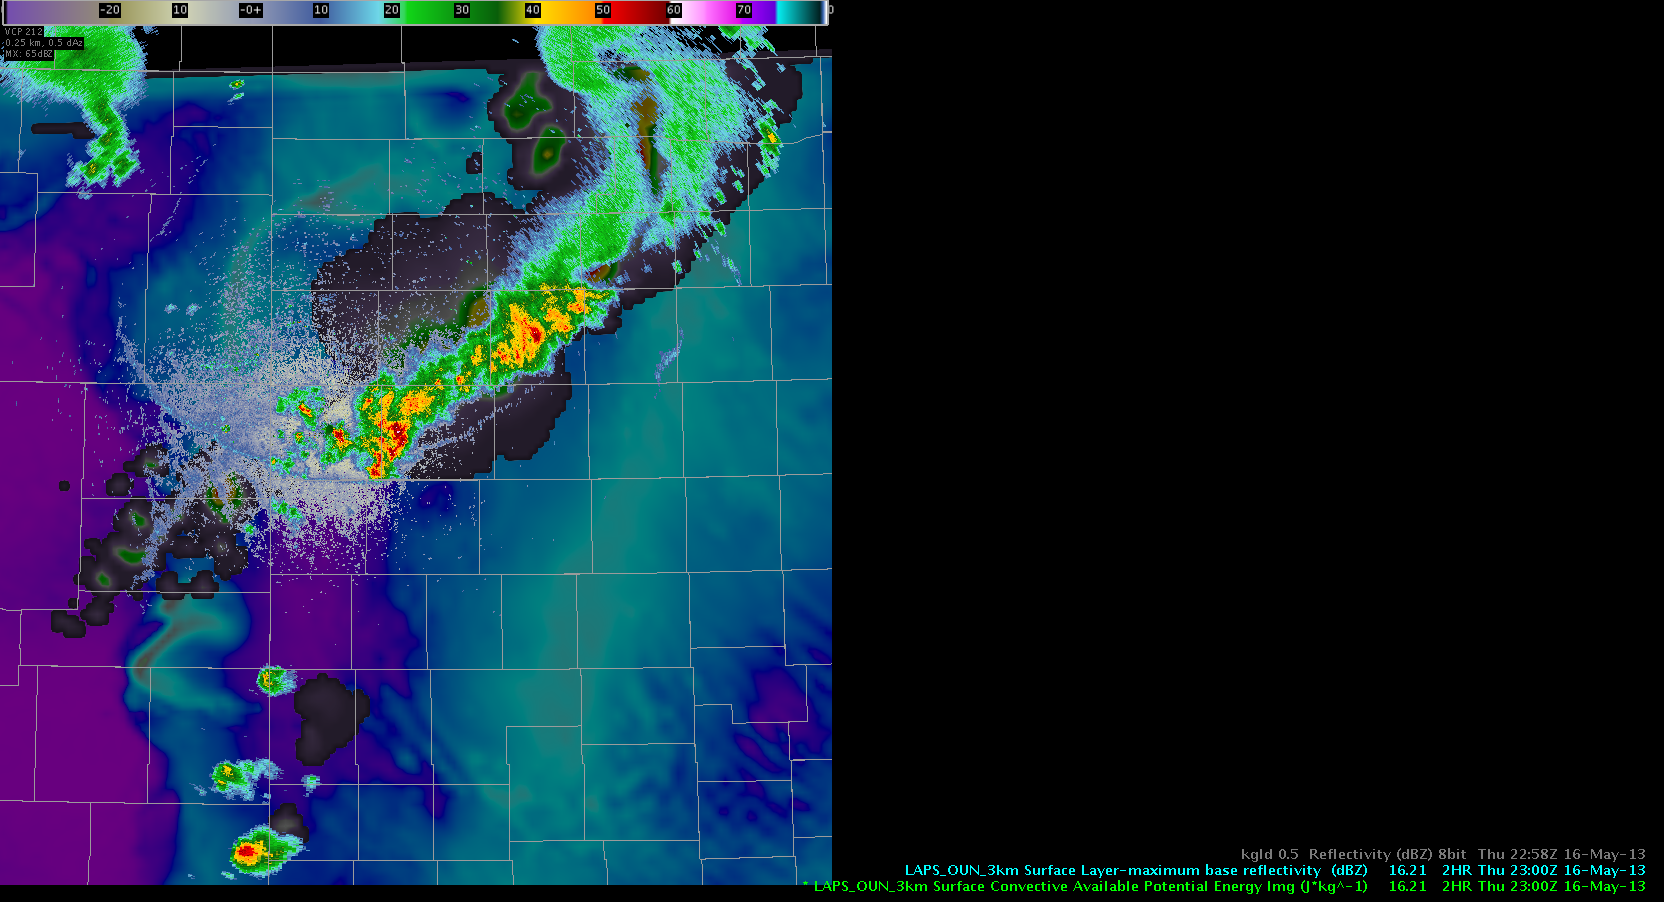
A short overview about how the LAPS handled both the decaying cluster of storms but also isolated thunderstorm activity further to the south. Both models, OUN WRF (not shown) and 3 km LAPS tried to strengthen the northern part of that line despite real time radar data showing a constant weakening trend. In contrast, the southern part was captured very well, both in space, timing and strength of those cells. Until now, model’s QPF was lower than the real time radar showed, which likely resulted in a stronger outflow boundary to set up to the SW of the thunderstorms. LAPS had the outflow boundary more to the east and in a north-south fashion. In the near term, LAPS weakens the southern part of the line, which is in line with rapidly decreasing CAPE values further downstream….latest radar trend partially confirms that with some ongoing re-development along the SE fringe (where warm/moist inflow continues to feed the system).

LAPS captured isolated storms further to the south very well. As they moved off the mountains they entered a drier air mass to the east and weakened both in model data but also in reality. LAPS sends at least one healthy outflow boundary to the NW which collides with aforementioned extensive outflow boundary from the N/NE in the model’s world. Not sure if that’s real, as mountain storms looked ill and revealed stronger cores only for a short amount of time. Nevertheless, we continue to monitor both eastward progressing cells and northwestward motion of the outflow boundary. Helge

Tags: None

May 16th: GLD-DDC Mesoscale, OUN WRF vs. LAPS forecasts

An MCS was already moving through south-central LBF and northwest GLD CWAs at 20Z. The OUN WRF was not showing convection to be as organized and linear as the actual convection was. The OUN WRF had maximum values of hourly column hail around 20 km/m2 and max sfc updraft helicity of 50 m^2/s^2 across southern NE and northern KS at 20Z, indicating marginal large hail/tornado potential. CIMSS 780MB-500 MB CAPE in this area was around 1000 J/kg and the vertical Theta-e Diff Low-Mid was around 11K.

WRFLayerDerivedReflectivity

GLD2030zCRTop image is the 18 UTC run of the OUN WRF forecast for 2030 UTC. The bottom image is the actual GLD composite reflectivity for 2022 UTC..

22ZOUNWRF4hourforecast

22zGIDcrTop image is the 18Z OUN WRF four hour forecast of derived reflectivity and the bottom image is its four hour forecast of CAPE. The WRF was showing several storms across far western Kansas down to the Oklahoma panhandle. The 3 km LAPS 18z run was showing a narrow lane of higher sfc-based CAPE in this area. The 20 UTC run of the OUN WRF trended stronger with line of storms across southeast Colorado with a nearly solid line with bowing line segments perhaps bringing a severe wind threat to the DDC warning area.

22zCAPEOUNWRF

ObservedCAPEThe top image is the 18 UTC sfc based CAPE forecast for 22 UTC. The bottom is the observed sfc-based CAPE for 22 UTC. The bottom image is the surface-computed CAPE calculated by LAPS from observations. It shows an axis of higher CAPE through the central part of the DDC CWA. Unfortunately the domain does not cover the GLD CWA.

-Ostuno

Tags: None

Slow day in CI/CTC land

Shown below is a classic example of CI/CTC spoilage by upper level cirrus clouds.  Note the rather mature convective system over the GLD CWA.  All of the SPoRT CI algorithm detections (upper left) are all in the cumulus field on the outer fringe.   CTC detections, when they occur (upper right), are similarly absent from the main complex.  This has been the case the entire shift.  Perhaps without the cirrus, we would be able to see strength fluctuations in the convective line, but the constant presence of cirrus over the top does not allow the satellite to sense updrafts.  While there have been improvements to CTC over the last year to two to deal with thin cirrus, even that work would not help here.  Cirrus contamination is clearly the main drawback to these otherwise excellent and useful products.

CL

CI_CTC_deadness


Tags: None

20Z Nearcast Analysis of CAPE Trends Through the Afternoon

The 20Z Nearcast model shows slow but steady weakening of instability fields through the afternoon. Ribbon of 800-1000 J/KG along the CO/KS border between 20-22Z with a theta-e diff of 8-11K decreases through the late afternoon and evening to roughly 600-900 J/KG. There is a similar trend in theta-e difference with 6-9K theta-e difference in this region through the early evening…along with about 30kts of 0-6 km shear. Further east into central Kansas…CAPE and theta-e difference significantly drop off…so from this forecast one can expect any storms that develop within the convergence zone along the KS/CO border to move east and have some marginal strength and organization before dissipating as they approach central Kansas.NearCast_CAPE


Tags: None

Sad Storms in far SE CO/SW KS – No Juice

GOESRNEARCASTPW2230UTC051613This image depicts CIMSS-NRE 700-300 mb precipitable water values overlaid with 0.5 Reflectivity from KDDC.  These struggling high based storms are over an area with precipitable water values only 0.05 to 0.11 inch between 300 and 700 mb.  It seems very unlikely these storms will do anything, unless they can quickly move east in the next few hours where much higher precipitable water values exist. Michael Scotten

Tags: None

S Nebraska Line Segment & LAPS

The weak line segment progressing across S NE did indeed seem to lead to new development (upon its leading outflow boundary) as it reached an axis of better surface-based instability to its east, as analyzed by the 3-km LAPS. Another example of the good visualization / analysis tool of reflectivity + LAPS CAPE.

21Z LAPS analysis of 2130Z SBCAPE + Reflectivity Mosaic (region of approx 1500 J/kg CAPE is scalloped)

laps3km_mosaic21Z LAPS analysis of 2215Z SBCAPE + Reflectivity Mosaiclaps3km_mosaic_2Picca

Tags: None

3 km LAPS Forecast for Comparison with OUN WRF

Looking at the 18Z run of the 3km LAPS…the model has a ribbon of north-south oriented CAPE further west into eastern Colorado than the Nearcast model and is much skinner. LAPS_NOWCAST_CAPE

Much lower values of CAPE are forecast in far eastern Colorado into western Kansas…and as a result…the storms that fire along the sfc convergence boundary in eastern CO develop quick but quickly die as they move off into the lower CAPE fields along the CO/KS border. This is more or less opposite the Nearcast model.

LAPS_Combined_reflCAPE

In a similar fashion…updraft helicity is relativly weak throughout the region although the storm in eastern Yuma county has more persistent helicity field maximized at 58 m2/s2 at 22Z. LAPS_Hel_18Zvalid22ZComposite radar verification at 22z indicates the 18Z LAPS run is slow to move the strongest convection in northwest Kansas to the southeast and is significantly further west with the storms than reality in southeast Colorado. In addition…the LAPS convection is weaker than reality.22zcomp


Looking at the 21Z run…the CAPE ribbon is a bit further east than the previous run and the model is capturing the return flow of higher instability as moisture is advecting in from the southeast. However…the slower advection of moisture as seen on the surface obs makes me think the LAPS is a bit aggressive with this moisture return.  The reflectivity fields both along the line in northwest Kansas and the weak cluster in southeast Colorado are better analyzed initially although are a bit weaker than reality at 23Z. The 21Z run does however show the cold pool associated with the squall line really well as it traverses southeast across GLD CWA. It also has very good definition of the individual cell’s cold pool boudaries as well.

*see image /bmazur/23ZLAPSanalysis.png

*see image /bmazur/23zcomp.png

I would like to attach an image of the 3km instantaneous updraft helicity as well but am not able to load the data at this time.

An interesting feature showed up at the 2115Z timestep of the 21Z run. A donut of nearly 5000 J/kg of CAPE showed up surrounding a weak isolated cell in Prowers county. This area of high CAPE was then dispersed with time along the CAPE ribbon. Not sure what would cause this in the model but found it to be an interesting feature.

*see image /bmazur/capebomb.png

RJM


Tags: None

Struggling High Based Convection in Colorful SE Colorado Using CI/CTC

A few high based storms have been struggling to develop across southeast Colorado due to abundant dry air and SBCAPE 500-1000 J/kg.

4PanelCICTCDDC2045UTC051613The first image was at 2045 UTC on May 16 where the GOESR UAH CI suggested some potential for convection with a few locations 61-78%, and the CIMSS CTC depicted a maximum of -18C/15 min.  This appeared promising for deep convection.

4PanelCICTCDDC2115UTC051613 The next image was at 2115 UTC and continued to depict a few areas 20-62% for CI as well as -16C/15 min along with a few weak cells.  At this point, there still remained hope for some deep convection.4PanelCICTCDDC2145UTC051613The last image was at 2145 UTC respectively with lower CI and CTC values as well as a few non-severe/rather weak cells. So far, these cells have failed to intensify or become severe. Weak forcing aloft in conjunction with the lack of low level moisture may be the main culprits for the poor development of storms.

Tags: None

Daily Summary for EWP Week 2, Day 3, 15 May 2013:

Yesterday was the busiest day of the week 2, if not our entire experiment.  We localized to the OUN and FWD county warning areas.  Mazur/Ostuno handled to the OUN domain, taking time to examine pGLM lightning data from the OKLMA and work with the NASA-SPoRT moving trace tool.  Along the way they issued a number of severe warnings and a few tornado warnings on radar circulations.  Scotten/Helge managed the mesoscale desk across the region, providing some detailed updates on the LAPS/OUN-WRF and GOESR CI products.  Picca/Leonardi managed the warnings over the FWD CWA.  Though activity across this region began slowly, the evening finished with multiple tornadoes still on the ground.  They

EWP warnings and Rotation Tracks at 0005 UTC on 16 May 2013.


SPC storm reports from 15 May 2013.  (Likely to updated as more tornadoes are added)
SPC storm reports from 15 May 2013. (Likely to updated as more tornadoes are added)

A bit of the feedback from the debrief:

–The HSDA performed better than previous days this week, however, it may be nice to add an area or volume criteria (compared to individual pixels) to increase forecaster confidence.

–The MESH and lightning flash rates had comparable trends in the OK region, with the flash rates typically preceding MESH by ~1-2 min and reports on the ground by ~15 min.

–The forecasters found manually adjusting the moving trace for every frame to be a bit tedious and would prefer an “apply to all” option.  As it stands now, the tool is difficult to use in realtime, but still could be useful for post-analysis and shows great promise for future operations.  Forecasters are particularly interested in the capability of displaying trends from multiple fields on the same graph (e.g., flash rates and hail size).

–The LAPS instability field was quite useful when combined with a radar mosaic.  Particularly early on in the FWD domain, this field provided clues to when storms would decrease or increase in intensity with time.

–The LAPS 22 UTC 1-km forecast was incredibly accurate 2 hrs out.  The updraft helicity product was useful in visualizing the location/strength of the activity.

–MRMS rotation tracks were commonly utilized by the warning forecasters.  They found that they helped draw polygon size / shape and reduced FAR area.  The rotation tracks / AzShear product was a time saver particularly for situational awareness (calling attention to storms /locations).

-Kristin Calhoun, Week 2 Coordinator

Tags: None

Can it be…LAPS CAPE is wrong?

Storms continue in a linear convective mode across the GLD CWA.  The 18Z run of the LAPS suggested lower instability ahead of the line as it continues to sink south.  Here is the current setup.  As you can see, the storms are maintaining some level of strength as they move into this supposedly more hostile environment.  The mesoscale desk noted that the GOES NEARCAST products maintained higher instability across the CWA and are probably more correct in this scenario.  Just goes to show that no product is right all of the time, or even most of the time!

CL

LAPS_radar_051613_2153

Tags: None