


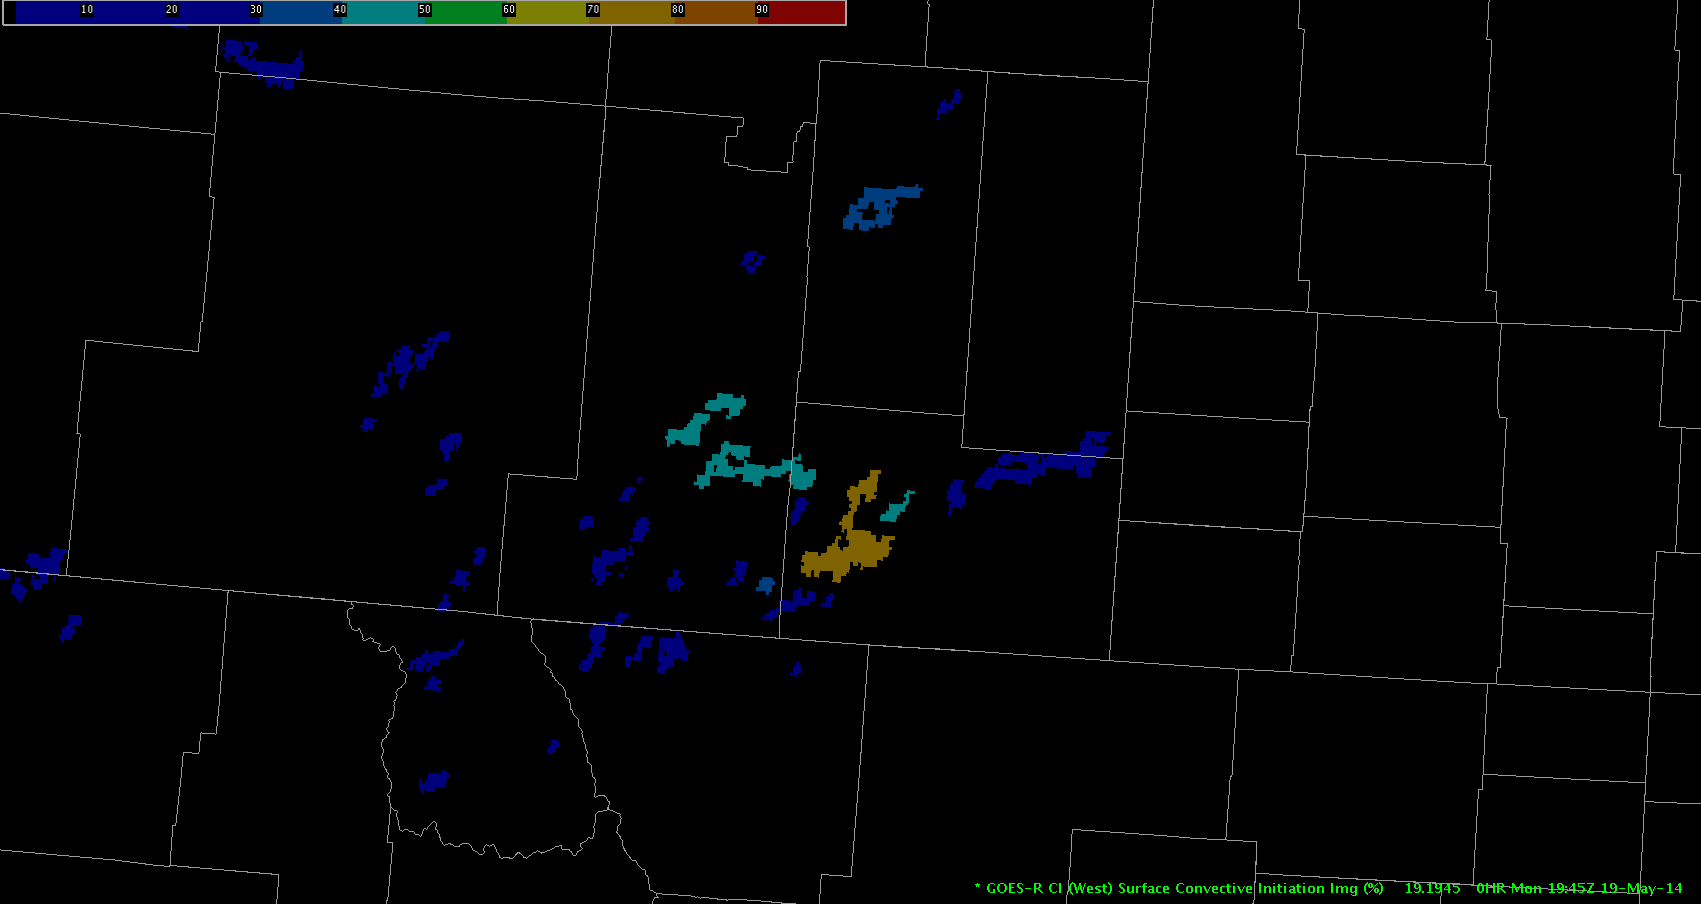
I saw my first 70% Convective Initiation in SE Wyoming! Exciting.
-Vollmar
Official websites use .gov
A
.gov website belongs to an official government
organization in the United States.
Secure .gov websites use HTTPS
A
lock (
) or https:// means you’ve safely connected to
the .gov website. Share sensitive information only on official,
secure websites.

I saw my first 70% Convective Initiation in SE Wyoming! Exciting.
-Vollmar
Monday 19 May 2014 begins the third week of our four-week spring experiment of the 2014 NSSL-NWS Experimental Warning Program (EWP2014) in the NOAA Hazardous Weather Testbed at the National Weather Center in Norman, OK. There will be two primary projects geared toward WFO applications, 1) a test of a Probabilistic Hazards Information (PHI) prototype, as part of the FACETS program and 2) an evaluation of multiple experimental products (formerly referred to as “The Spring Experiment”). The latter project – known as “The Big Experiment” – will have three components including a) an evaluation of multiple CONUS GOES-R convective applications, including satellite and lightning; b) an evaluation of the model performance and forecast utility of two convection-allowing models (the variational Local Analysis Prediction System and the Norman WRF); c) and an evaluation of a new feature tracking tool. We will also be coordinating with and evaluating the Experimental Forecast Program’s probabilistic severe weather outlooks as guidance for our warning operations. Operational activities will take place during the week Monday through Friday.
For the week of 19-23 May, our distinguished NWS guests will be Joshua Boustead (WFO Omaha, NE), Linda Gilbert (WFO Louisville, KY), Grant Hicks (WFO Glasgow, MT), Julie Malingowski (WFO Grand Junction, CO), and Trisha Palmer (WFO Peachtree City, GA). Additionally, we will be hosting a weather broadcaster to work with the NWS forecasters at the forecast desk. This week, our distinguished guest will be Danielle Vollmar of WCVB-TV (Boston, MA). If you see any of these folks walking around the building with a “NOAA Spring Experiment” visitor tag, please welcome them! The GOES-R program office, the NOAA Global Systems Divisions (GSD), and the National Severe Storms Laboratory have generously provided travel stipends for our participants from NWS forecast offices and television stations nationwide.
Visiting scientists this week will include Steve Albers (GSD), John Cintineo (Univ. of Wisconsin/CIMSS), Ashley Griffin (Univ. of Maryland), Chris Jewett (Univ. of Alabama – Huntsville), James McCormick (Air Force Weather Agency), Chris Schultz (Univ. of Alabama – Huntsville), and Bret Williams (Univ. of Alabama – Huntsville).
Darrel Kingfield will be the weekly coordinator. Lance VandenBoogart (WDTB) will be our “Tales from the Testbed” Webinar facilitator. Our support team also includes Kristin Calhoun, Gabe Garfield, Bill Line, Chris Karstens, Greg Stumpf, Karen Cooper, Vicki Farmer, Lans Rothfusz, Travis Smith, Aaron Anderson, and David Andra.
Here are several links of interest:
You can learn more about the EWP here:
NOAA employees can access the internal EWP2014 page with their LDAP credentials:
https://hwt.nssl.noaa.gov/
Gabe Garfield
CIMMS/NWS OUN
2014 EWP Operations Coordinator
This week, the EWP had forecasters from the Louisville, Buffalo, and Norman WFO’s, as well as a broadcast meteorologist from WUSA (DC CBS affiliate) participate in the Big Spring Experiment. Operations on Monday began in the Davenport and St. Louis CWA’s. Throughout the week, operations slowly shifted eastward as we evaluated the products with severe weather development along an eastbound cold front. These operations included the Detroit, Cleveland, Wilmington, Charleston WV, Pittsburgh, and Sterling CWA’s. One group on Thursday operated in the Shreveport CWA, where marginal severe weather occurred as an upper level disturbance moved through a region characterized by weak low-level moisture but steep lapse rates and only marginal instability. This unique environment posed some interesting forecast challenges, so it was neat to see how the various satellite products and OUN WRF performed.
Participants were able to use all of the demonstration products this week, which included GOES-R and lightning products, LAPS fields, and the OUN WRF model finally on Thursday. There were many good blog posts written throughout the week highlighting the use of all of these products in various situations across various regions of the US. Below is some end-of-the-week feedback on each product from this weeks participants:
GOES-R
Simulated Satellite Imagery:
NearCast System:
GOES-R Convective Initiation
Prob Severe Model
Overshooting Top Detection
PGLM
Lightning Jump Algorithm
Tracking Tool
I like the graph itself, but the actual functionality is bad.
GOES-14 SRSOR (1-minute imagery)
LAPS
OUN WRF
Other:
– Bill Line, SPC/HWT Satellite Liaison and Week 2 EWP Coordinator
For the final day of week 2, we operated in the Sterling and Shreveport CWA’s. The folks in the Sterling CWA were able to take advantage of the DC LMA and evaluate the PGLM total lightning and Lightning Jump products. Unfortunately, the lightning activity was quite minor, but they were still able to get a feel for those products. Forecasters in the Shreveport CWA were able to utilize most of the GOES-R products (minus lightning) and the OUN WRF model in forecasting for clear-sky convection in the ARKLATEX region. Though severe weather was not widespread, it was beneficial to evaluate these products in a more marginal clear sky situation.
Tomorrow at noon, this weeks participants will share their experiences from the week via the “Tales from the Testbed” webinar.
– Bill Line, GOES-R SPC/HWT Satellite Liaison and Week 2 EWP Coordinator
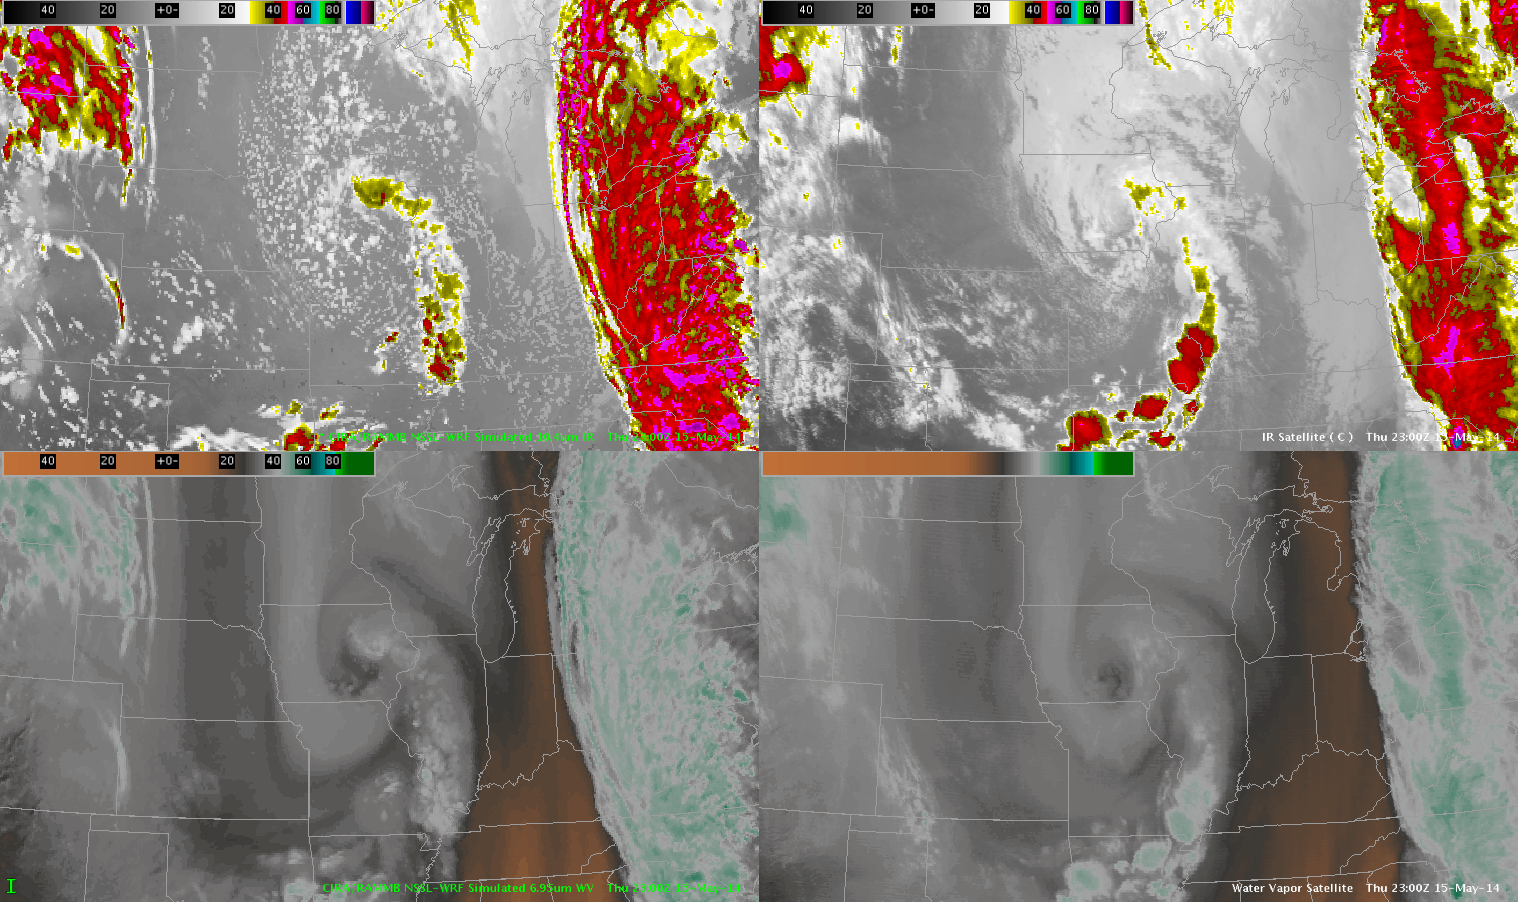
Synthetic Water Vapor Imagery (lower left pane) handles observed “Water Vapor Hurricane” (lower right pane) over Iowa fairly well.
 Shawn Smith
It appears that the vLAPS 800×800 caught up and ended up being well-resolved by the early evening hours! Unfortunately, since I wasn’t tracking it all day, I don’t know how or why the max base reflectivity improved. Here’s the vLAPS at 22Z on Thursday:
 The model picked up very well on the high reflectivity southwest of DC at the same time, and it did a decent job with the cell north of DC, though a bit underdone. However, the max reflectivity further to the south into southern Virginia appears to be overdone.
 So perhaps this means that the model is off spatially in its forecast, with higher reflectivity values shifted too far to the south.
The simulated IR imagery showed the cold front’s areas of convection on the leading edge of the storm in our target area of Virginia and Maryland on Thursday afternoon.
 It matched up spatially with what we were seeing in reality on the rapid scan GOES IR imagery at the same time stamp, 20Z.
 The area in blue on the simulated IR indicates cloud tops colder than -60C. This shading doesn’t show up on the real IR image at all, but the cloud tops do have temperatures below -50C in the same convective regions. It looks like the simulated IR is going to overdo the convection, especially for the southern cell over central Virginia, but I thought I’d keep an eye on it to see if a convective cell spawned a severe warning in that area.
The simulated image valid at 21Z shows the strongest convection has shifted further east and is concentrated into one cell.
 That cold cloud top maximum in northern Virginia is much smaller and not nearly as cold in the real GOES IR image from 21Z.
 During this time period, a line of strong to severe thunderstorms was pushing through the DC Metro area.
 Comparing the radar data to the simulated IR at the same time stamp, it appears that the small clusters of convective cells were not well resolved by this product. In fact, the clusters of storms to the south and west of DC were either completely missed by the simulated imagery, or the placement was off by about 50 miles (clouds too far to the southwest to be a match for the convective cells).
This was a day where we had limited tools for severe weather forecasting in the DC Metro area. The threat for hail and tornadoes was very low. ProbSevere, convective initiation, overshooting tops, and PGLM products were rendered useless because of a lack of convection and lightning parameters.
 Finally on our last day of EWP operations we were able to capture a weak lightning jump with the Lightning Jump Detection Algorithm. This jump was detected from a discrete cell that was lifting north across the western edge of the District of Columbia around 2109z. The jump from 0 sigma to 1 sigma (or 1 Standard Deviation) shows up as the green blotch on the image above. This is overlaid on top of the Flash Extent Density product which measures total lightning in the storm. At this time in the image above the flash density was 10 flashes per km^2 which was overlaid on 0.5 deg KLWX reflectivity of around 52 dBz.
The Tracking Meteogram Tool was used to see the evolution of the Lightning Jump, reflectivity and Flash Extent Density verses time. The take home from this is that a lightning jump or rapid increase in Flash Density within a storm correlates with a rapid intensity of a storm. Note that between 21:06z and 21:08z the Flash Extent Density rapidly increased or “jumped” from 1 flash/km^2 to 10 flashes/km^2 which triggered the Lightning Jump Detection Algorithm to increase from 0 to 1 sigma. During this time the dBz values of reflectivity increased from 20 dBz to greater than 55 dBz in 8-9 minutes. This cell was also somewhat low-topped with echo tops only reaching to around 32kft. Please keep in mind that this is a weak example of just how rapidly a cell can intensify since the jump was only 1 sigma.
Shawn Smith
The storm below produced golf ball size hail (around 1.75 in diameter) and had 50 dBZ up to 31157 ft MSL from SRX radar (114 nm to the west southwest). ProbSevere only indicated 13% for severe with 1049 J/kg, 25.4 kt of EBShear, and 0.60 in MESH. The lack of nearby radar data with the LZK (Little Rock) WSR-88D being inoperable may have significantly impacted the ProbSevere algorithm.
ProbSevere seems to again be underestimating the severe potential and expected hail size. The environment was characterized with low topped severe storms with mid/upper trough overhead. The 12Z LZK sounding is below as the last image.

 Michael Scotten
 Above is the NearCast imagery at 22Z. Utilizing this imagery, a pretty apparent boundary is evident across portions of MO into northwest Arkansas. Along this boundary, convection was much more widespread than it was further south. Further south, despite better instability, there is no indication of any boundary which likely explains the more scattered nature of the convection. Operationally, seeing this boundary on the nearcast model would give me higher confidence in convective coverage further north versus further south.
