ProbSvr and the Development of a Supercell in Northeastern Kansas

The storm of interest began to develop in a weak line of showers around 1930 UTC.  Surface obs through the area indicate temperatures in the lower 80s and dewpoints in the upper 50s to low 60s.  ProbSvr indicated around a 10% chance of the storm becoming severe.  The storm slowly strengthened over the next 20 minutes, but the Prov Svr remained around 10%.  From 19:52 to 19:57 UTC, the storm intensified rapidly, and the Prob Svr jumped from 13% to 72% (time of two radar scans)
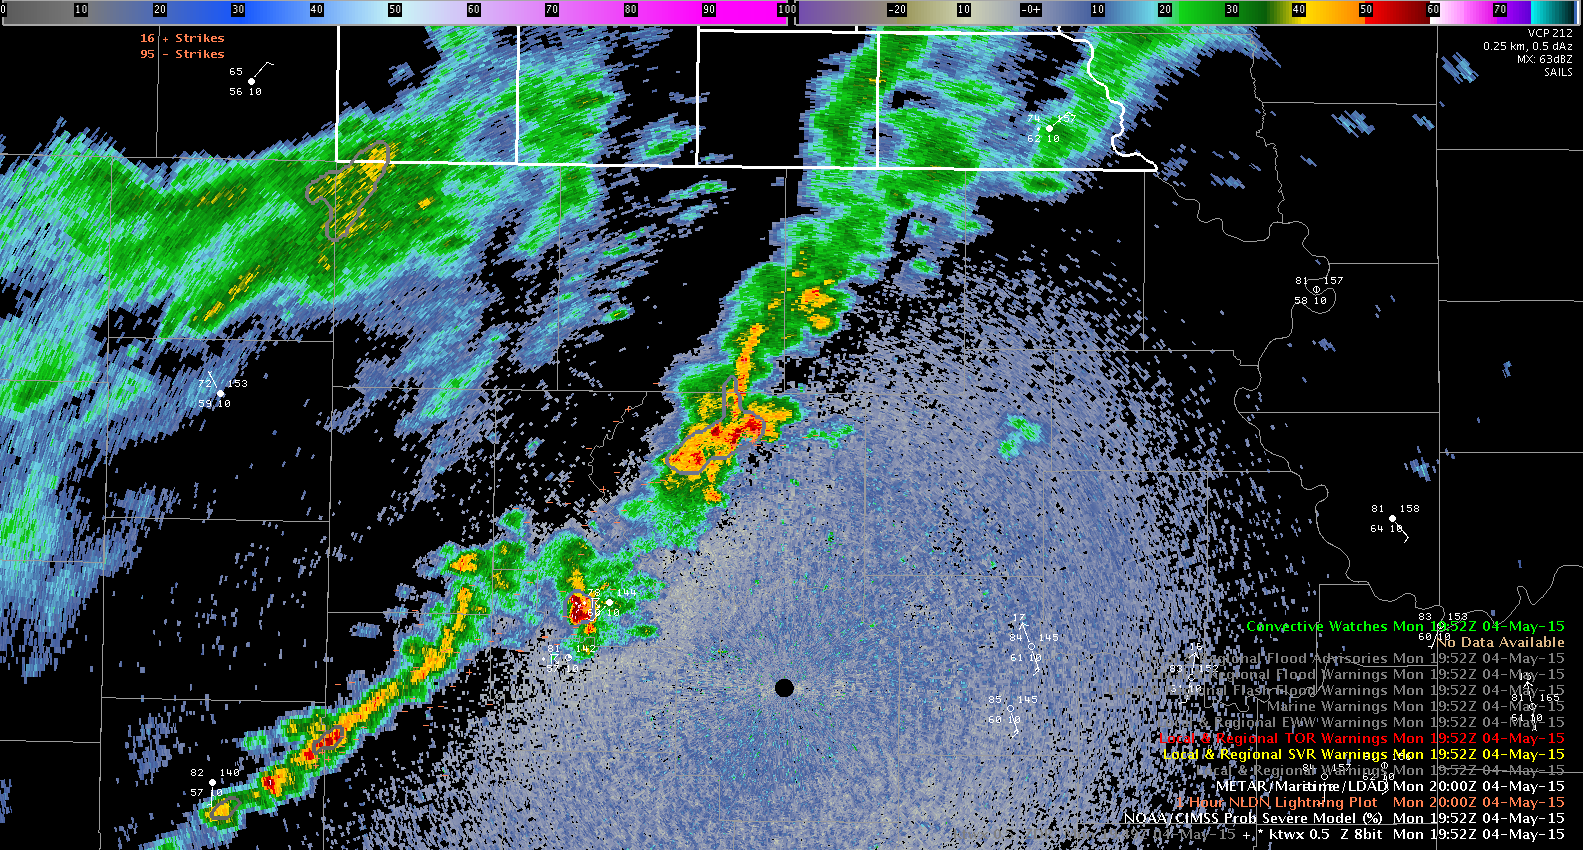
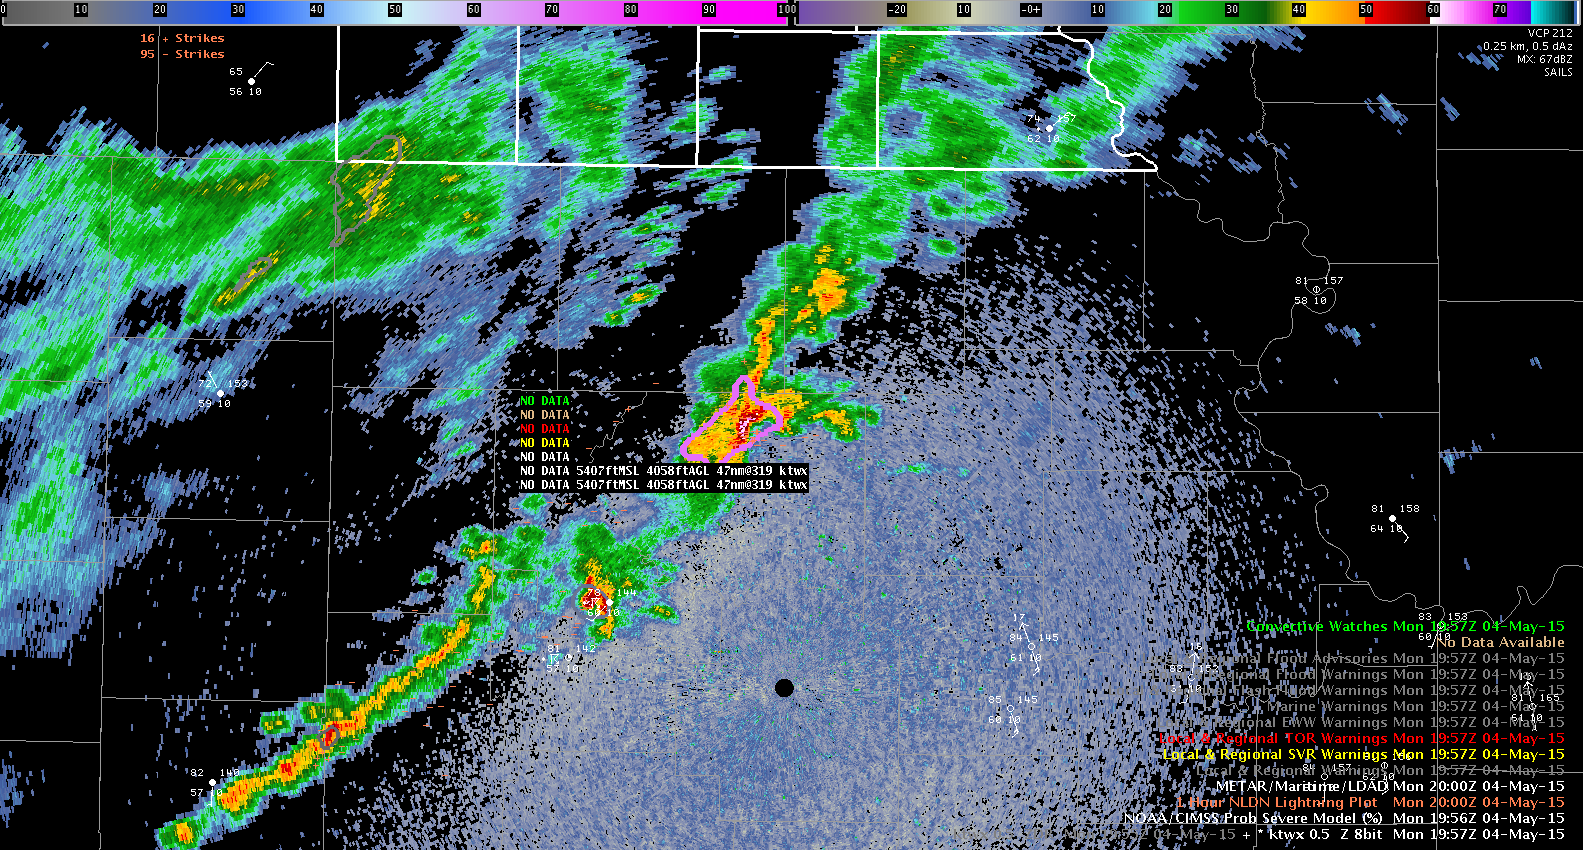
ktopProbsvr10ktopProbsvr72

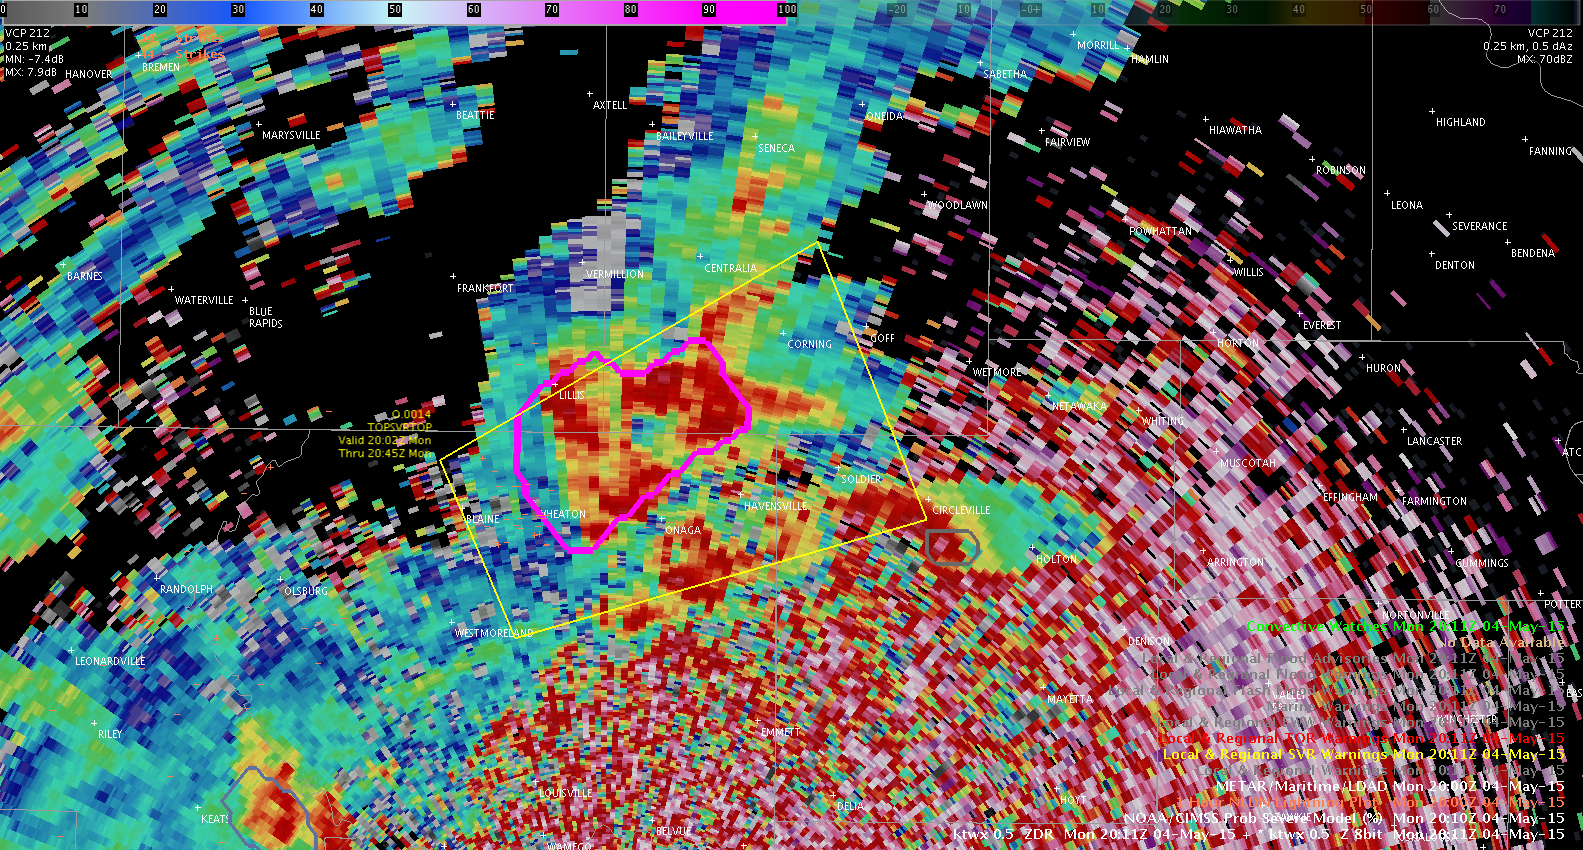
It appears the storm is beginning to root along the E-W warm frontal boundary through the region.  At 20:11Z, ProSvr MRMS MESH indicates 2″ in diameter hail in the highest dBz core.  This area correlates well with lower values of Zdr of near or just below 0 dB.ktopProbsvr2011utc
Although I did not see any hail reports while I was watching the storm, the first severe wind gust report (60 mph) occurred at 20:30 UTC, about 32 minutes after the ProbSvr rapidly increased.  Because I used the site radar (KTWX), there was a slight lag in the availability of the ProbSvr data.

Tags: None

Valid period for Level 3 DTAs may be too long

Noticed how a storm may briefly increase to 40 flashes/min, yielding a level 3 DTA for a cell. See the images below which highlight that although the DTA threshold was met for briefly for a few minutes, the successive flash rates dropped below the 40 flash/min threshold for minutes thereafter. The DTAs may be more useful for operational forecasters if the valid time were reduced from 45 mins to 30 mins. This would reduce the amount of products that may clutter up the radar interrogation process.

DTA2046Z DTA2049Z DTA2051Z DTA2054Z DTA2057Z DTA2059Z DTA2102Z

Brick Tamland

Tags: None

Severe Storm in Midland’s CWA

Now that we have a verified severe storm in Midland’s area, let’s see how the lightning jump and probability severe algorithm worked.

MAF prob svr 1945Z

At 1945Z, the algorithm showed a severe probability of 27%. The lightning jump was nothing to jump about.

MAF prob svr 1950Z

With the next 0.5 deg scan at 1950Z, the probability skyrocketed to 83%.

MAF jump 2031Z

At 2031Z, a 3 sigma lightning jump occurred. Severe probability was 93% at this time.

MAF TBSS 2049Z

By 2049Z, the cell grew into this beast. Max reflectivity on the 0.5 deg tilt was 75.5 dBZ @ 16000 ft MSL/12230 ft AGL. A prominent TBSS had developed on the storm by 2040Z.

MAF LSR

The LSR associated with this storm is shown here. Severe hail was observed beginning at 308 PM CDT/2008 GMT. In this case, the lightning jump occurred over 20 minutes after the storm began to produce severe hail. However, the probability severe did provide a lead time of about 20 minutes.

-V. Darkbloom


Tags: None

East and West Lightning data

Below is an image where the western cell was in the western US section of the thunderstorm alert area and the eastern cell was in the eastern US section of the thunderstorm alert area. Both sections are in the Midland CWA. Note the long lift of products loaded to have both cells in a Level 1 thunderstorm alert. Why was there no Level 2 alert on the eastern cell? It had 12 or more flashes for 2 to 3 minutes.

east West Ligtning trends

This set up with a set boundary will be cumbersome when it crosses through any CWA.

-Lynford


Tags: None

NUCAPS Sounding for NE Kansas

With the main convection still to the south of the area, decided to test out the 1900Z NUCAPS sounding. With clouds and convection closer to the KS/NE border, went a little farther south into Kansas for the sounding, which conveniently lined up the KFOE site.

20150504_1900Z_NUCAPS_Area

Clicking on that point came up with the sounding shown below.

20150504_1900Z_NUCAPS_Orig

This sounding provided a good first guess, but looking at the surface data (75/56 on the sounding) indicated that it needed to be adjusted to match the ob at KFOE (84/59).

20150504_1900Z_NUCAPS_Modified

Making that adjustment to the surface conditions increased the CAPE values from around 1350 J/kg to 2660 J/kg. That put the values better in line with the initial values see on the RAP initial conditions. -SRF

Tags: None

Lightning Observations at HWT

Total lightning has a large role in the Experimental Warning Program this year.  We are on day 1 of the first week and everyone is familiarizing themselves with the various products.  I have shown an quick comparison of some of the products that we will be evaluating throughout the week.

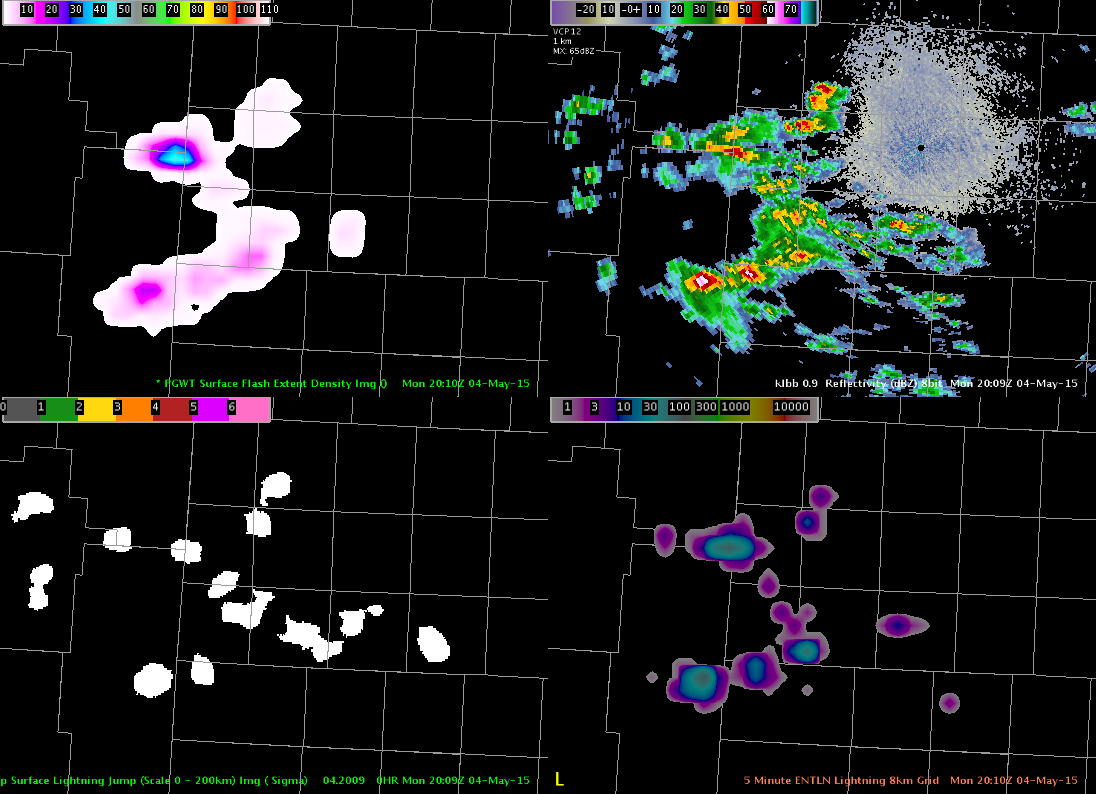
The storms cooperated by moving into the West Texas LMA domain (Lubbock county warning area) allowing for the first views of the NASA SPoRT pseud-geostationary lightning mapper (PGLM) this year.  The image shows the PGLM (upper left), radar reflectivity (upper right), the lightning jump showing the sigma level change using Earth Networks data (lower left), and the Earth Networks total lightning over a 5 min summation and put on an 8 km grid.

The PGLM is showing a maximum value of 41 flashes over a 2 min window with the Earth Networks showing ~40 flashes over a 5 min window.  The lightning jump indicated the storm in the north as having a 1-sigma change, which is not enough to indicate severe weather is imminent.  The PGLM gives another view of spatial extent of the lightning, which is particularly evident in the northernmost section.  The main advantage of Earth Networks is the coverage, unlike the small domains from the lightning mapping arrays that are used to derive the PGLM.

Lightning observations from the 2 min PGLM (upper left), radar reflectivity (upper right), lightning jump algorithm (lower left), and Earth Networks 5 min data on an 8 km grid.
Tags: None

First Severe TOP

First severe storm warning issued at 2002 UTC for a storm over northern Pottawatomie county along strong instability gradient, just southeast of a weak surface low and in the vicinity of weak surface boundary.

SVRTOP1_DTA_PROBSVR

Looking at the all-tilts products we noticed 60 dbz values above the -20C level and the ETN displayed a DTA with a significant increase in flash rate from around 30 to 60 to over 100 flashes in consecutive scans.  This coincided with GOES-R overshooting top detection as well as the lightning jump algorithm showing a 2 sigma jump followed by a 6 sigma jump.

4panel_PHI_ProbSvr_OvershootTop_LtgJump

The probability of severe increased to over 90% shortly after the warning went out and the PHI also was showing values in the 70s preceding the warning and was above 80% at the warning issuance.  This particular case in my mind really builds my confidence in the potential of the lightning jump, PHI and prob severe algorithms as it relates to warning operations and potentially improving lead time, of course after proper studies have been done in both verifying and null events.  It would be helpful to have some sort of threshold values for PHI and Prob severe as general guidance (based on geographical location).

DTA track was not very representative of the actual storm motion as it had a northern bias.  This could be due to the storm favoring the instability gradient and local boundary as the actual storm motion was more east of the DTA track.

Jack Bauer/Brick Tamland

Tags: None

Awips 2 issue with Cell Tracking

Overlayed cell tracking with Thunderstorm alert Level 2 and Alert Level 3 on KMAF reflectivity. Also had points (editable). I wanted to get the cell lightning trend. However, number of cell flashes per minute was not displayed and clicking on the point had no response.

Tiffany reloaded all of these images and then was able to successfully get a graph of lightning trends. Cell tracking and Alerts with points

-Lynford

Tags: None

AMA is Lighting Up

The excitement at the moment is in the Texas Panhandle. A quick look at one of the cells in Amarillo’s CWA:

AMA lightning jump

(note: this is LBB radar data as we’re not pulling in AMA data at the moment)

The ENI Lightning Jump algorithm shows a 2 sigma jump. The contours are the NOAA/CIMSS highly experimental probability severe, coming it at 47%.

AMA prob svr
It had peaked slightly earlier around 60%.

19Z temp and moisture profiles from JPSS came in just after 20Z. I picked a point sounding in the relatively clear area of the eastern OK Panhandle…

AMA VIS_NUCAPS

And the resulting temp/dewpoint profile:

AMA NUCAPS sounding

Surface based CAPE was 1016 J/kg with an LI of -4C. This is comparable to the approx 1100 J/kg and -5C shown on the GOES-R LAP algorithm in this area at 19Z.

AMA Svr

WFO AMA ended up issuing a severe thunderstorm warning for this storm. Now we wait for verification.

-V. Darkbloom

Tags: None

Lightning Jump Leading Rapid Intensification

With convection largely staying south of the OAX area, have been watching convection in the TOP area. Saw a really good use of the Lightning Jump Detection Algorithm showing a rapid increase in lighting with the cell in northeast Kansas. At 1941Z, the cell was fairly weak with modest lightning.

20150504_1941Z_OAXRadar_LightningJumprobSevere

As the initial cell weakened and a second cell developed to the east the lightning diminished and then rapidly increased at 1951Z producing a significant lightning jump (6 sigma).

20150504_1951Z_OAXRadar_LightningJumpProbSevere

The ProbSevere product was trailing at this time due to the rapid increase (<5%), but within 15 minutes it rapidly increased to over 90% at 2005Z.

20150504_2005Z_OAXRadar_LightningJumpProbSevere

While I wasn’t looking closely at the radar data while producing a previous blog post, that rapid increase shown in the lightning jump algorithm really caught my attention and showed me that it was something to checkout. -SRF

Tags: None