


Each polygon is labeled with the end time on the downstream right vertex. No units on this. Consider adding Z. 
-Lynford
Official websites use .gov
A
.gov website belongs to an official government
organization in the United States.
Secure .gov websites use HTTPS
A
lock (
) or https:// means you’ve safely connected to
the .gov website. Share sensitive information only on official,
secure websites.

Each polygon is labeled with the end time on the downstream right vertex. No units on this. Consider adding Z.
-Lynford
To tie in with a previous post of overlaying two image products (and adjusting the transparency), I tried that out with the OAX radar and the Lightning Jump product.
On its own, the color table for the lightning jump makes the jumps stand out really well but unfortunately it covers up the radar data.

By adjusting the transparency (70% on Lightning Jump), I found the combined use of the two products to be much more useful.

Unfortunately with the colors in the current table, they become washed out at time with the greens and yellows. While it isn’t as big of an issue with smaller cells (first image below), but when the convection is more widespread (bottom image from west Texas) it makes it harder to see with the colortable.


-SRF
Well, the first post of day 1 and I have to admit I feel a bit overwhelmed with the amount of information and data to look at as we are supposed to look at all the available experimental products as we assess the environment for the day and also build procedures for the rest of the week. I think I will feel a bit more comfortable when we are focused a bit more and looking at specific products within the warning operations environment.

Initial look at the big picture shows a deep trough over the desert southwest with somewhat diffluent flow across the southern plains with downstream ridging over the Mississippi Valley.

A surface frontal boundary was noted across north central KS with possible weak low lifting northeastward through southeast NE. Some weak convergence resulting in developing convection across northeast KS as of 19z. Best instability at 19z based on the GOES-R LAP algorithm was centered over western OK into southern KS and expanding into the southern part of Topeka’s Forecast Area, which seemed reasonable when compared to the RAP13 analysis at 19z. There has been little if any lightning in the convection over northeast KS to this point so have not evaluated the lightning data too much.

An initial look at the convection initiation algorithm off the GOES-R over northeast KS did not reveal much with generally less than 20 % initiation values leading up to the convection that has developed. There is a fairly dense layer of cirrus overhead which is likely obscuring the ability of the GOES-R to detect and leading to the low percentages, which is a limiting factor of this product.
Jack Bauer
Being a person that likes overlaying multiple images, I found overlaying the Visible Satellite with the GOES-R LAP CAPE product (transparency of 50%) to be useful in situational awareness. Putting the data into a loop provided an easy way to view the increasing instability over eastern Kansas under clear skies and where dewpoints were rising from the upper 50s to the lower 60s. -SRF Note: It looks like you need to click on the image to see the loop.

Was hoping to use the Convective Initiation (CI) product closer to the area in eastern Kansas, but unfortunately cirrus in the area limited the ability to use the product. The first image below (1730Z Visible Satellite) indicates the product was trying to indicate convection development, but then cirrus really started to contaminate the area and led to no highlights as the convection started to develop (middle image at 1830Z). The bottom image (1900Z) shows more mature convection on visible satellite. -SRF


Comparing CI at 1900z with 1930z radar. Looking at north central Eddy County, south-east Dawson County and south-west Borden County. So far so apparent correlation. 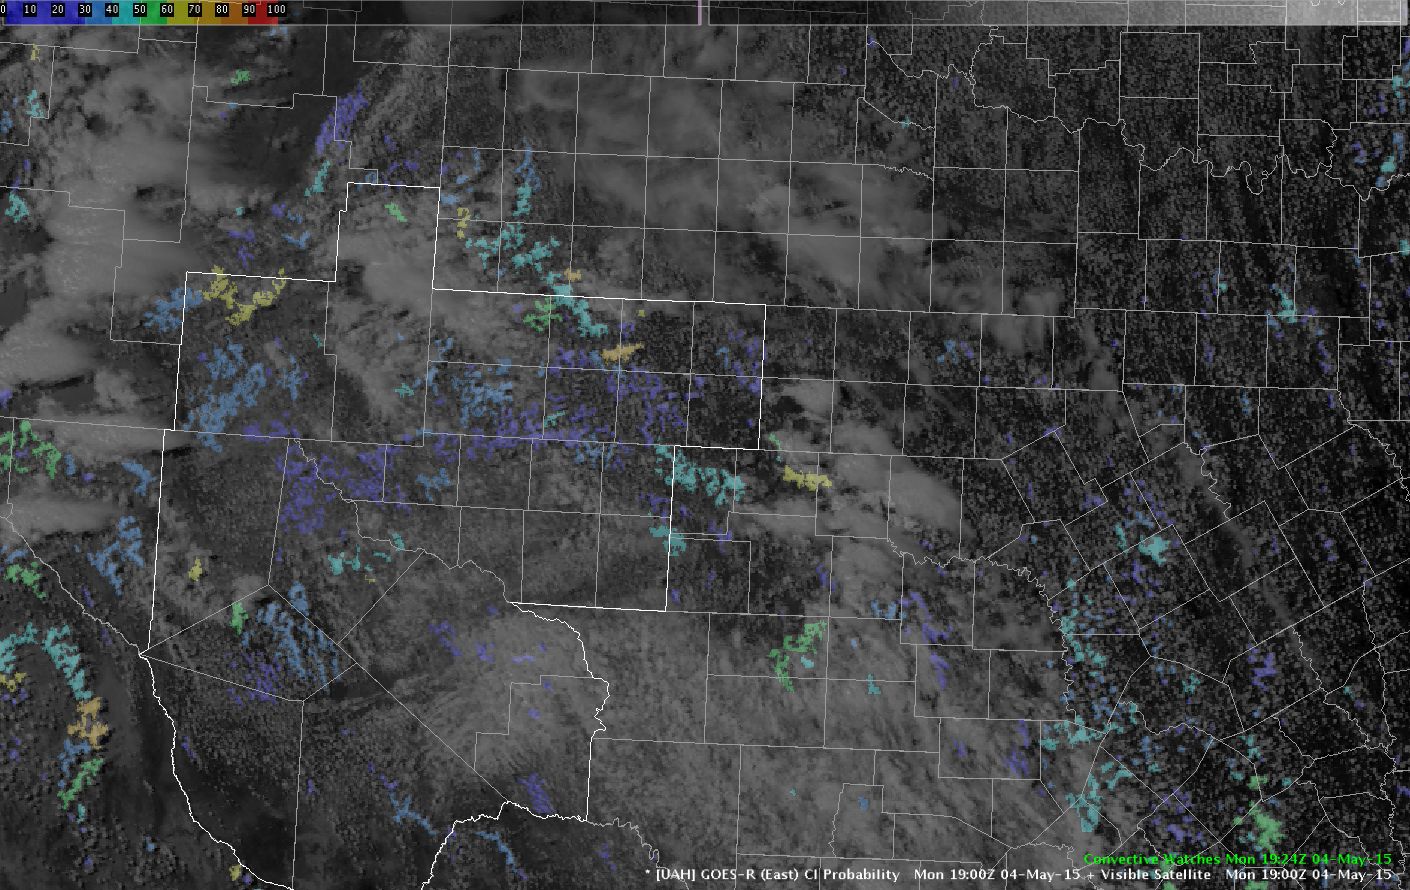
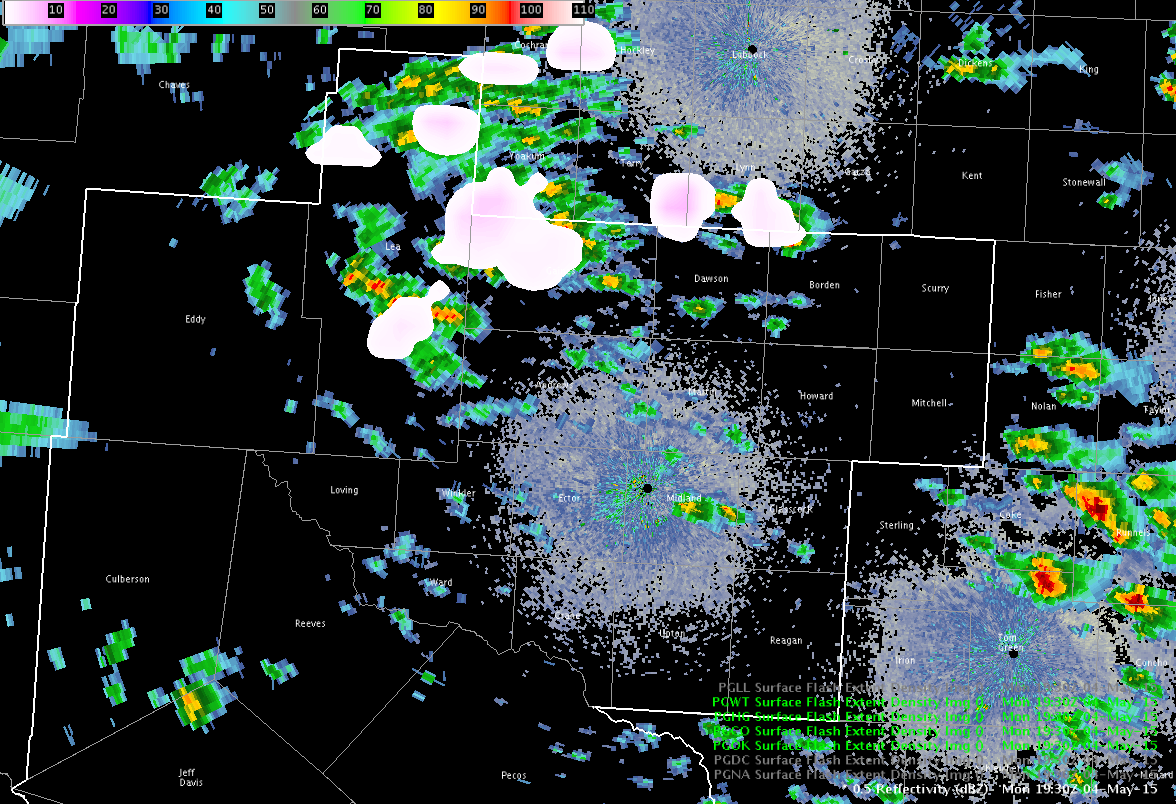
-Lynford
As always, the first order of business when you’re working at a new office or AWIPS system – build build build! Currently working on procedures and my personal favorite, custom color tables. If I was thinking ahead I would’ve brought some from home.
One of the color tables I always change: CAPE. The default “gridded data” color table that AWIPS loves so much just doesn’t fit well.
Before: 
That magenta really stands out, as if I really care about areas of zero CAPE.
After:

Much better! I did something similar for the Lifted Index: making everything above about 2C transparent.
Now back to the real fun: convection blowing up in my CWA Du Jour (Midland, TX) and clearing AlertViz banner after AlertViz banner.
-V. Darkbloom
After taking 20+ plus minutes looking through all of the data, I found several useful products but unfortunately there is limited uses in my area (OAX). Thus far, mainly seeing rain across the region with some thunderstorms starting to develop to the south in eastern Kansas.

-SRF
A quick glance at the surface obs and SPC mesoanlyses indicates a weak boundary located across the Topeka CWA, stretching WSW to ENE.

GOES-R layer CAPE indicates the sharp instability gradient across the CWA with CAPE near 1300 J/KG for southeastern counties (Coffey/Anderson/Franklin) with a few hundredths of CAPE for the northwestern counties where weak showers/thunderstorms pushed through the area earlier today. Convective Initiation suggests low probability of formation moving into the south-central portions.

KTWX radar indicates weak convection across Dickinson county with minimal lightning activity (less than 5-7 flashes/min and 1-2 CGs over the past 30 mins). These storms have greater potential for future development as they move east towards greater instability as noted in the GOES-R products.
Brick Tamland
My first ever blog. Figures…it’s about wx.
The Surface parcel Lifted Index is in Kelvin. Please change the units to Dec C!