ENI Display

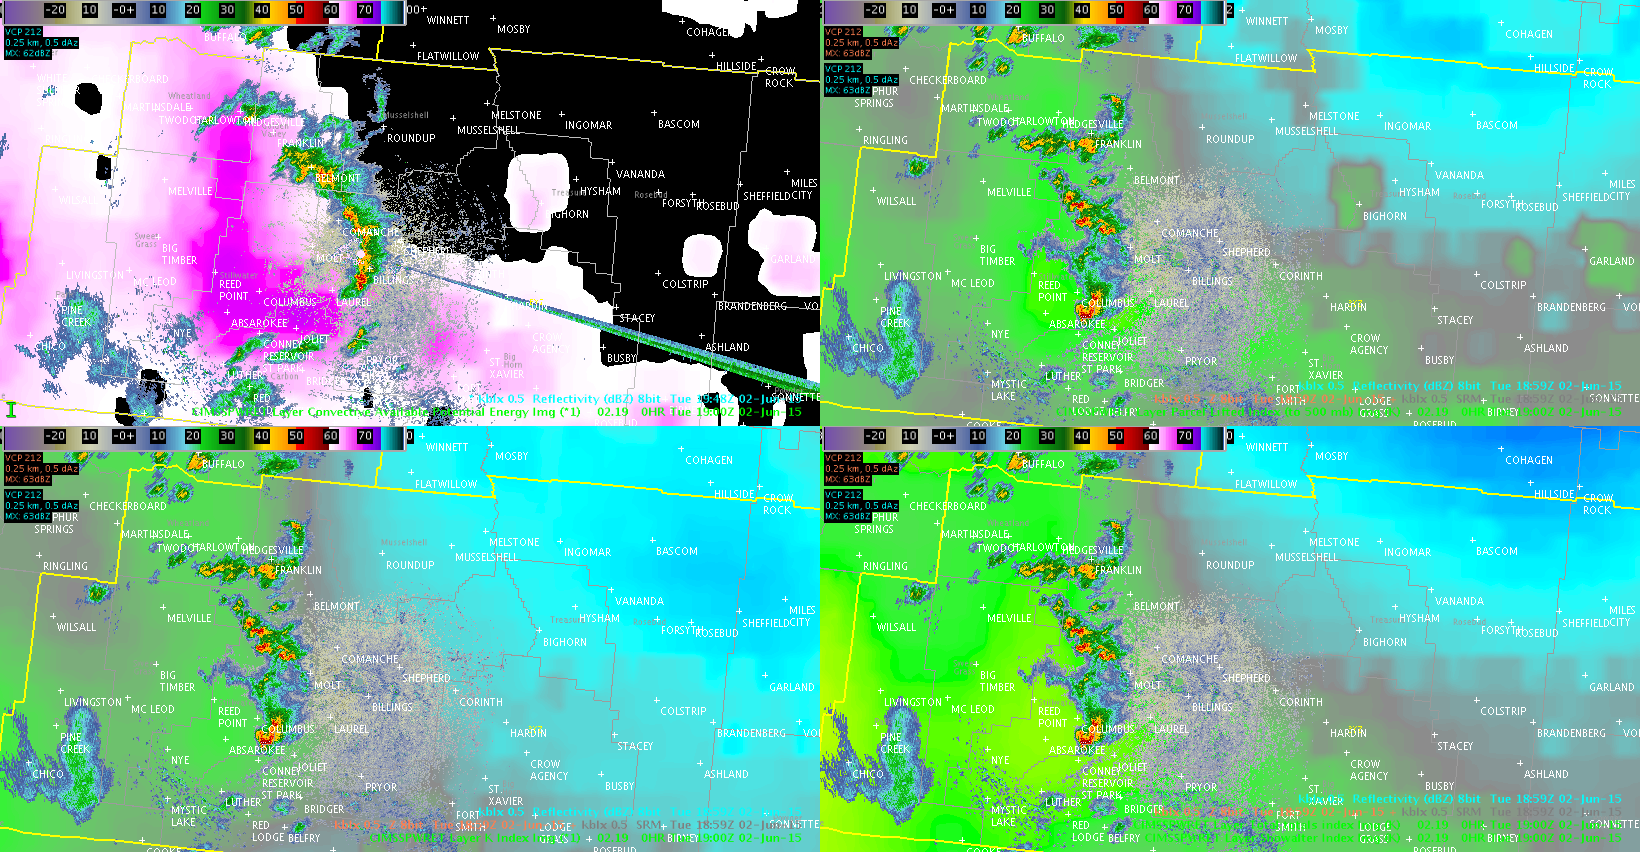
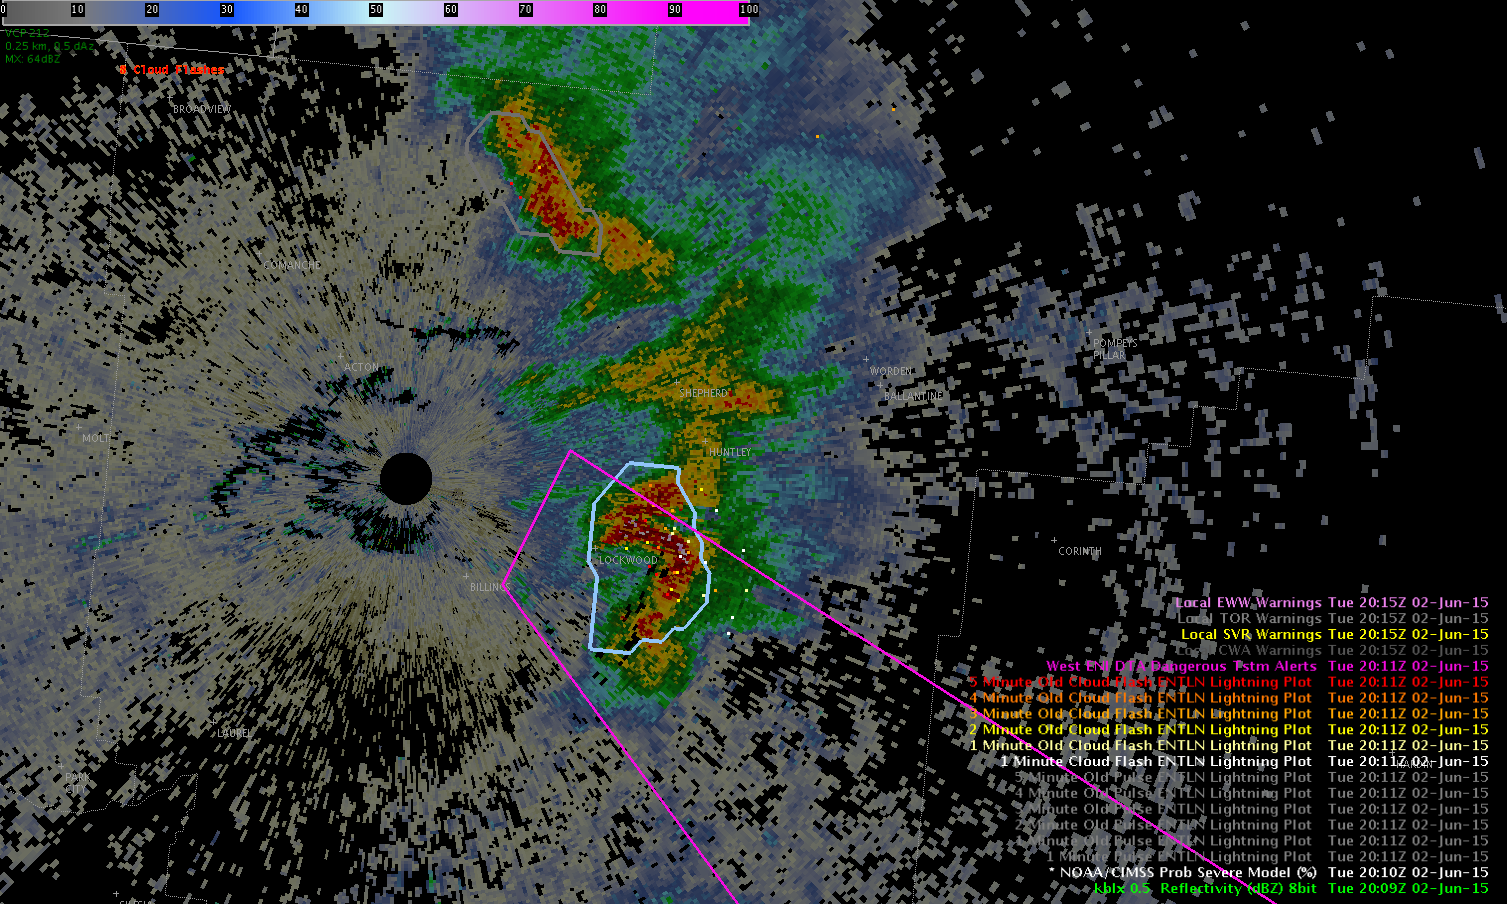
My 2 cents on the ENI AWIPS display. I found the data available via ENI was too overwhelming along with a cluttered display. The list on the right shows all the options available to look at and it becomes too much to ingest. I suppose with training and experience it may be a little more intuitive but not initially. Polygons shift direction rapidly with different storm directions, there is a listing for each DTA rate, a polygon for each cell along with flash rates for the cells. Add in the different obs plots for pulse, flash, cloud to ground. It gets very confusing. Granted this is new, but many off our staff also found this confusing when we recently had it installed with our AWIPS2 build. When information becomes too cluttered and confused it tends to get disregarded and not used in Ops.  Consolidation of the DTA Rates into one item with changing colors would be beneficial, same as with the alerts.  I think the cloud flashes are better represented as circles and not dots as it is shown on this workstation.

–Cattywampus. ENI_Plot

Tags: None

Low CI verifies

CI_2000z CI_2036z

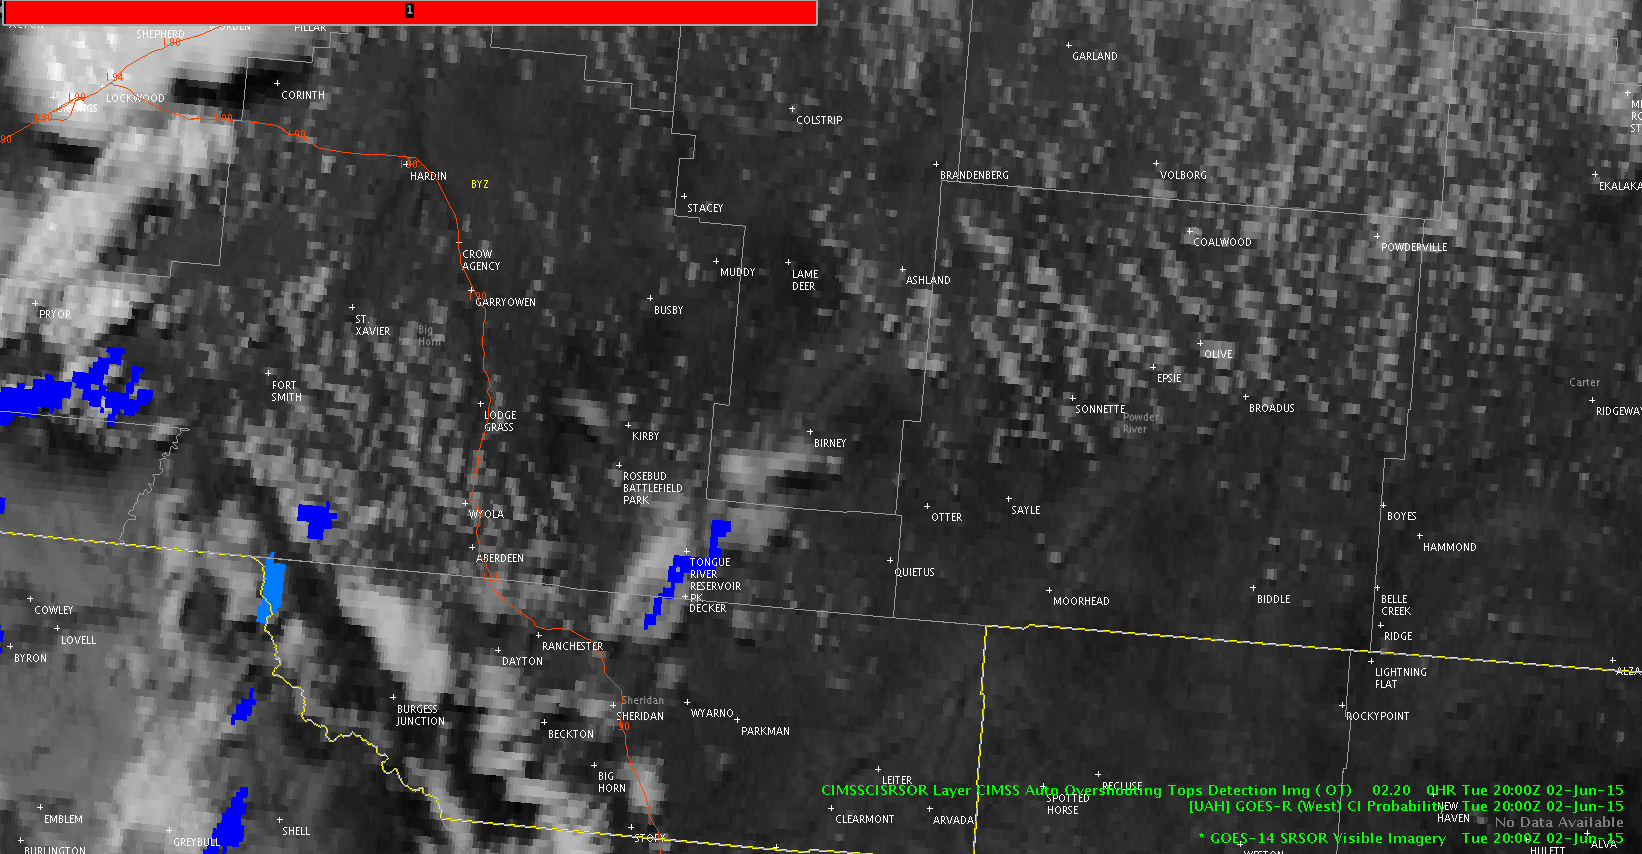
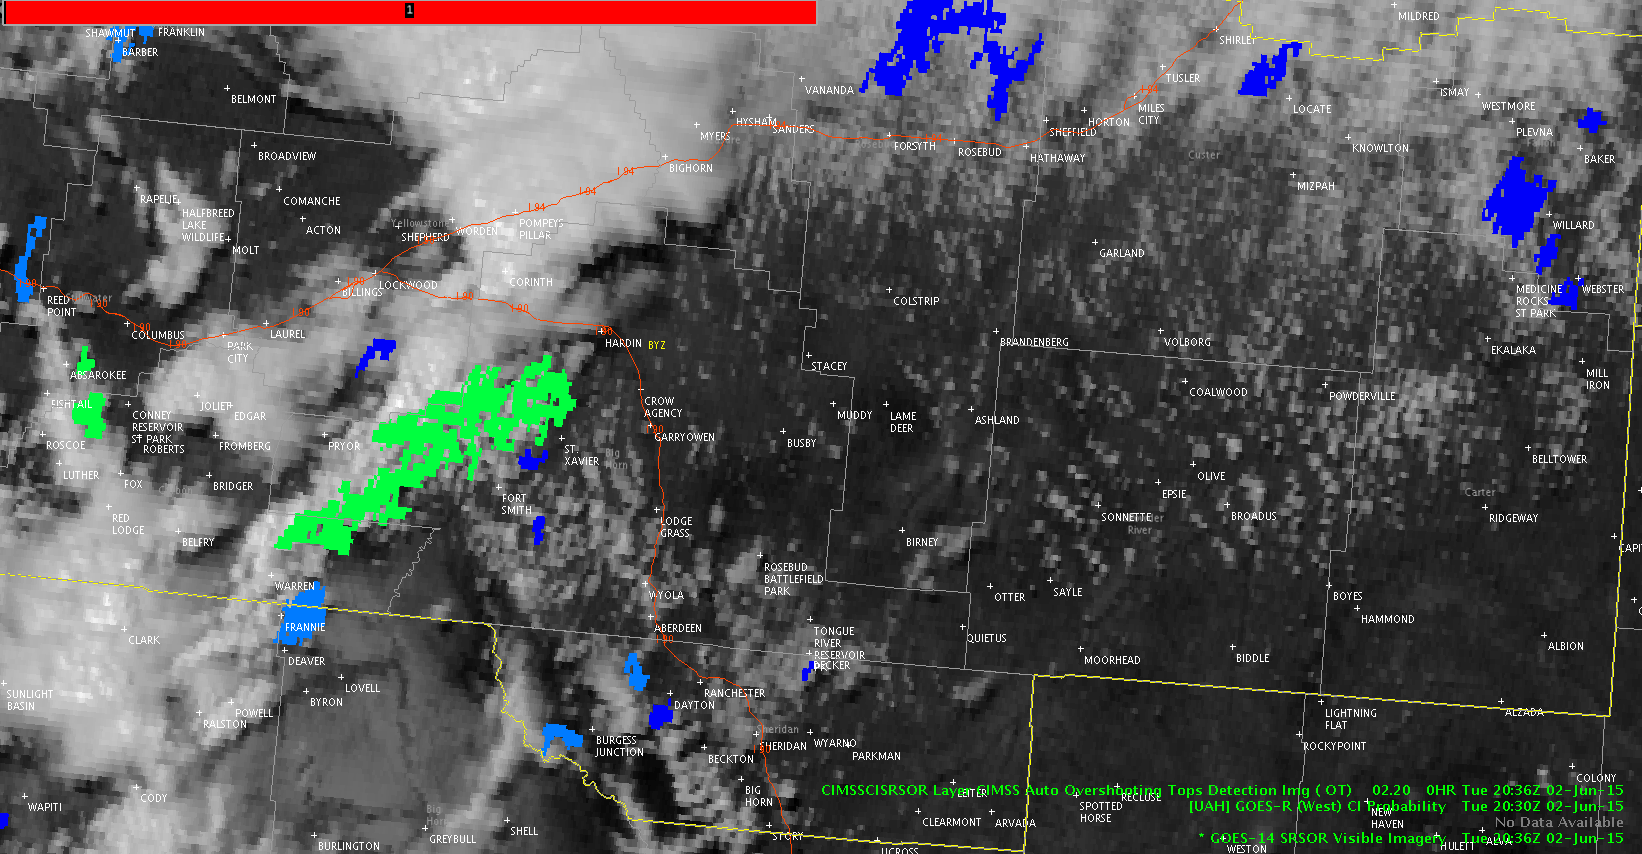
What looked visually like a potential source of a future storm in the south-central BYZ CWA was pegged by CI at 17% at 2000z. It never went on to develop and totally lost a CI value by 2036z.

There are increasing values of CI to the west, however, where LAP also indicates higher instability.

Jason Williams

Tags: None

Radar evolution compared to LAP in Montana

LAPS1_1810z LAPS_1850z LAPS_1948z LAPS_2015z

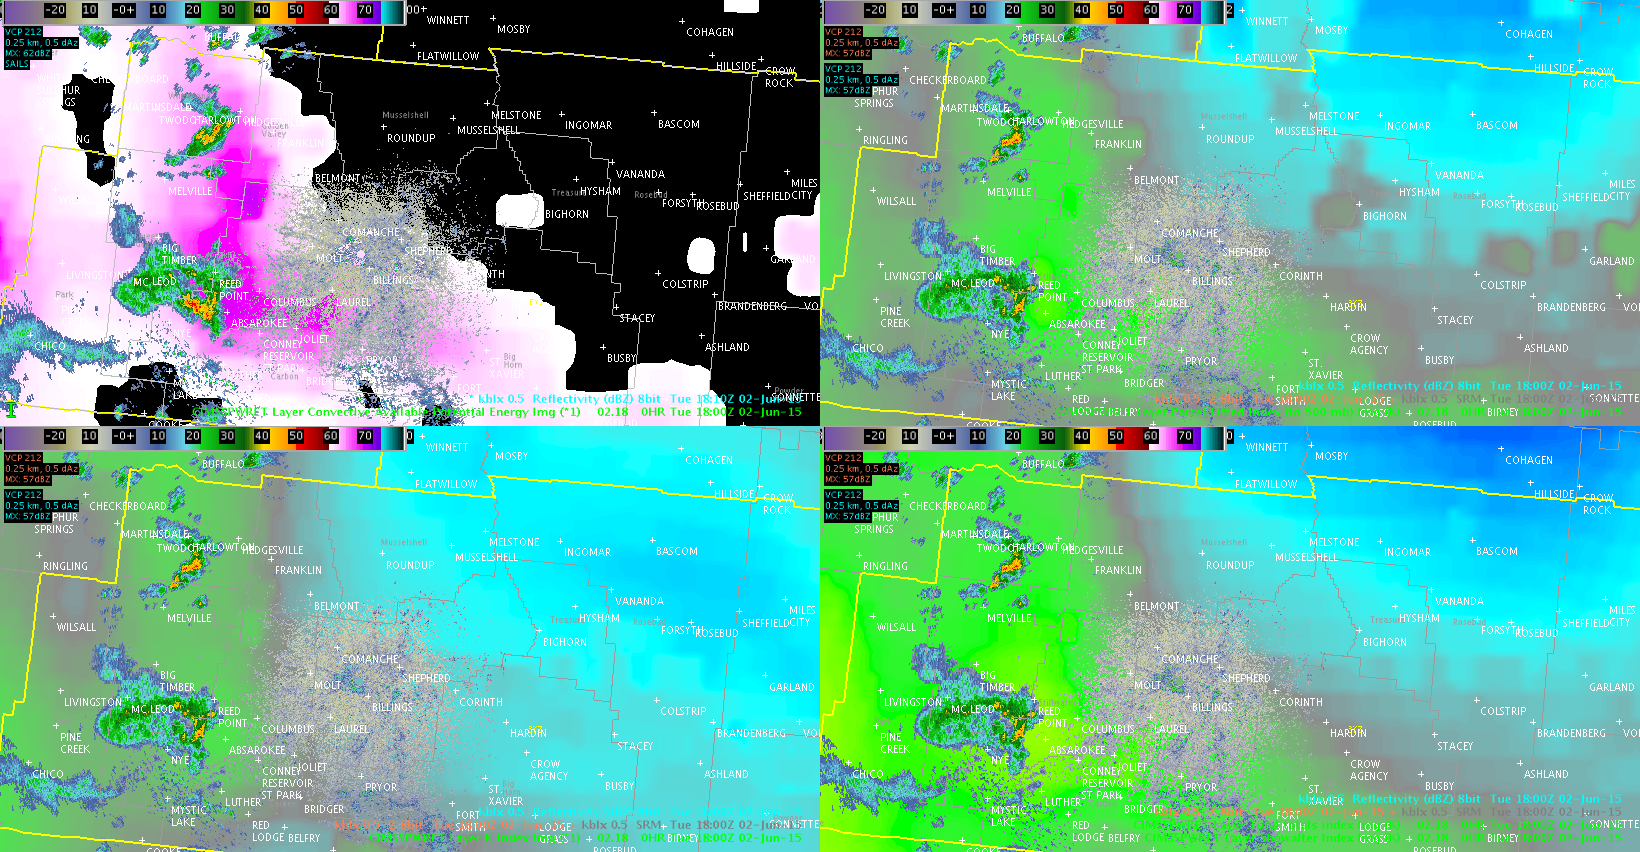
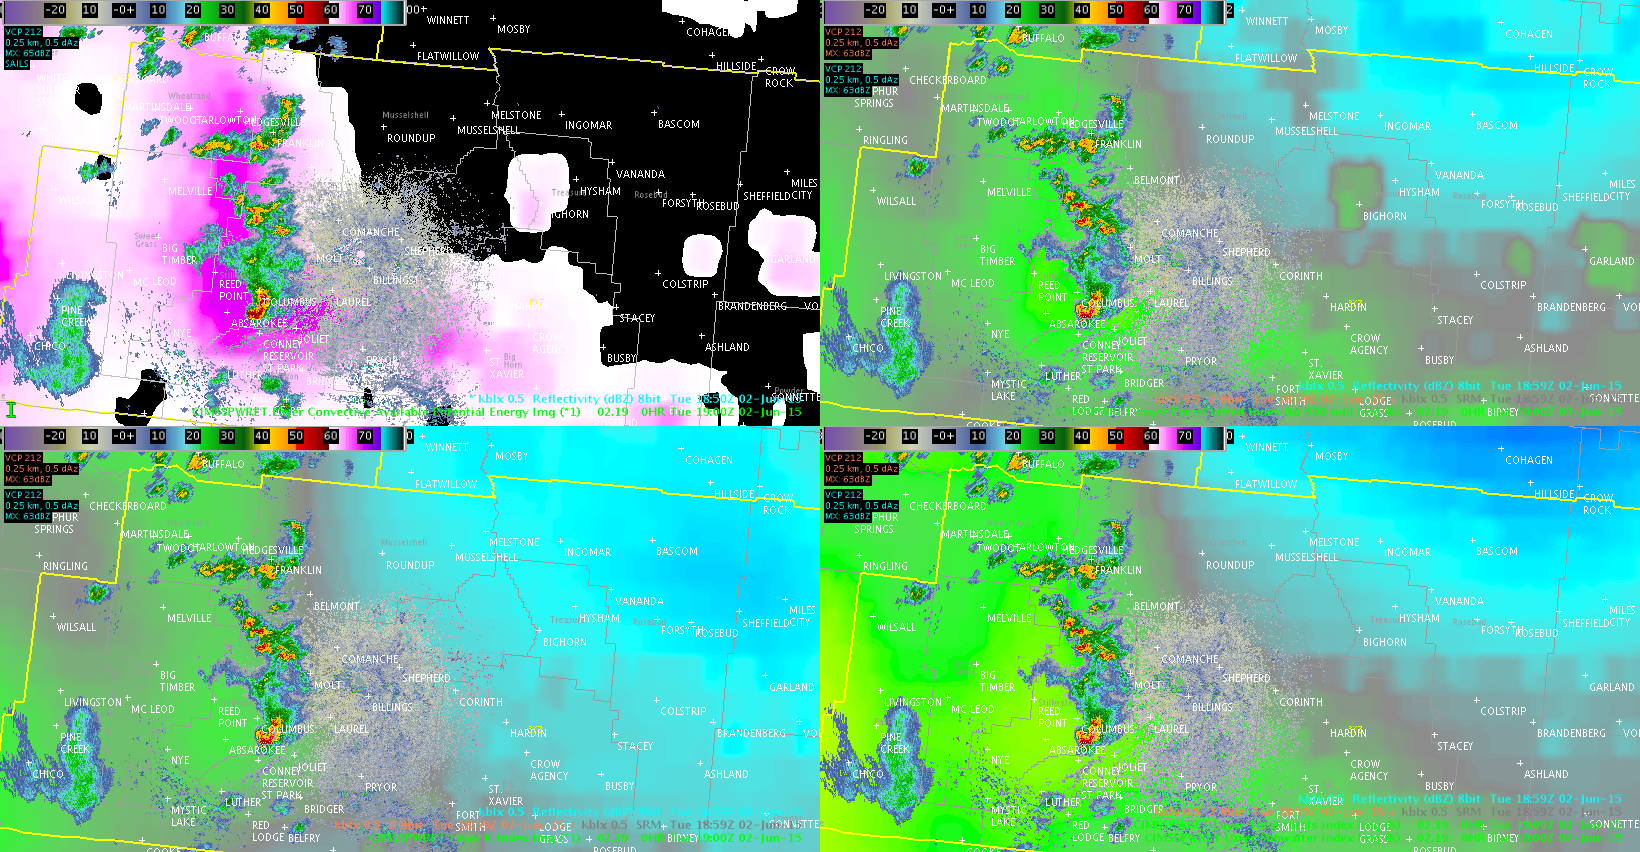
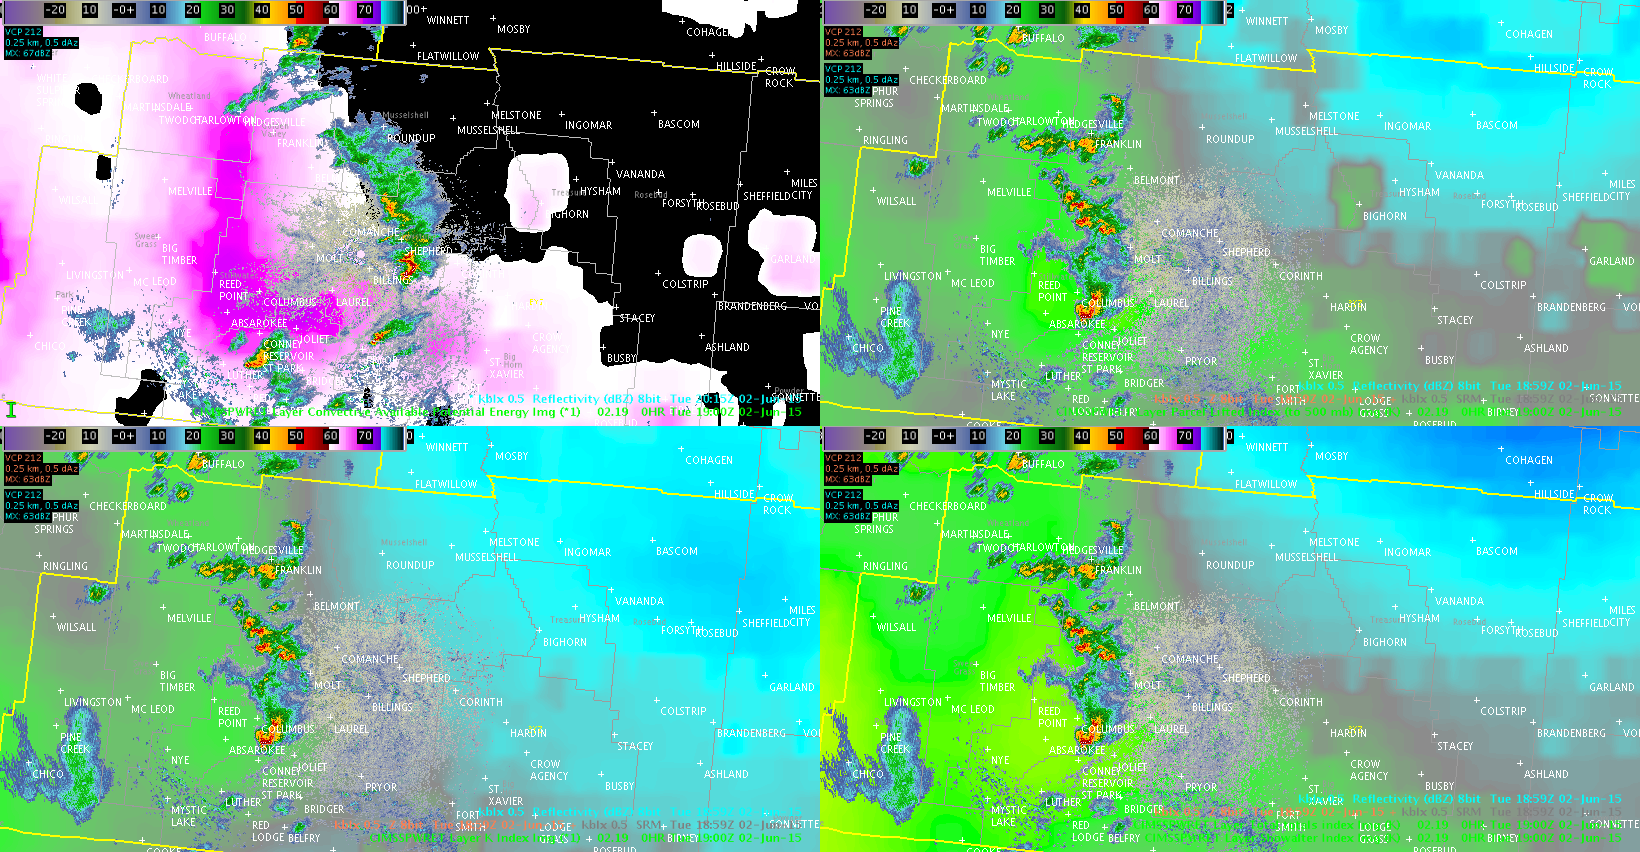
The four images show the progression of the storm cluster in the BYZ CWA in relation to the GOES LAP CAPE (upper-left panel). The storms appear to have intensification as they move NE; while one could look at the better proximity to the radar for this, the increase in lightning would suggest that there was indeed intensification (see previous post on lightning rate).

The northern end of the line has become stratiform and has been completely without lightning since 2011z; the southern cell started losing lightning at about that time and has since had very little (if any) on the one-minute ENTLN data. The ENI DTA went away at 2023z and no alert boxes have been present since then.

It appears the LAP CAPE product performed well in relation to how the storms evolved as they moved NE.

Jason Williams


Tags: None

CI and outflow boundaries

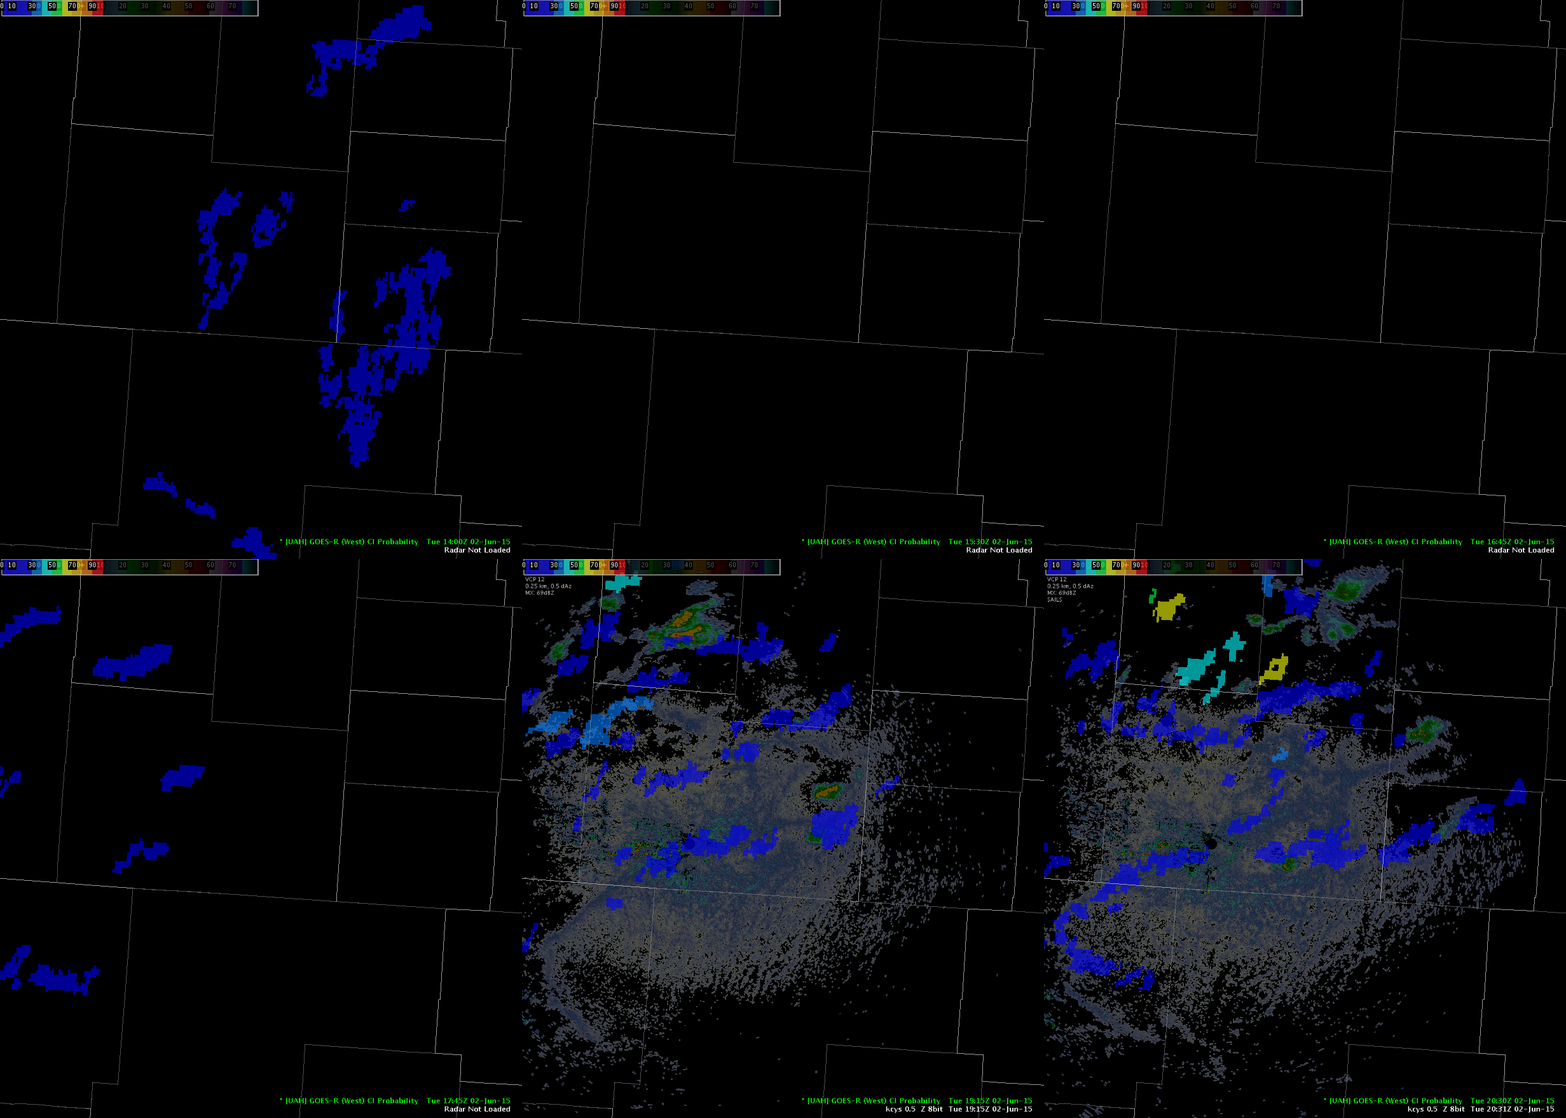
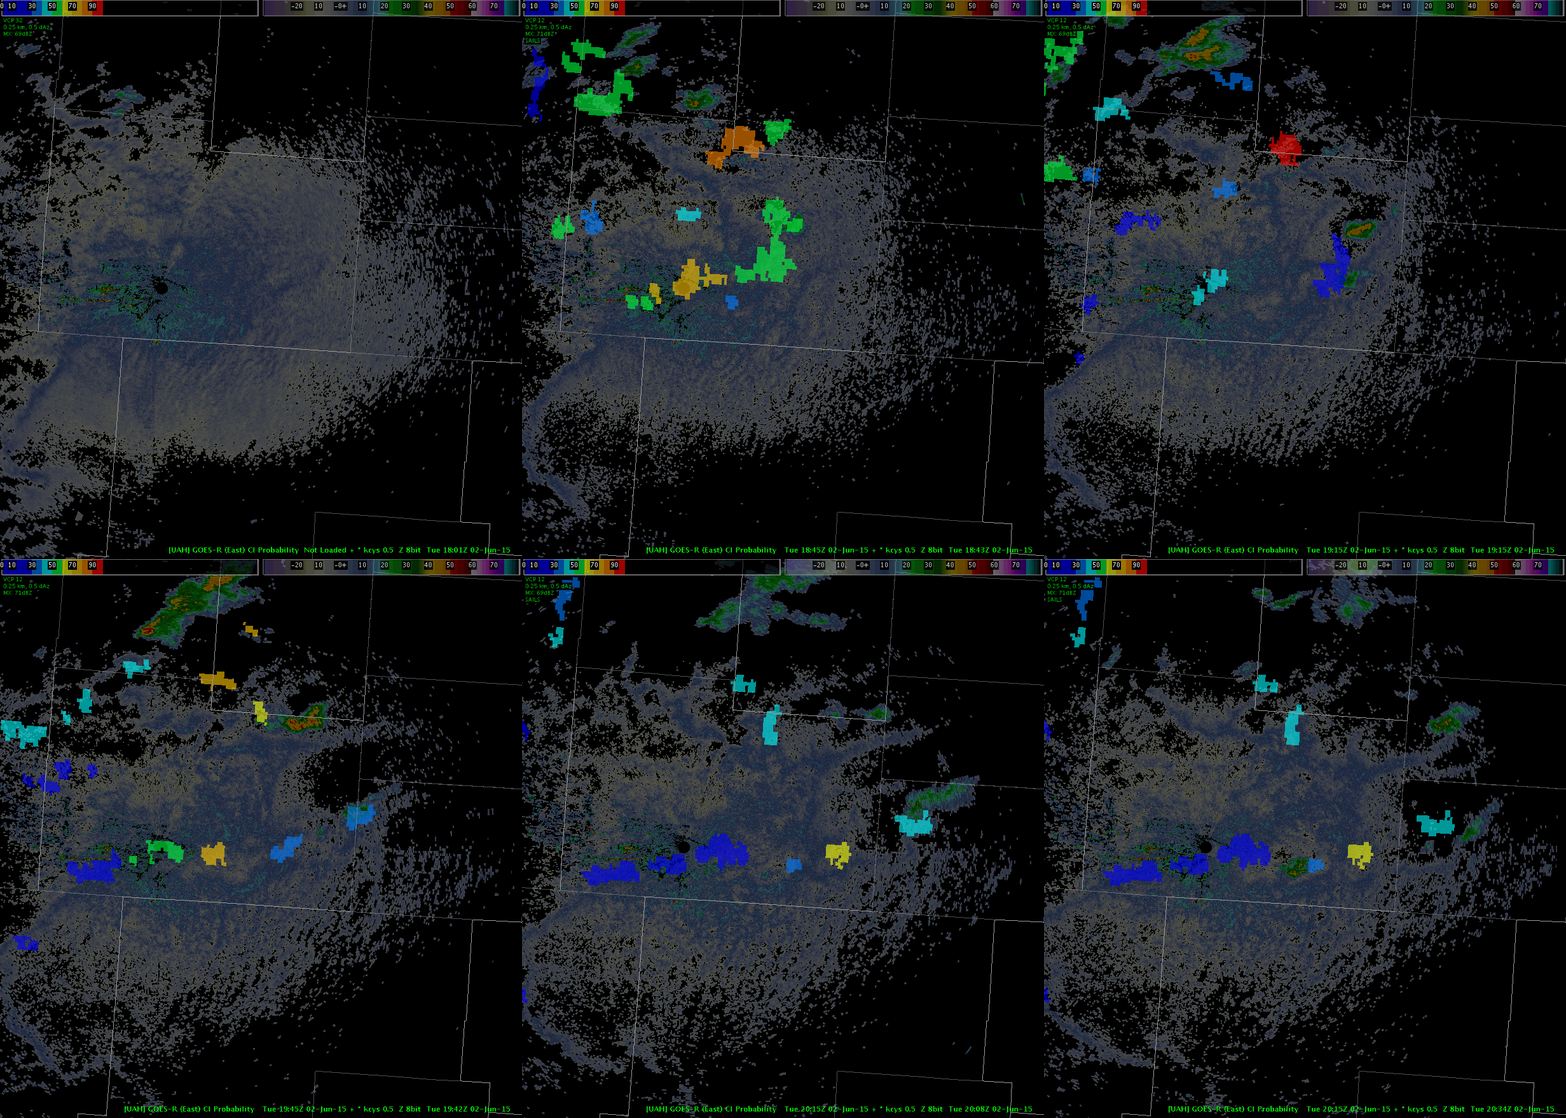
Noticed how the CI was pegging on the outflow boundaries.  Decided to overlay the radar and CI.  This image shows how the CI and outflow boundaries are marked out well.  Noticed that it did a good job picking up these boundaries, but did not do well with actual CI from boundaries interactions.  This was GOES-West…in SE WY.

screenCapture4

Now using GOES-East, it did an excellent job.

screenCapture3

MacGyver

Tags: None

ENI DTA tracks right mover emerging from linear complex

dta_box


A dominant cell along the southern edge of a line of storms emerged from the complex.  ENI DTA projected further southeast movement with the developing cell as the cell centroid moved right of the environmental flow. DTA level 3 (Dangerous) was shown due to the total lightning threshold being sustained.

John Pendergrast

Tags: None

ENI Alerts Used in Warning Decision

The ENI thunderstorm alerts drew my attention to a storm in the western part of the Bismarck CWA. I first got the ENI DTA Thunderstorm alert, then about 15 minutes later it had increased to the Significant Thunderstorm Alert and about 6 minutes after that, the Dangerous Thunderstorm alert. I also had the prob severe overlaid with the alerts and noticed that it was gradually increasing. This increased my confidence that the storm was strengthening and that a severe thunderstorm warning was needed. I issued the severe just after I got the dangerous thunderstorm alert. At that time, the severe prob was at 74%, but knowing the strengthening trend, I felt that I could get more lead time if I went ahead and issued the warning even though severe prob hadn’t yet reached the 80% threshold. The storm has not verified yet.

(Please click on the image below to see the animation)

svr

-Helen Hunt

Tags: None

Bismarck, ND: 1955Z TOR Issued

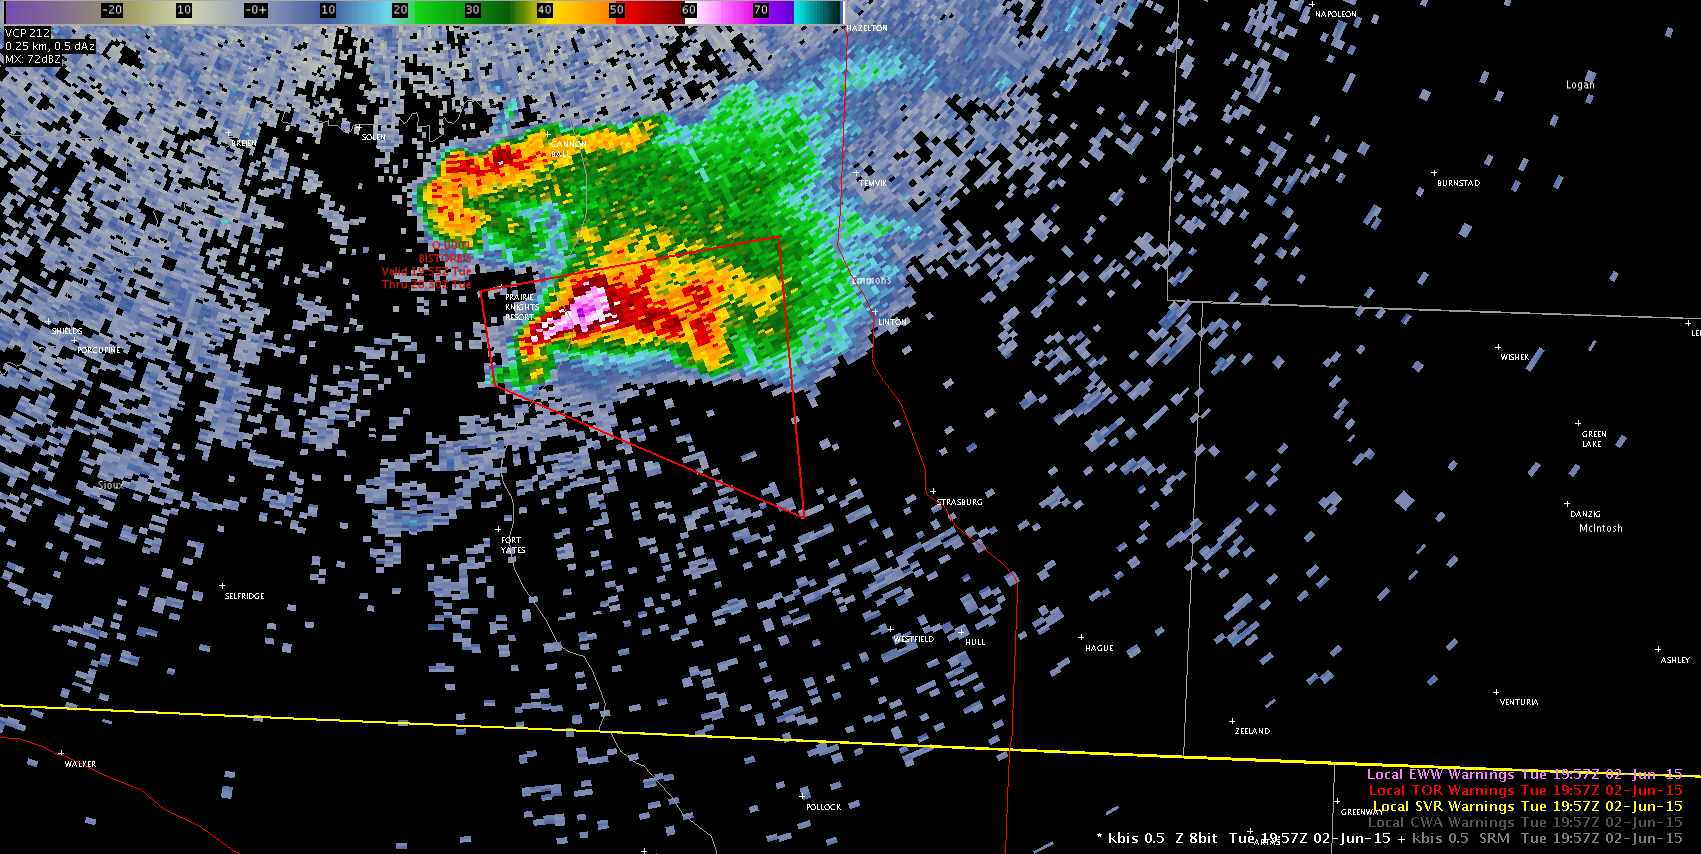
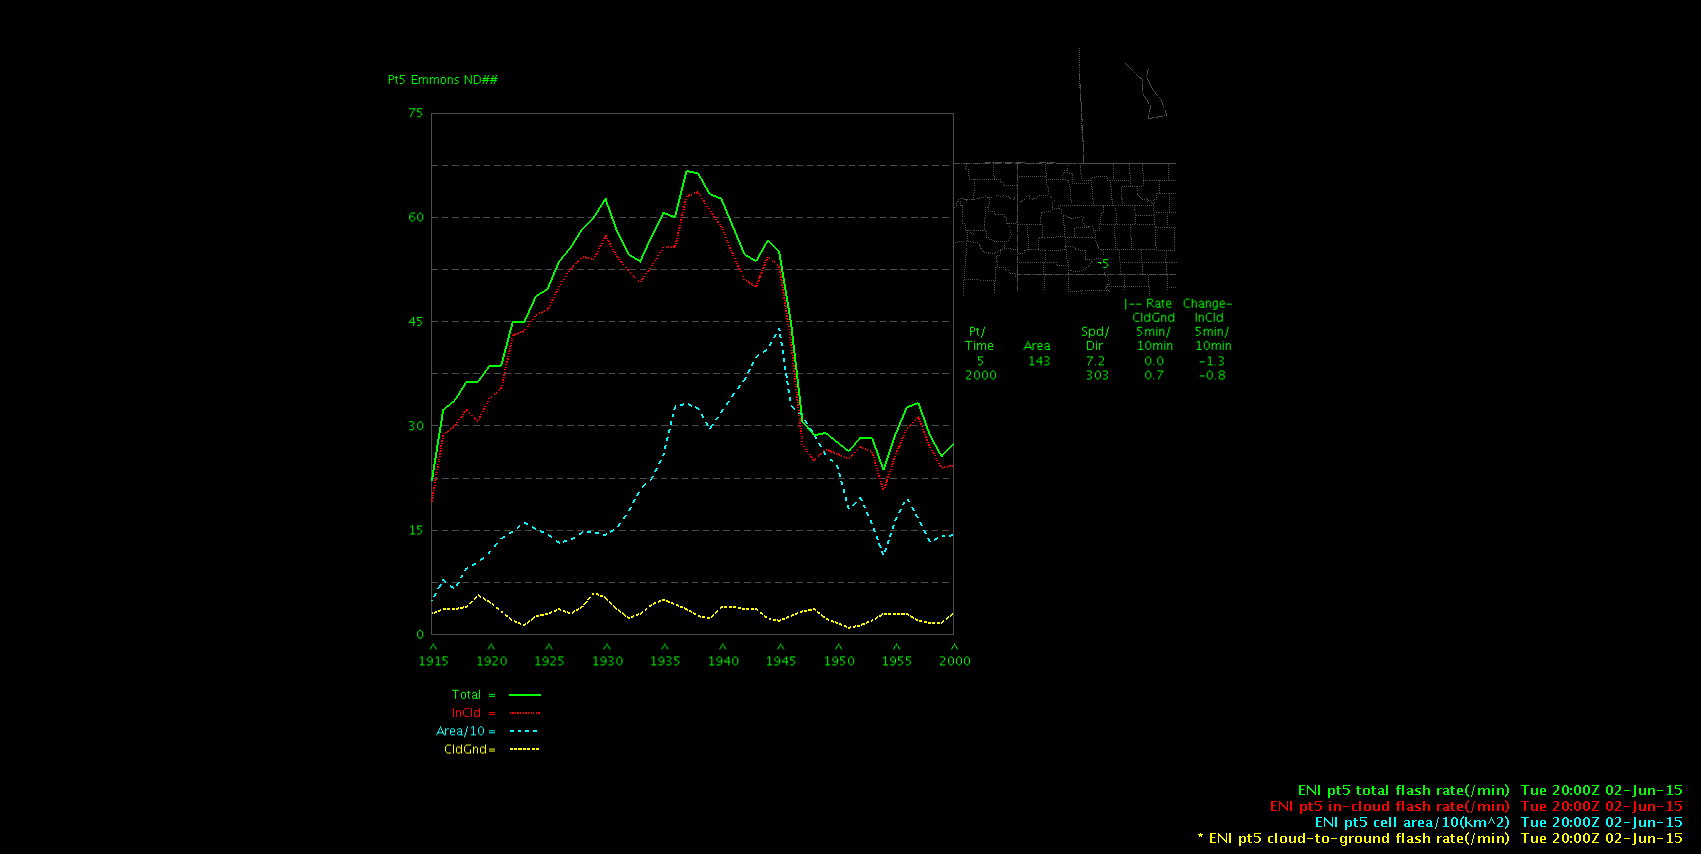
A cell over far eastern Sioux County demonstrated rapid growth and a split in which the southern cell developed into a super cell (fig 1).  The split occurred around 1940Z which marked roughly the end in the increasing trend of flash-rate which showed a marked increase around 1915Z (fig 2). The flash rate served as SA for cell strengthening, the TOR was issued based on the development of a mid-level mesocyclone and a trend in increasing low-level velocity couplet at 0.5 degrees.

TOR_radar

Fig 1: Spit with subsequent supercell formation at 1957Z.

TOR_total_flashRate

Fig 2: Increasing flash rate between 1915-1940Z. Splitting cell occurred around 1940Z.

Tags: None

ENI lightning plot

d2_eni_4panel_1954

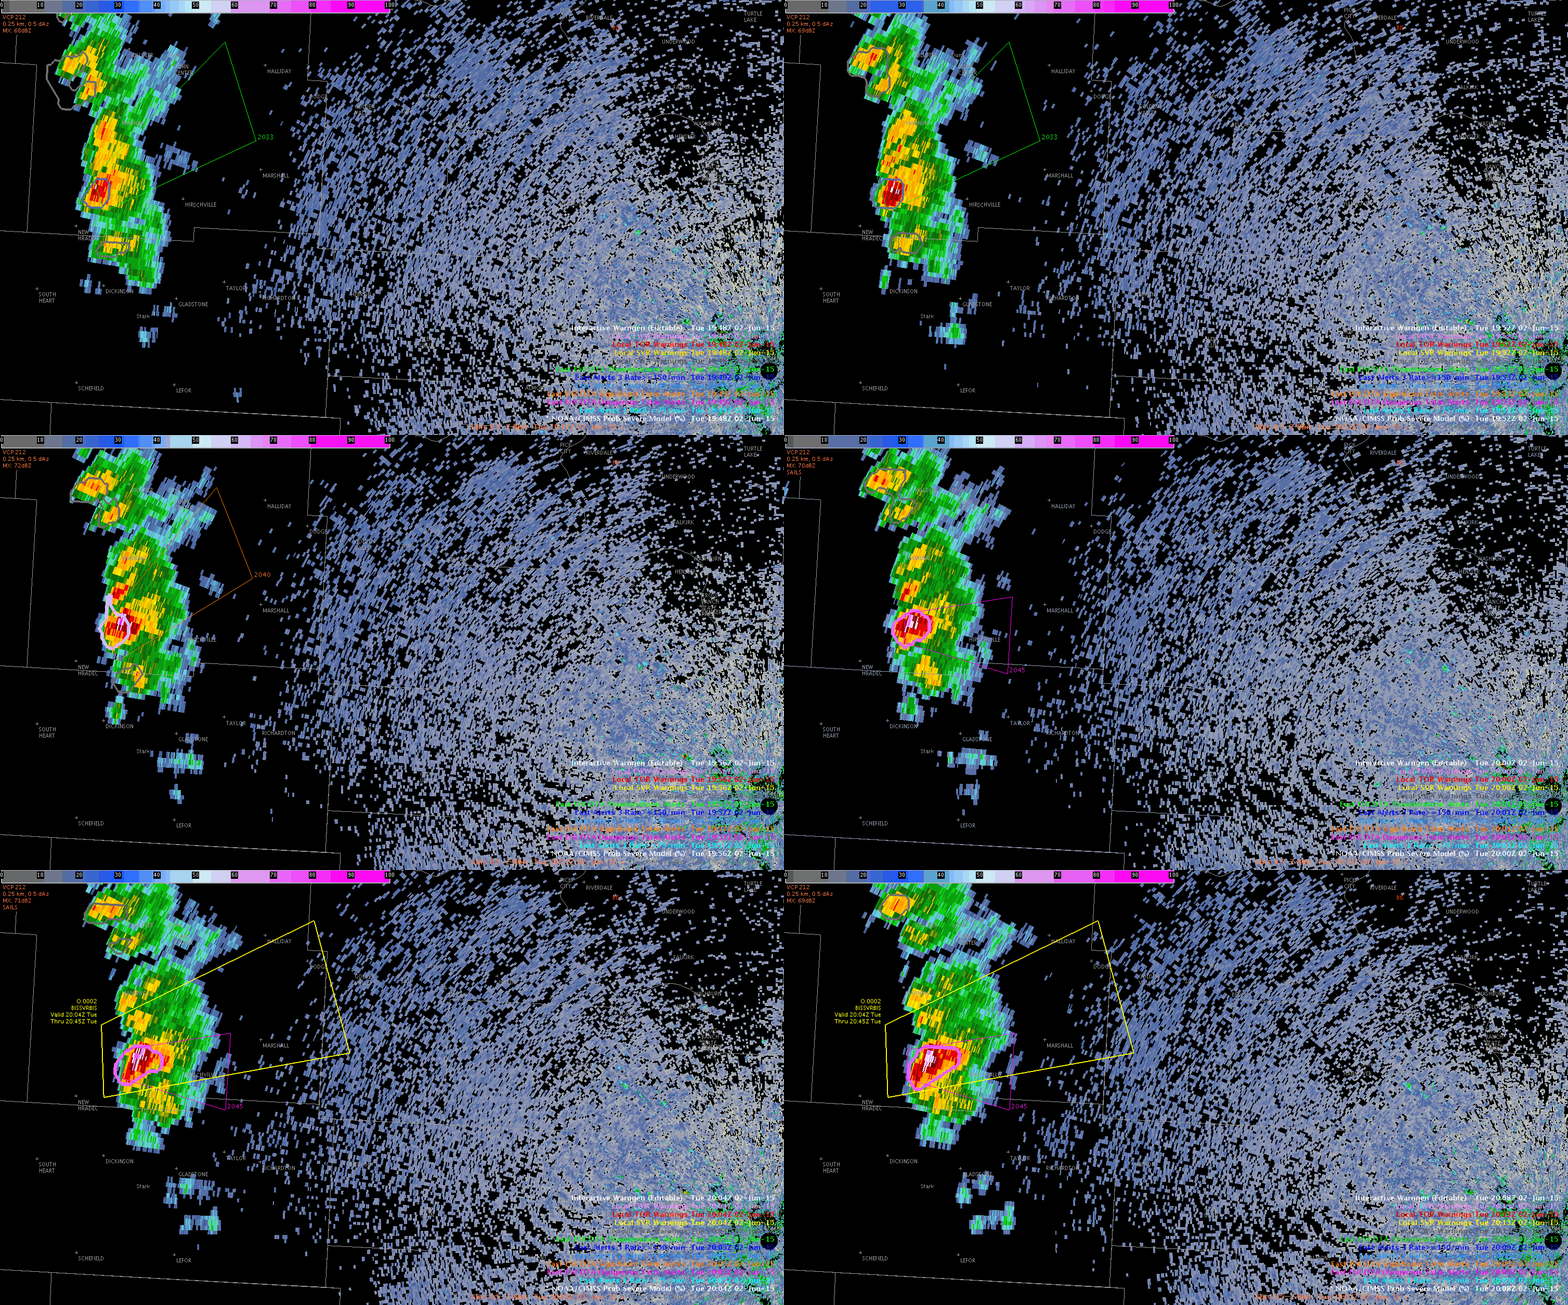
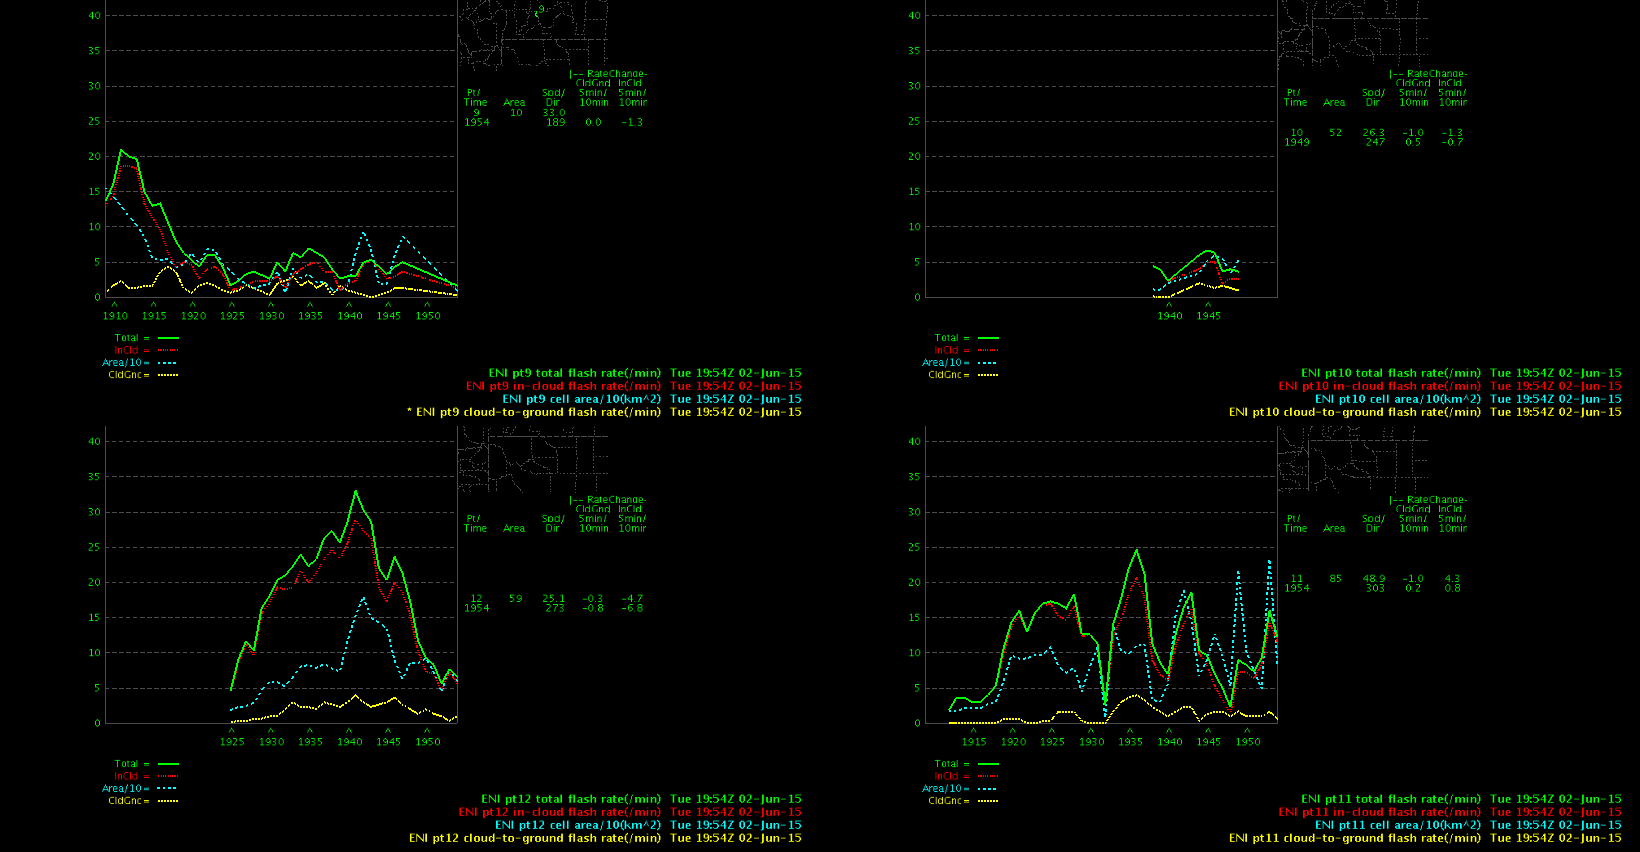
There were four ENI cells moving into the BYZ area, so I did a timeseries on each. The lower-left panel, #12, was on the southern part of the storm cluster. It went on to produce dime-sized hail at 1947z, while the northern parts of the cluster did not have any LSRs (as of 2000z).

The flash rate of this southern storm really increased, peaking at about 1940z.

One thing that I’m not sure about is whether the large drop in lightning rate was real or if it was because I had neglected to move Point #12 in the AWIPS display as the storm continued to move east. I did move it, but the lightning rate didn’t pick back up noticeably. I wonder if, in warnings operation, the meteorologist may forget to move the point(s) and get a false idea of lightning rates. It would be incredibly helpful if, when a point is placed in an ENI polygon, that it would recognize that and continue to move with the polygon (weighted to the center of the polygon?) as long as that polygon existed.

Jason Williams

Tags: None

SSRO and boundaries

The one minute data, by far, has been extremely useful.  The data has lead me to find small boundaries, like in this GIF.  It also has lead me to think outside of the box and find fine mesoscale features like small jets that will help strengthen and initiate convection. screenCapture


MacGyver

Tags: None

June 2 — Timing from Flash Density to CG Ltng (CYS CWA)

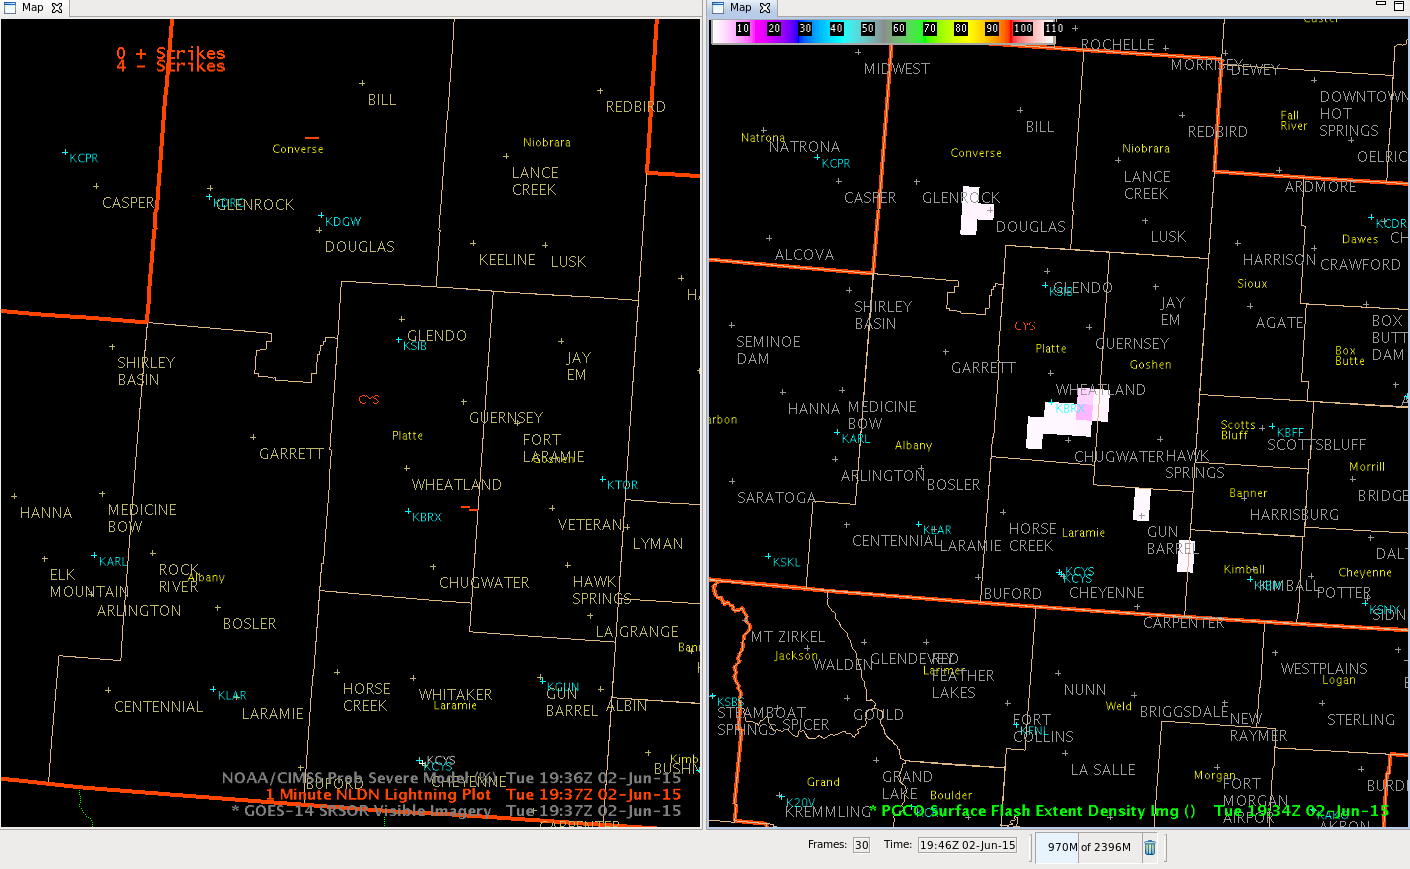
While monitoring the 1-minute satellite and NLDN data, noted that the Surface Flash Density product begins to show in increase in in-cloud density about 2-3 minutes before noting CG lightning strikes.  Check out the comparison on Figure 1.

LtngStrike_FlashDensity_Compare_2Jun15_1937ZFig 1.  NLDN Lightning Plot at 1937 UTC (L) and Surface Flash Density at 1934 UTC (R)

This appears to give a short fused indicator of CG strikes close to the flash density areas, especially as they increase. Expect to see increasing flash densities and CG lightning as the boundary moves NE through this afternoon.

CoonieCatEye

“Surface Flash Density” here refers to the Pseudo Geostationary Lightning Mapper (PGLM) Flash Extend Density product, which is showing Total Lightning (IC and CG) information from Lightning Mapping Arrays processed to an 8 km grid, similar to what we will see from the GOES-R GLM. – BL

Tags: None