More Observations of AzShear

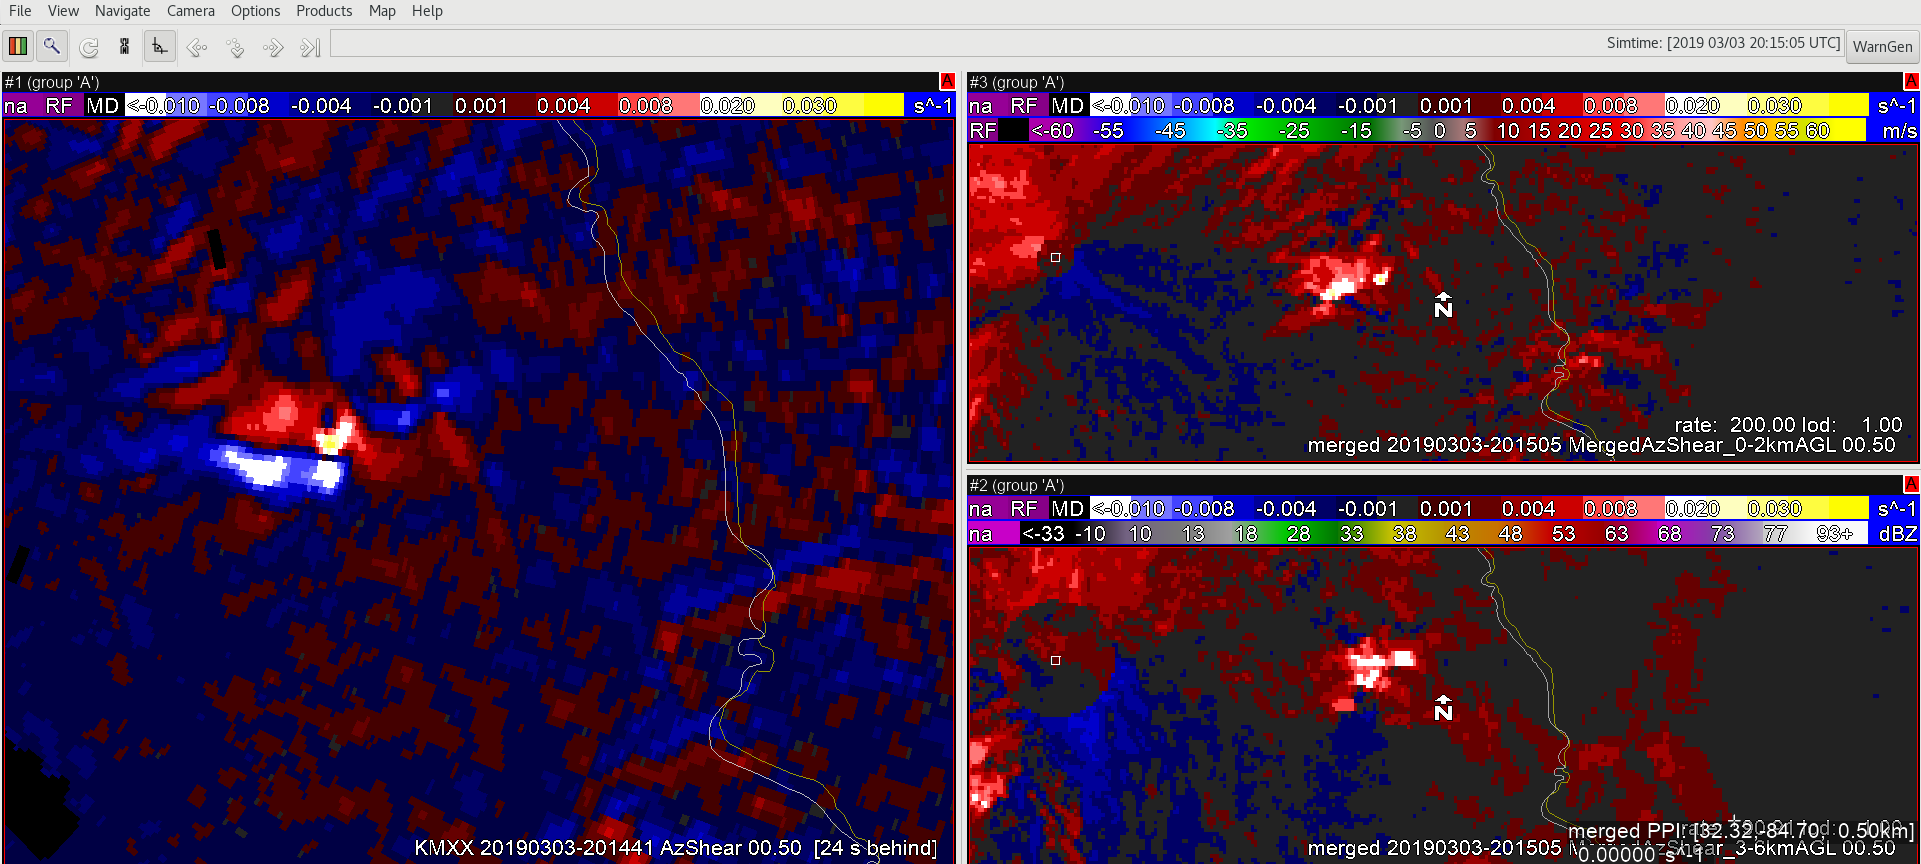
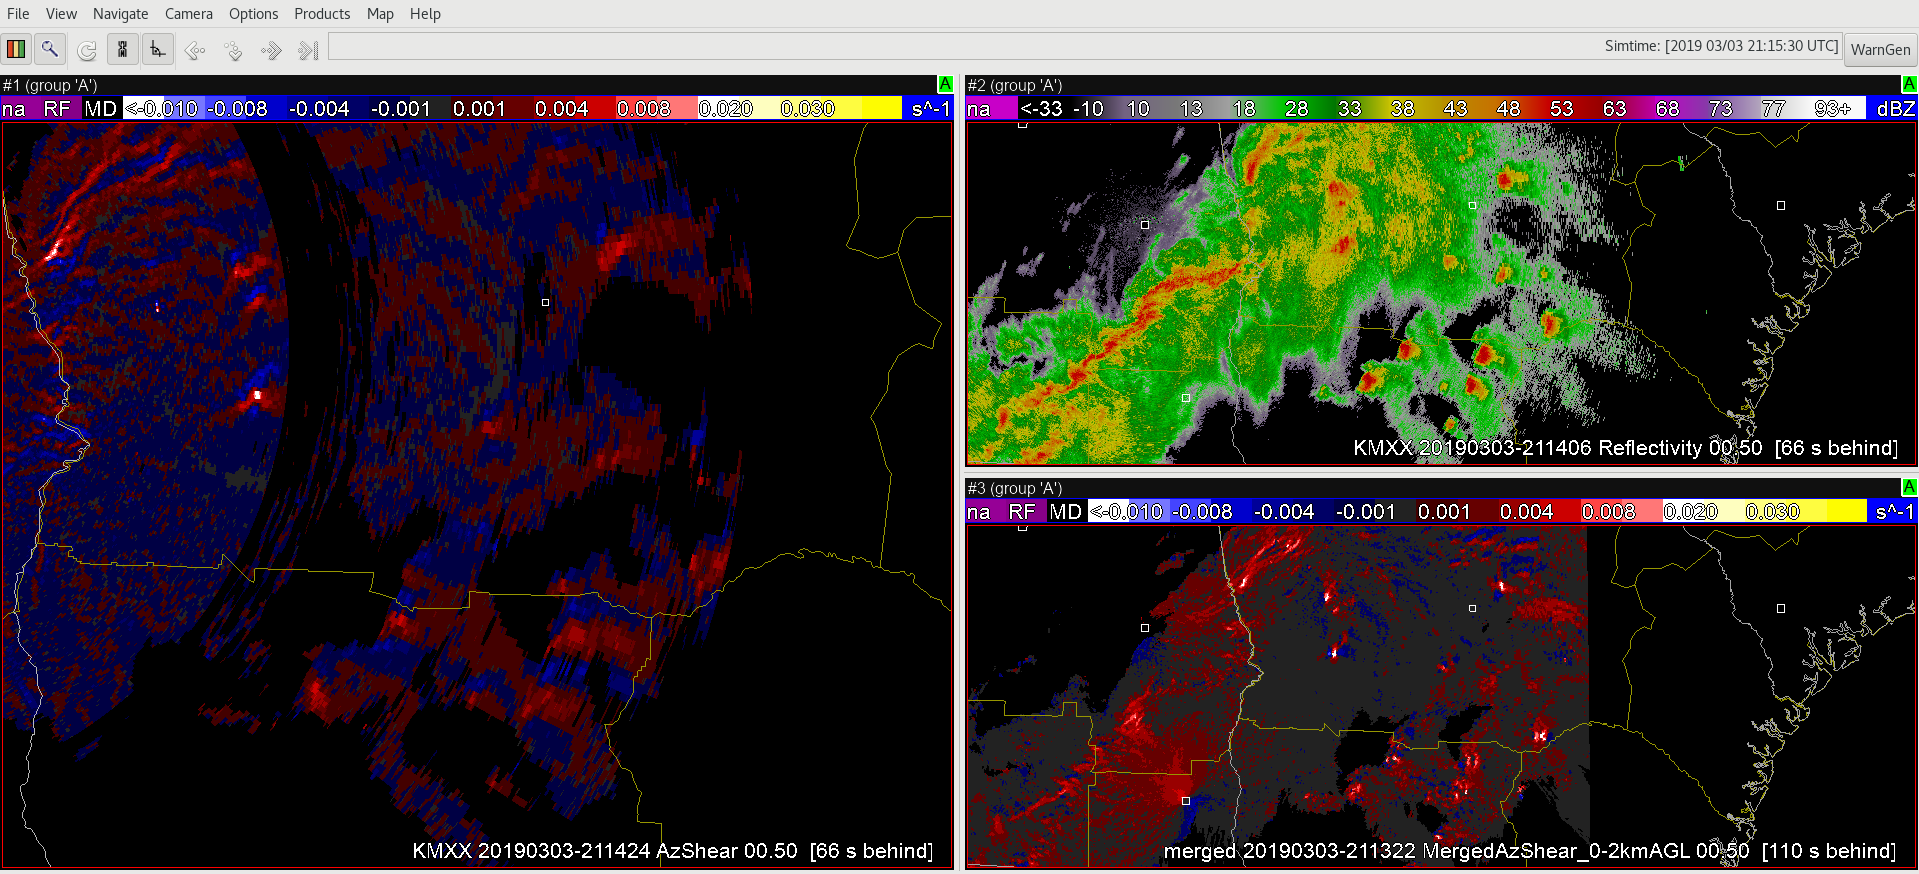
It seems to me the merged product, particularly the 0-2km, highlights nearly every updraft whereas the AzShear seems to do a good job discriminating, and highlights the cell most likely to have strong rotation. In this case the couplet shows up in the western side of the AzShear display and is associated with an embedded rotating updraft, while the AzShear does not highlight the cells further southeast which show weaker rotation. However, the merged product (bottom right) shows bullseyes on all these cells which would make it difficult to triage which storms need attention.

-64BoggsLites

Initial impressions of AzShear

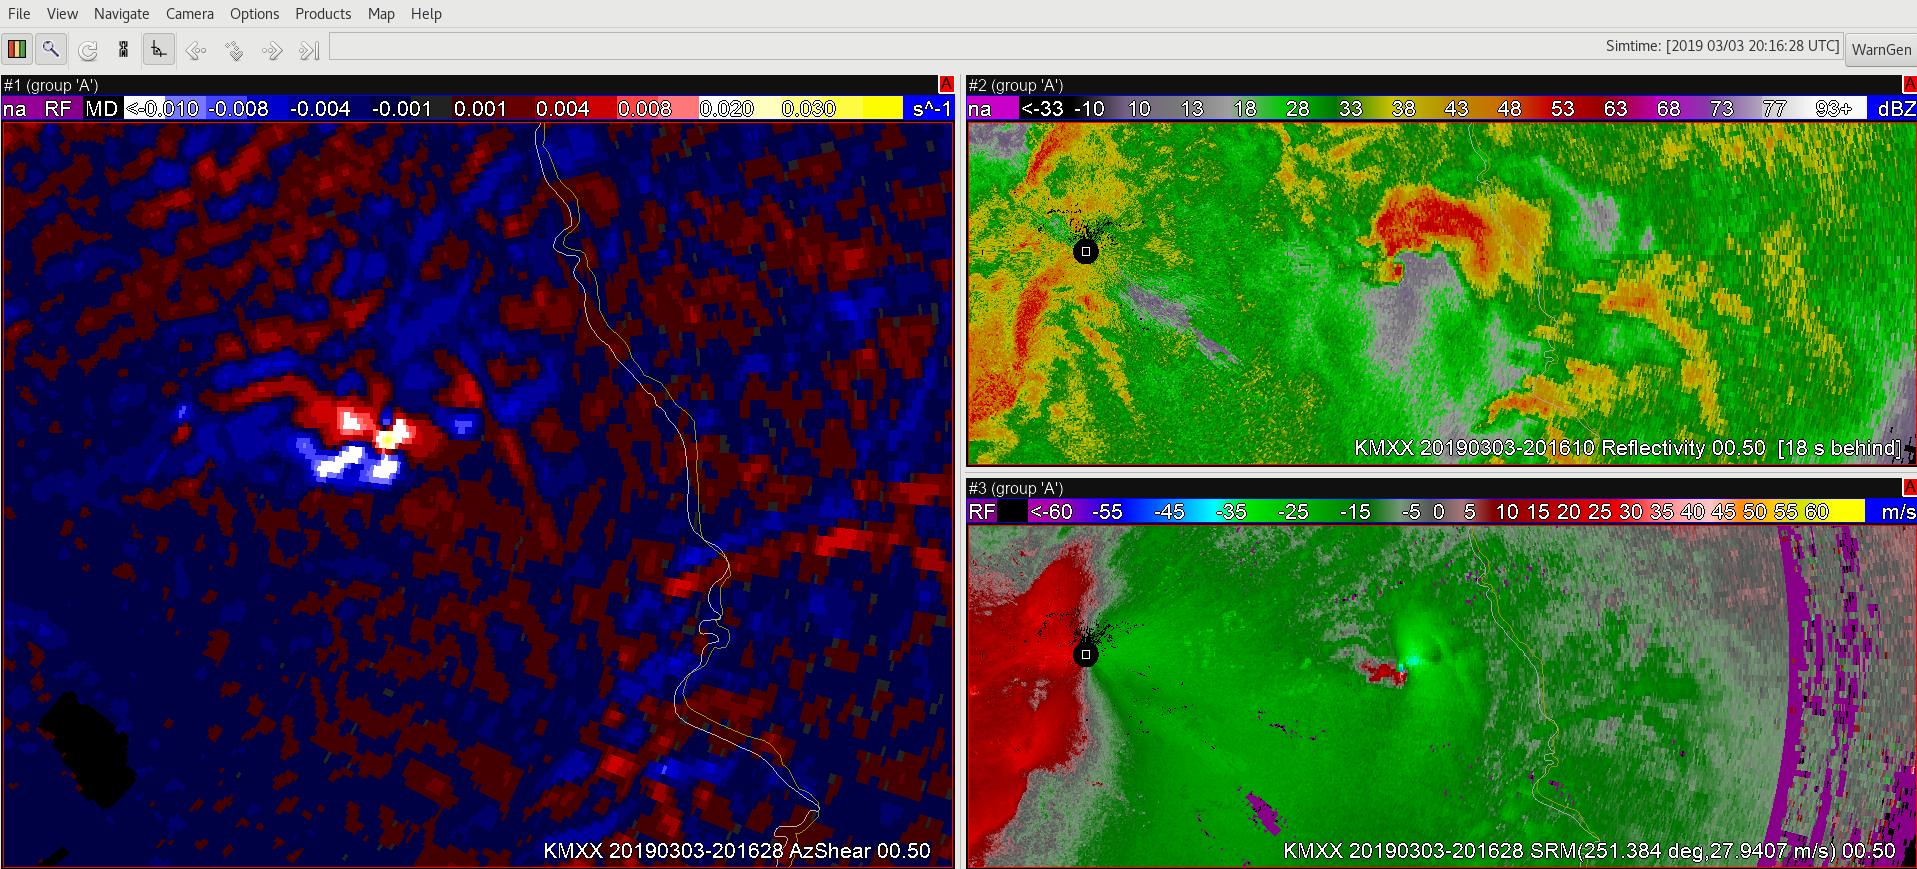
Two things jumped out at me right off the bat regarding AzShear. First, the couplet in AzShear really jumps out and your attention becomes focused on this area for further interrogation. It’s a great tool to further investigate the rotation couplet and storm structure in the base data (top picture).  Second, The couplet really jumps out in the AzShear product much better when compared to the merged products (bottom figure). Very impressive!

  -64BoggsLites

AzShear and QLCS

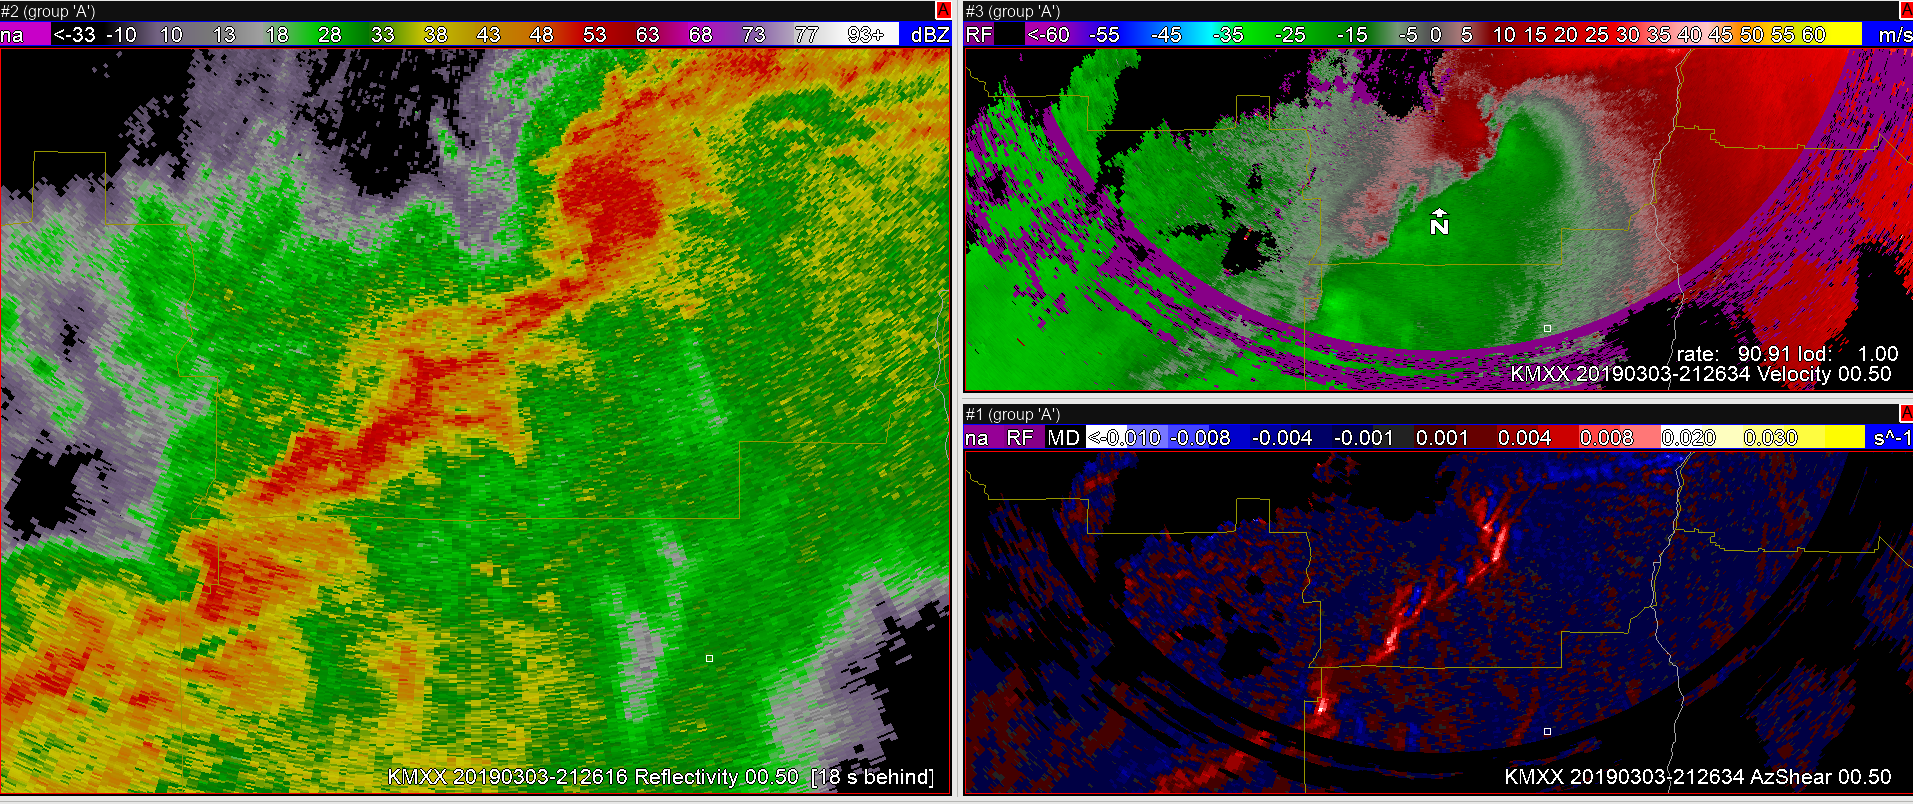
A little later in the day on March 3, 2019, a complex QLCS was seen on KMXX.

The base reflectivity at 0.5 degrees (left) shows several different features along the complex that need investigation given the favorable environment for tornadoes. The corresponding base velocity product (upper right) show several locations where shear is present. However, the single radar AzShear product highlights the portions along the line that look the most threatening.

Thorcaster

Single-Radar AzShear vs MRMS Merged Shear: Lag Time

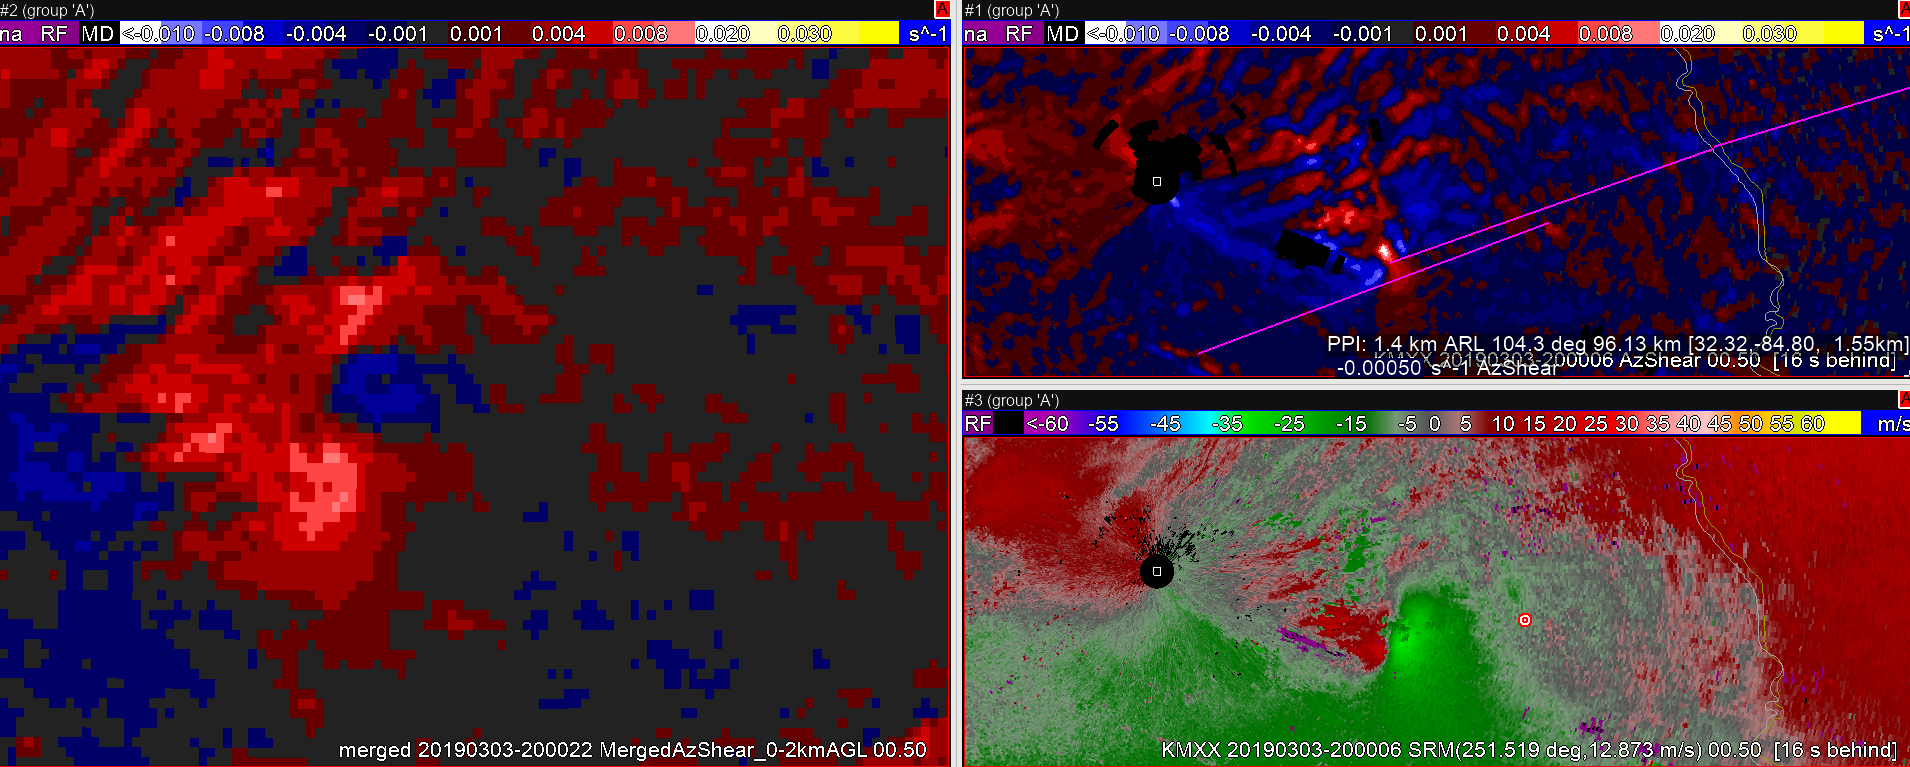
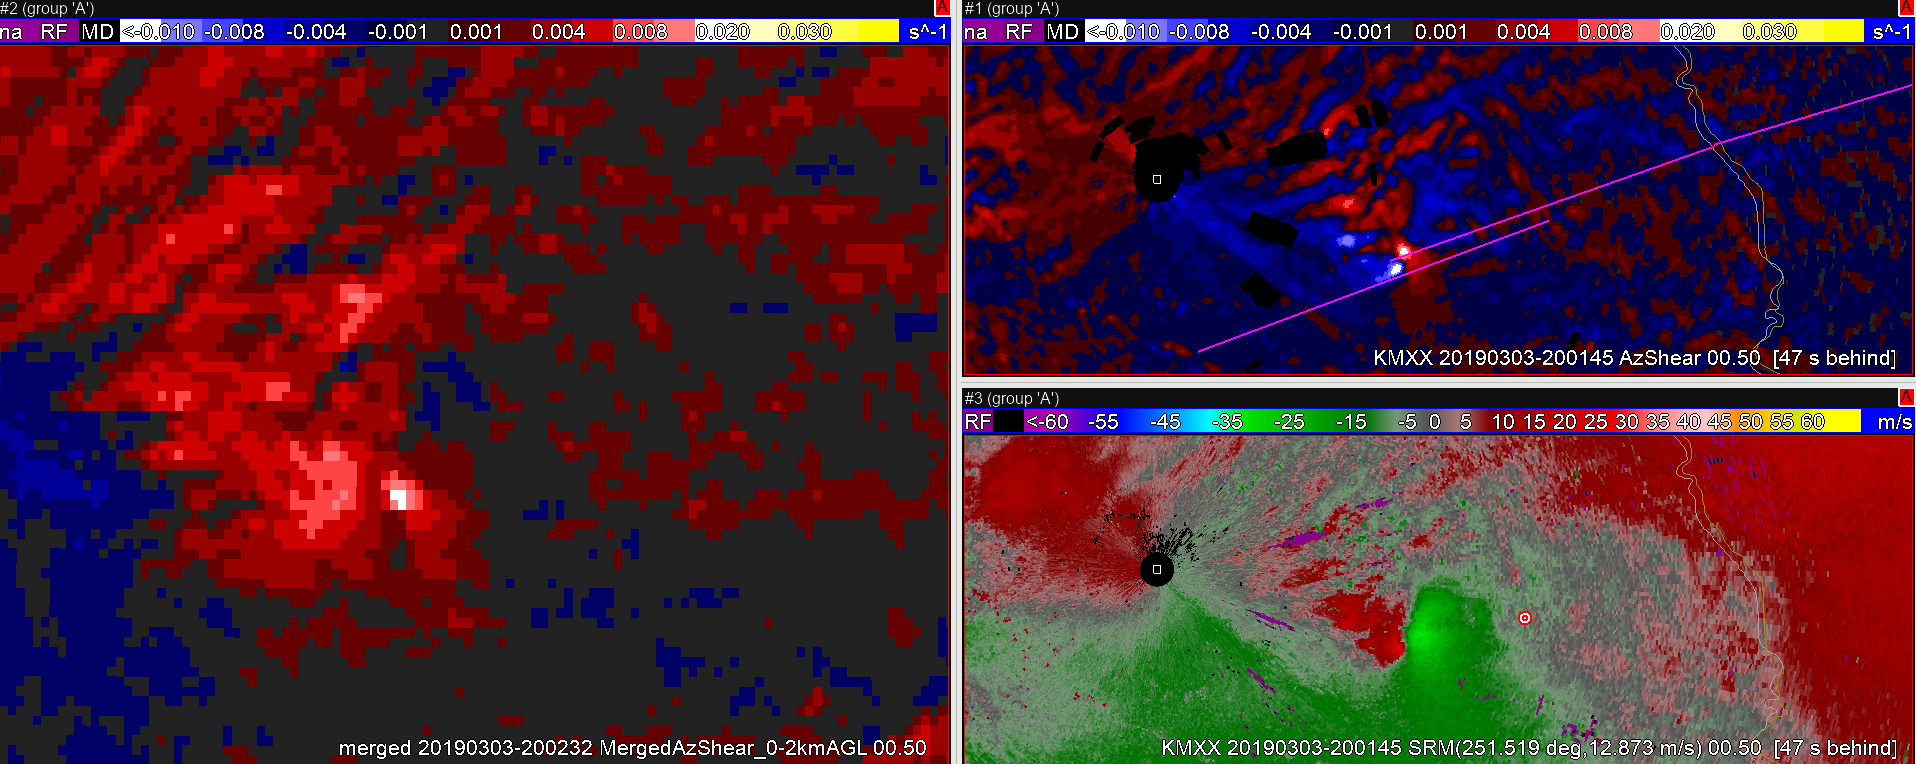
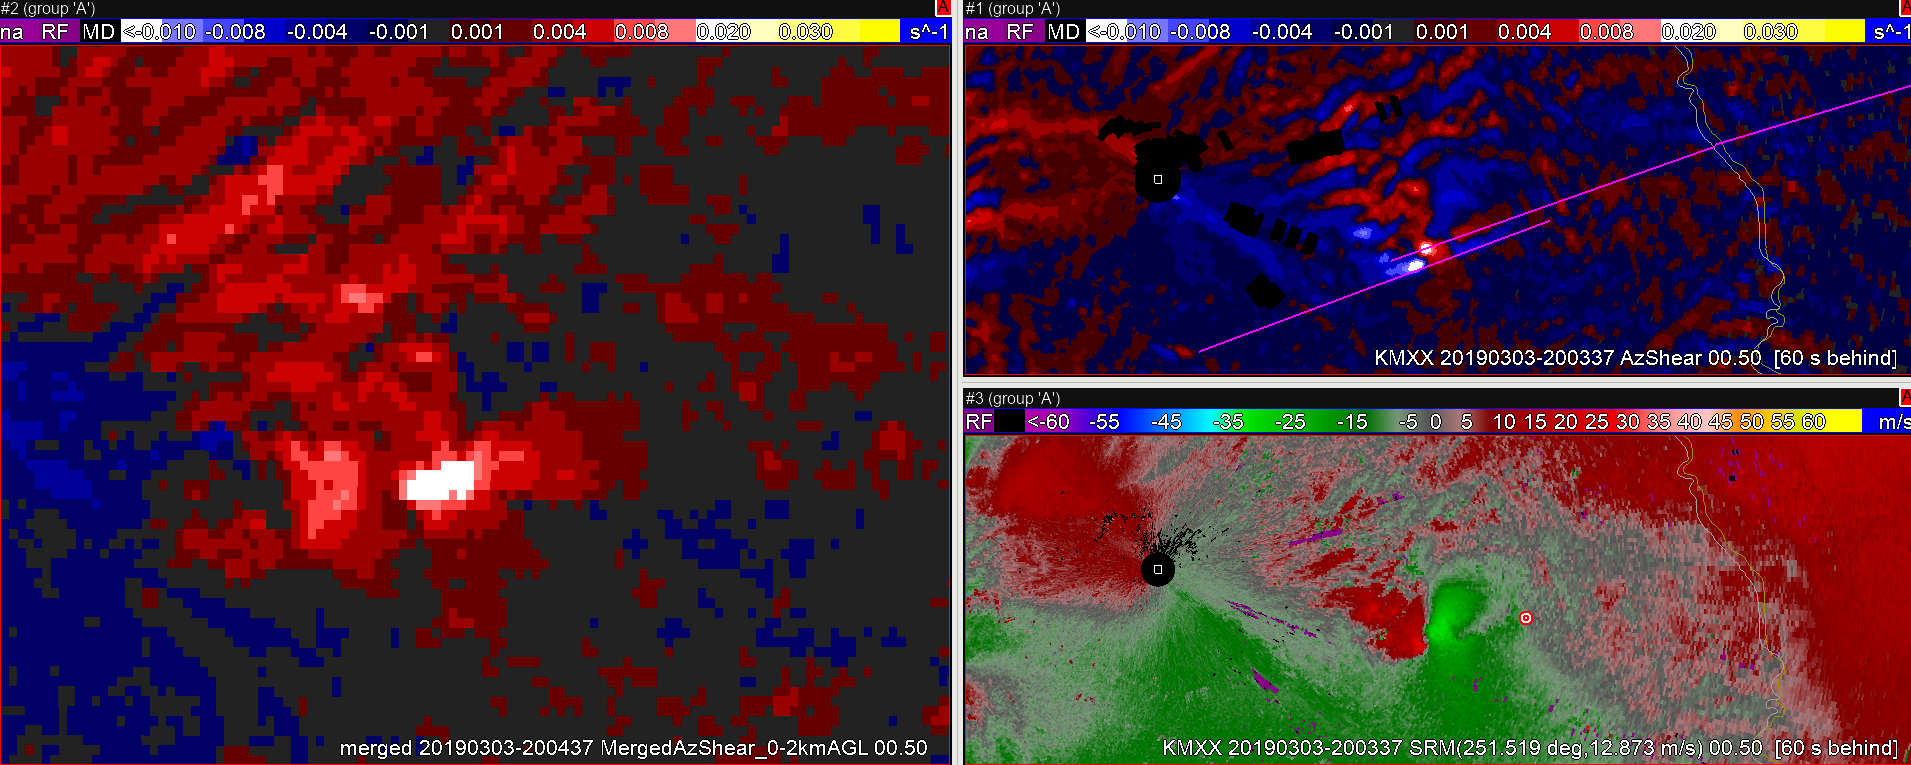
An advantage of single-radar vs. merged az shear jumped out right at the start of today’s simulation: lag time. The single radar product looks to have a 2-3 minute jump on the merged data with respect to low-level rotation, as shown in the time sequence below. The tightening/strengthening rotation couplet begins to jump off the screen in the single-radar data at the 2000 scan further intensifies through 2004. The area of strengthening low level rotation is much more muted in the merged data at 2000. It is more noticeable in the 2002 scan before becoming quite obvious by 2004. This small lag may not be significant, but it could be the difference of a  few minutes worth of lead time in warning decisions.

Dave Grohl

Single Radar AzShear Helpful in picking out strongest rotations

In going through the case of March 3, 2019, One if the useful items that stood out was the single radar AzShear Product. See the screenshot below.

Looking at the base velocity product in the upper right window, there are several circulations that can be seen. Similarly, the reflectivity image (lower right) shows several cells of potential interest. Fortunately, the AzShear product (left) highlights the cells you should investigate first by looking at the cells with the highest AzShear Values. This will be very helpful in decision making on the warning desk in a forecast office.

Thorcaster


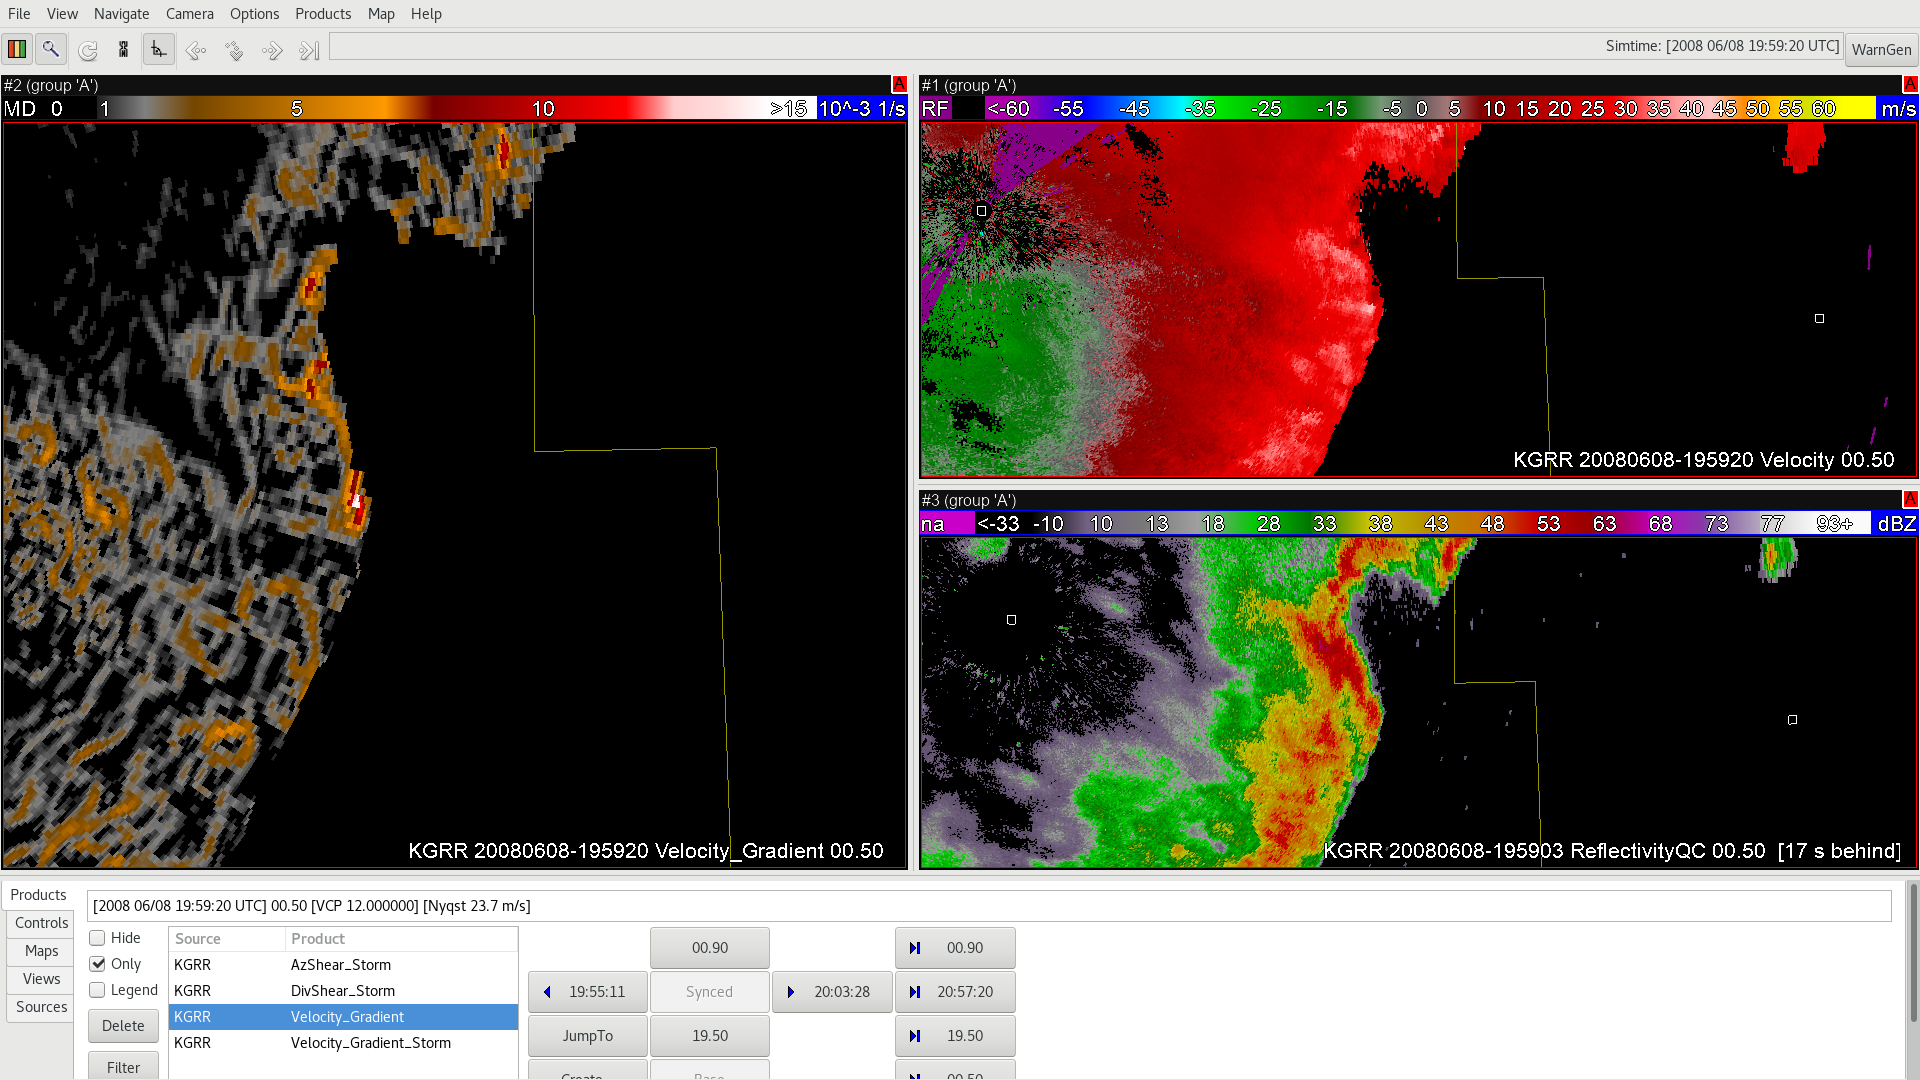
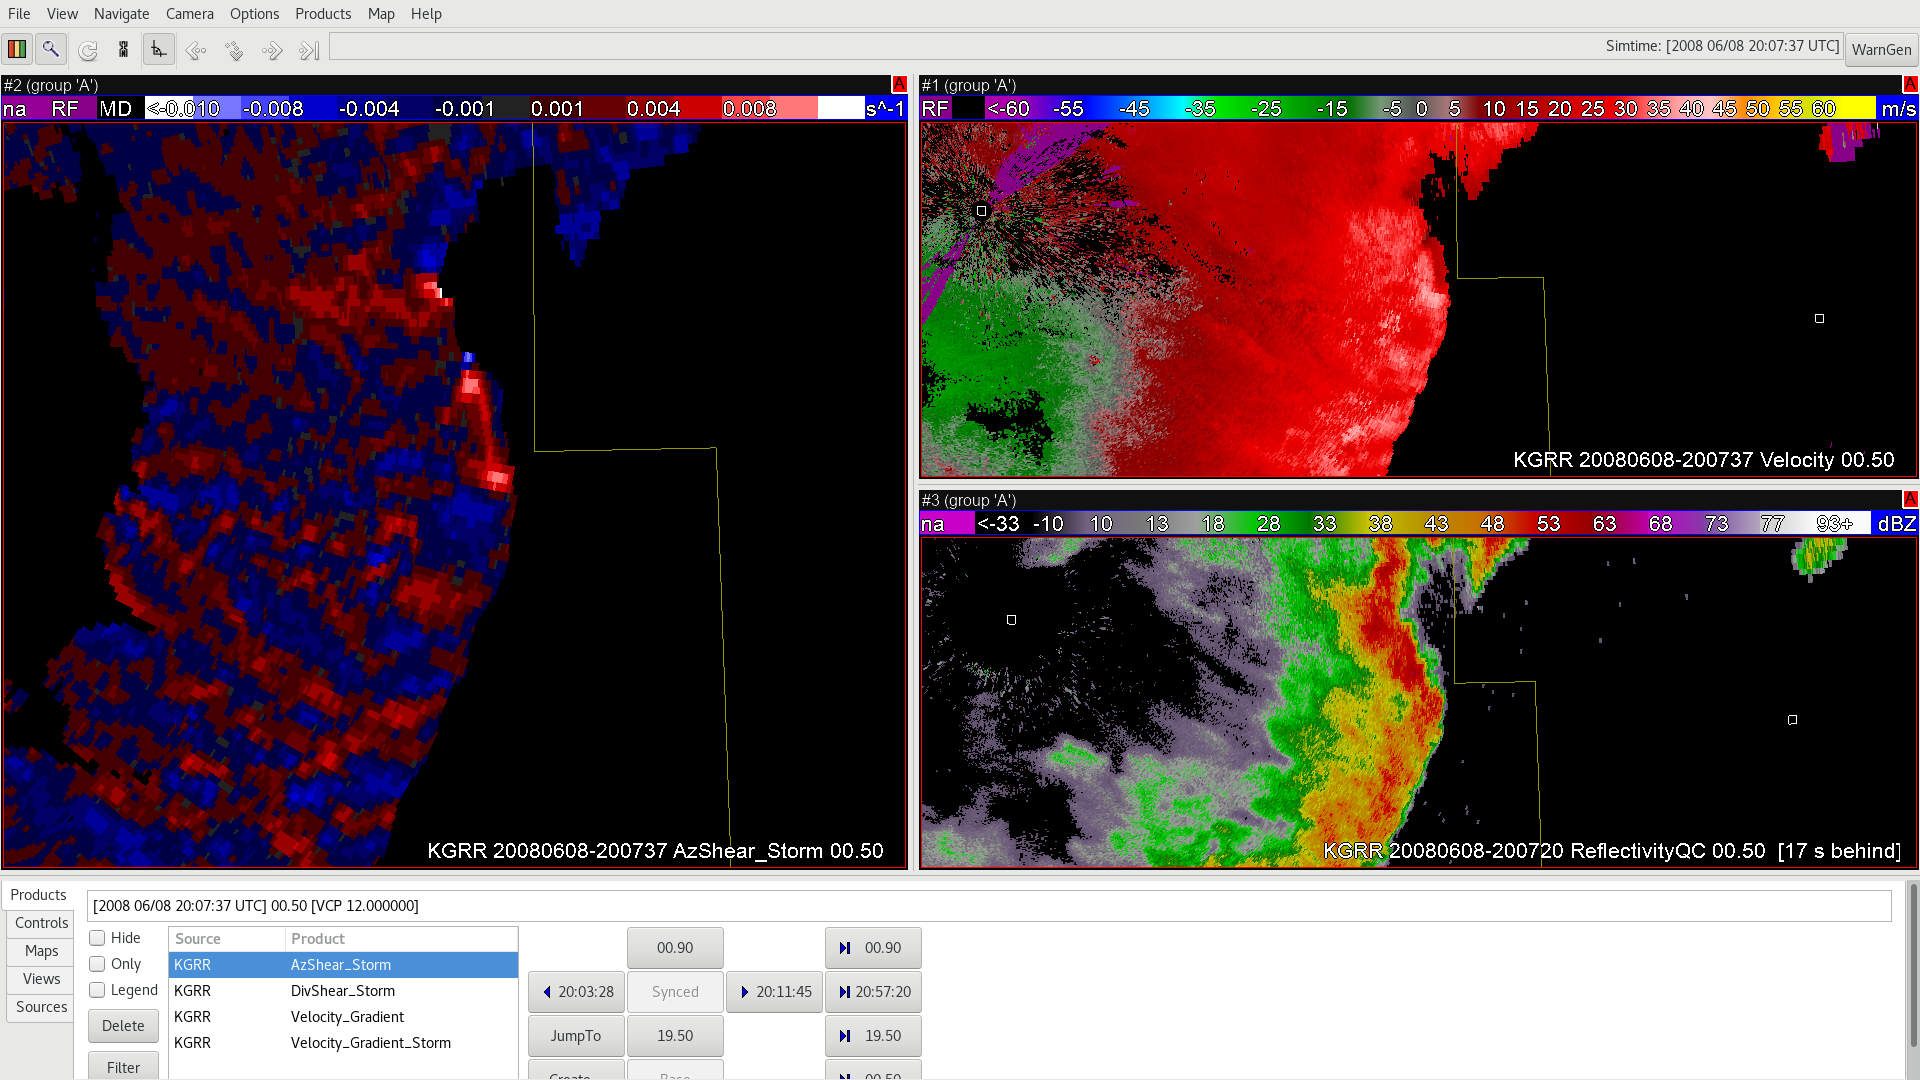
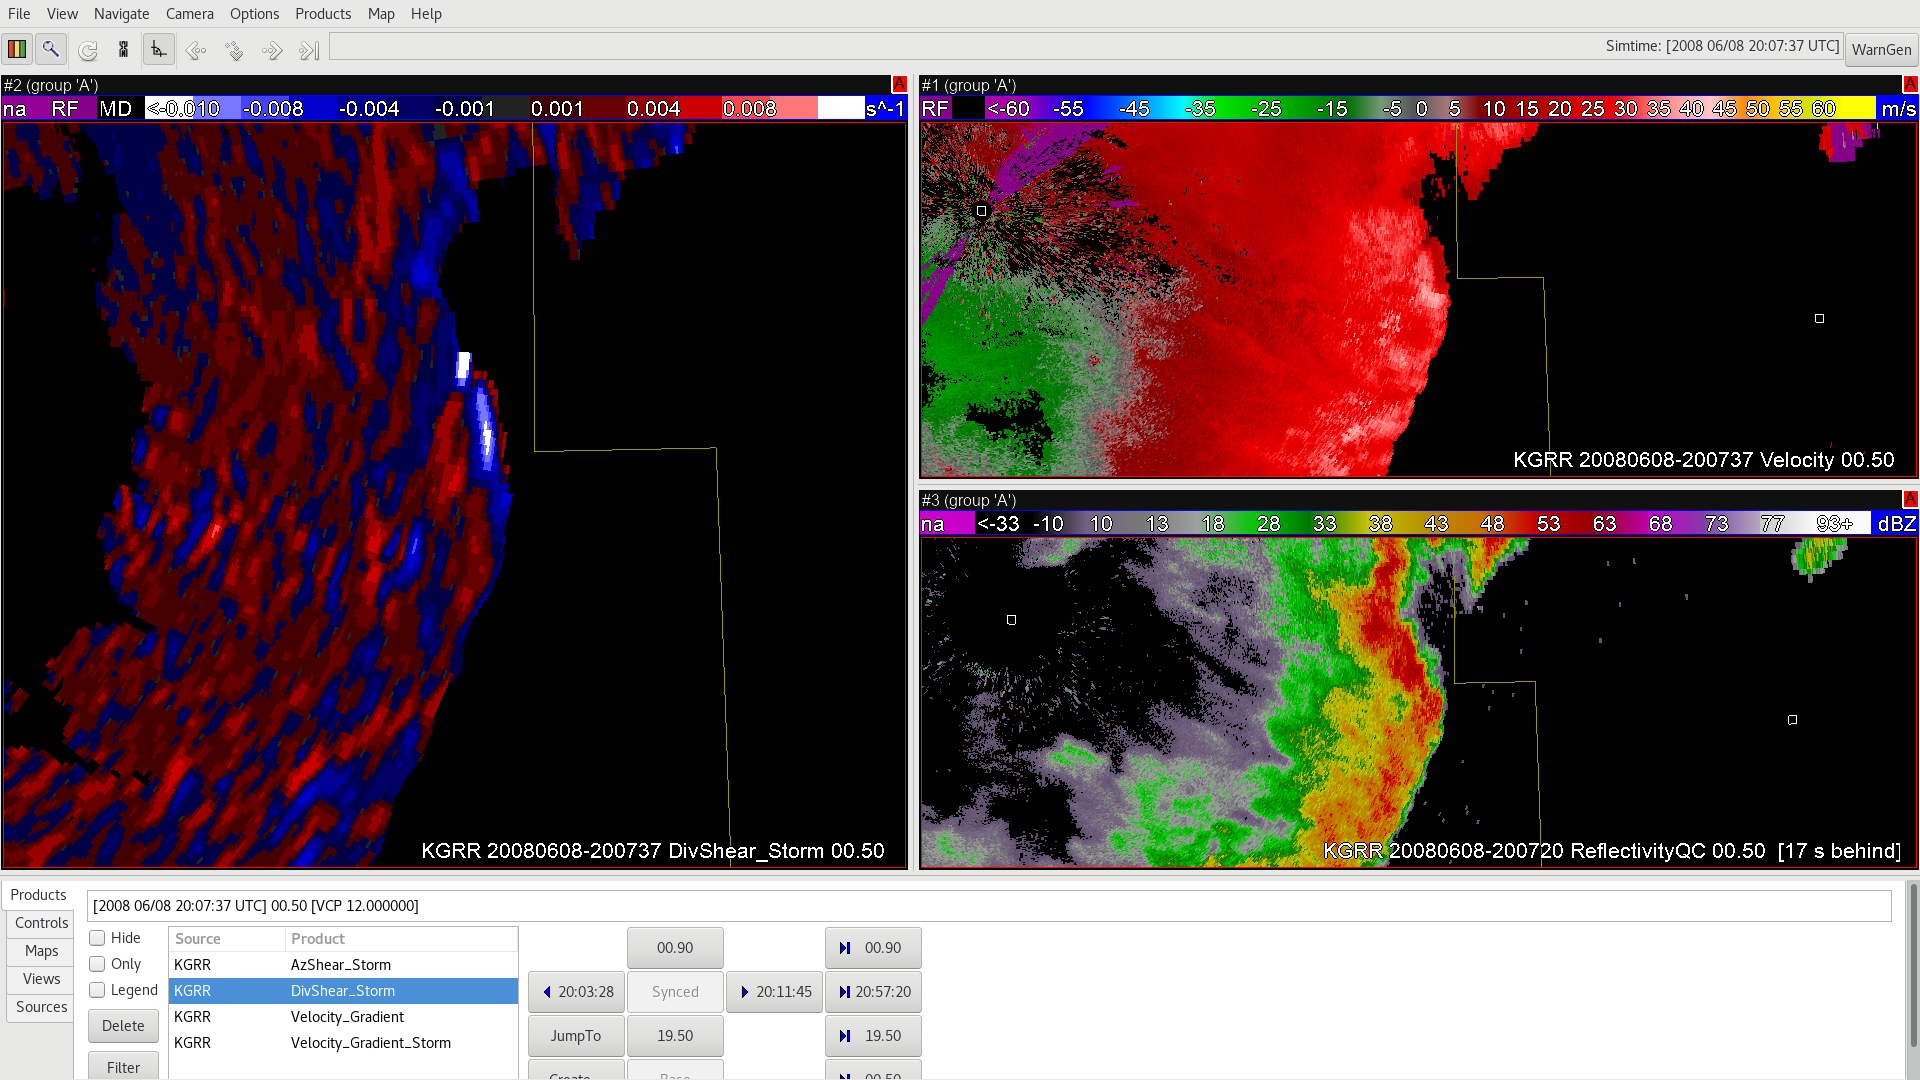
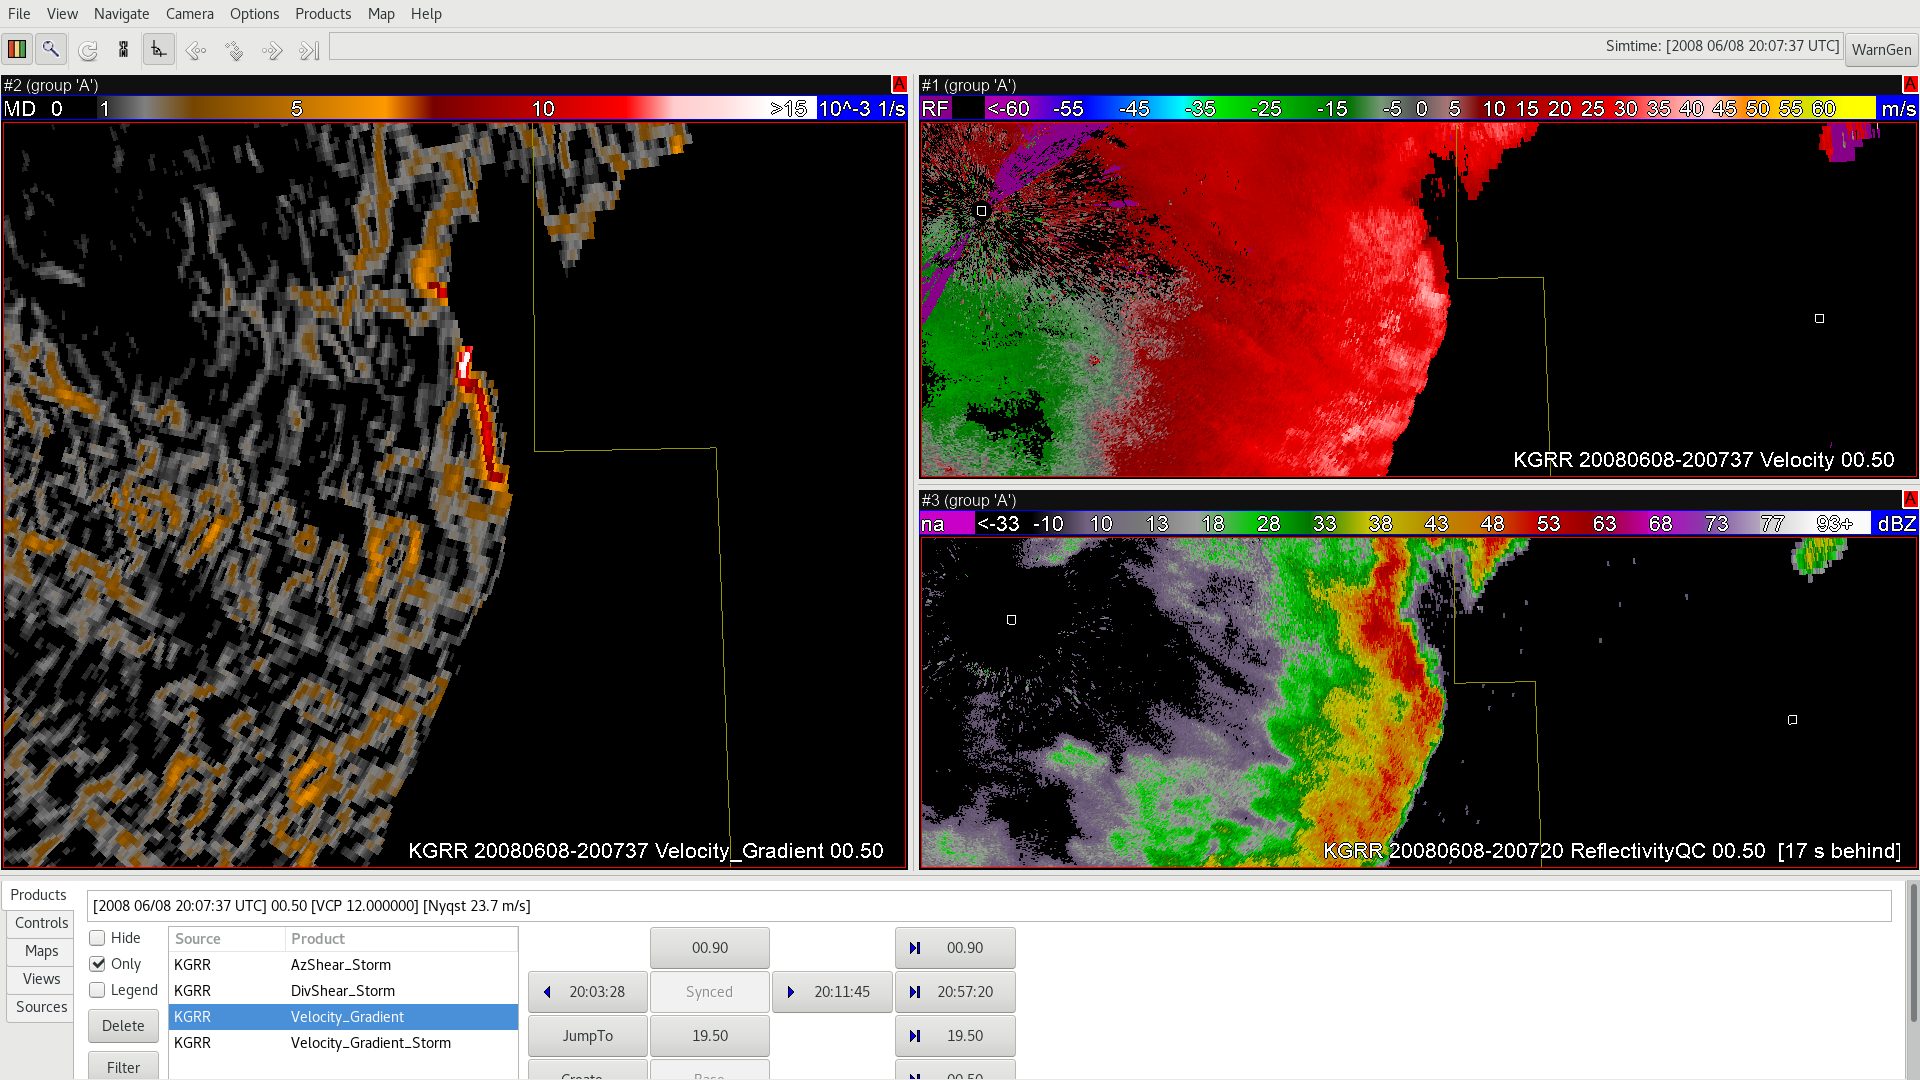
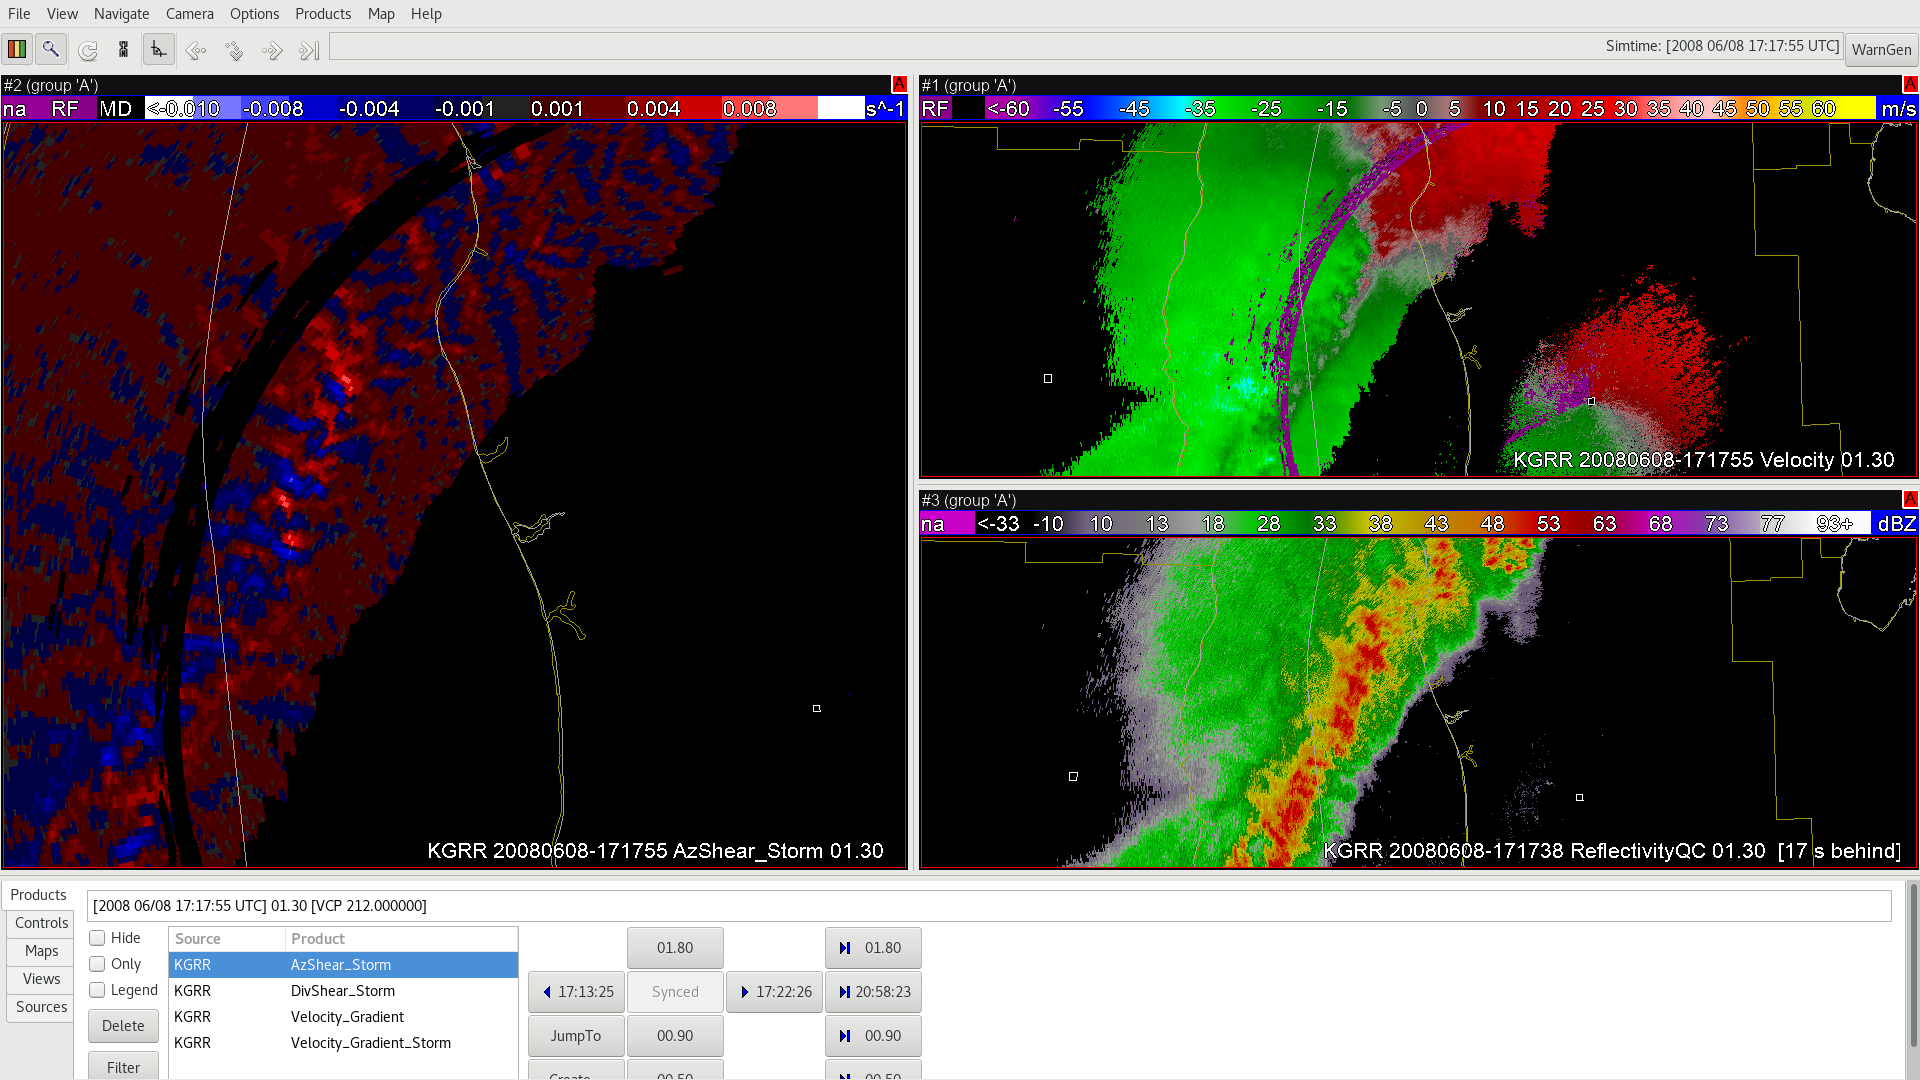
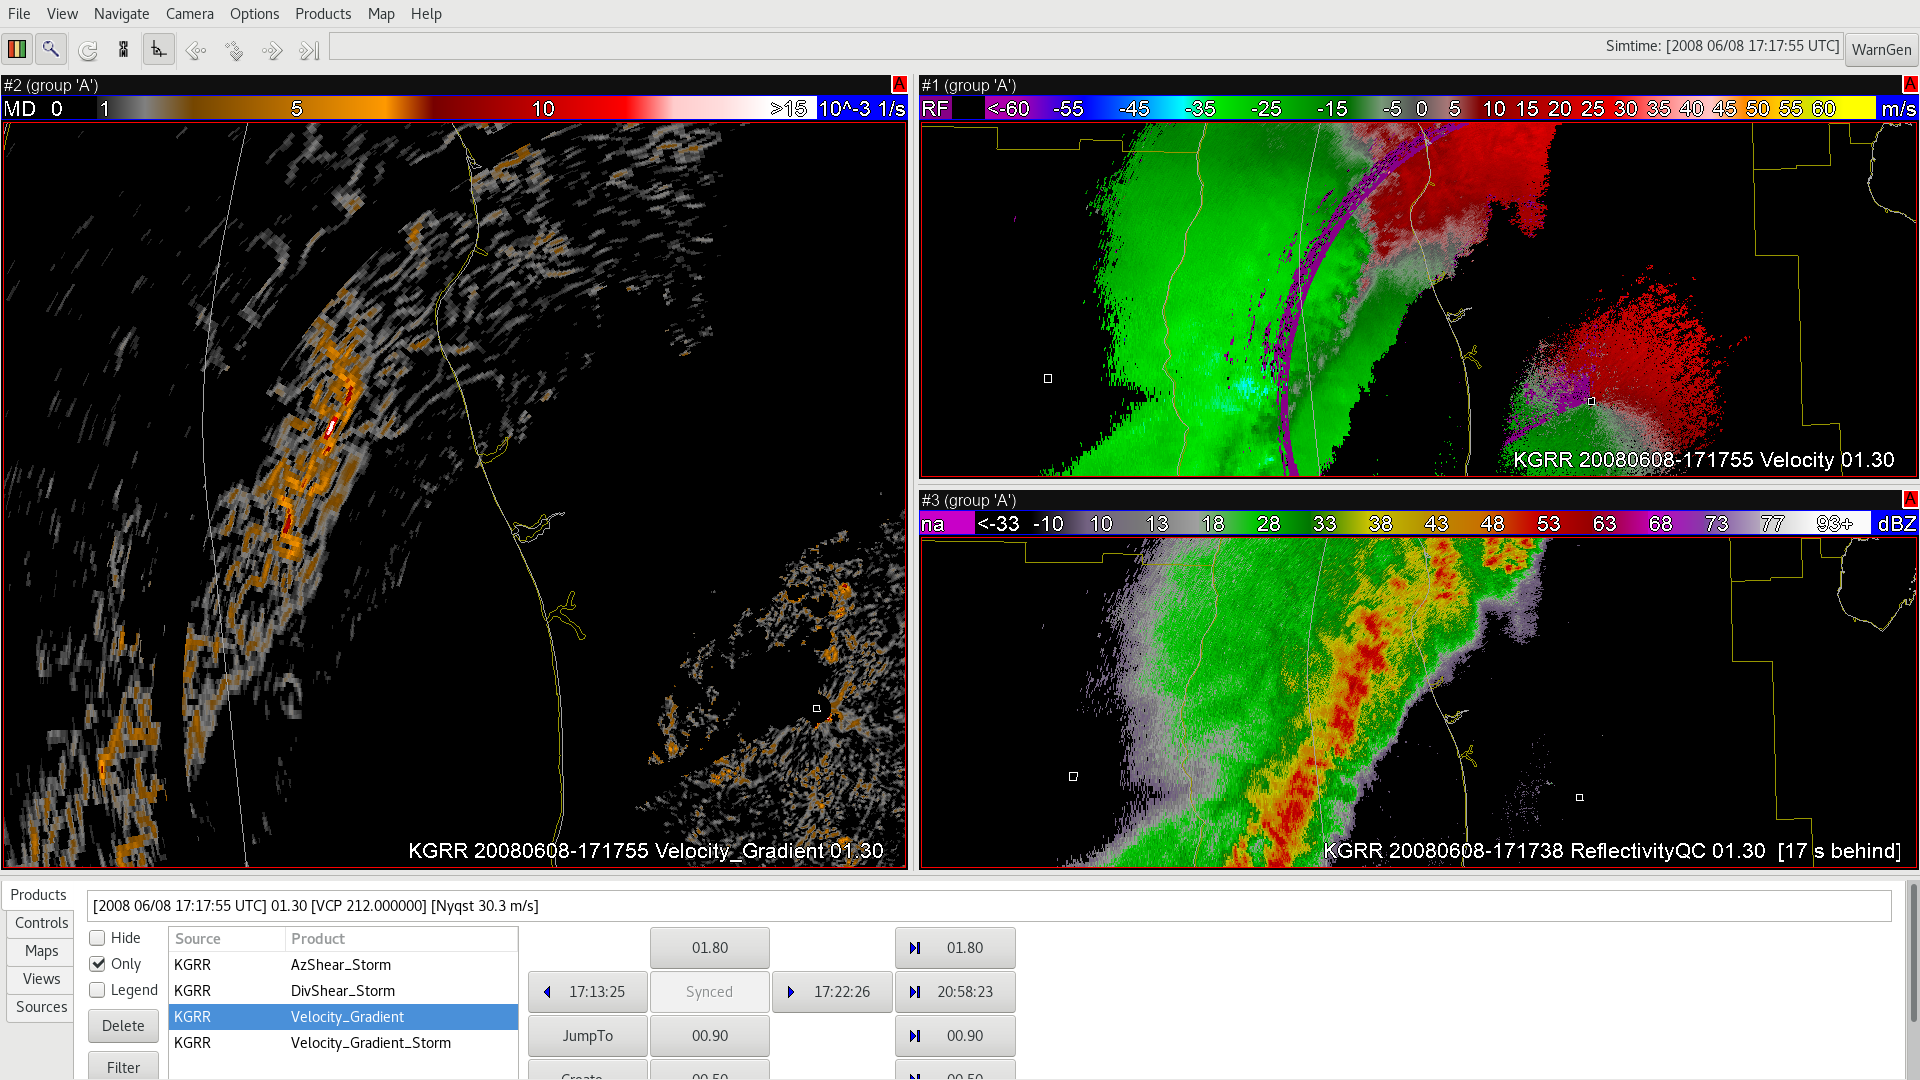
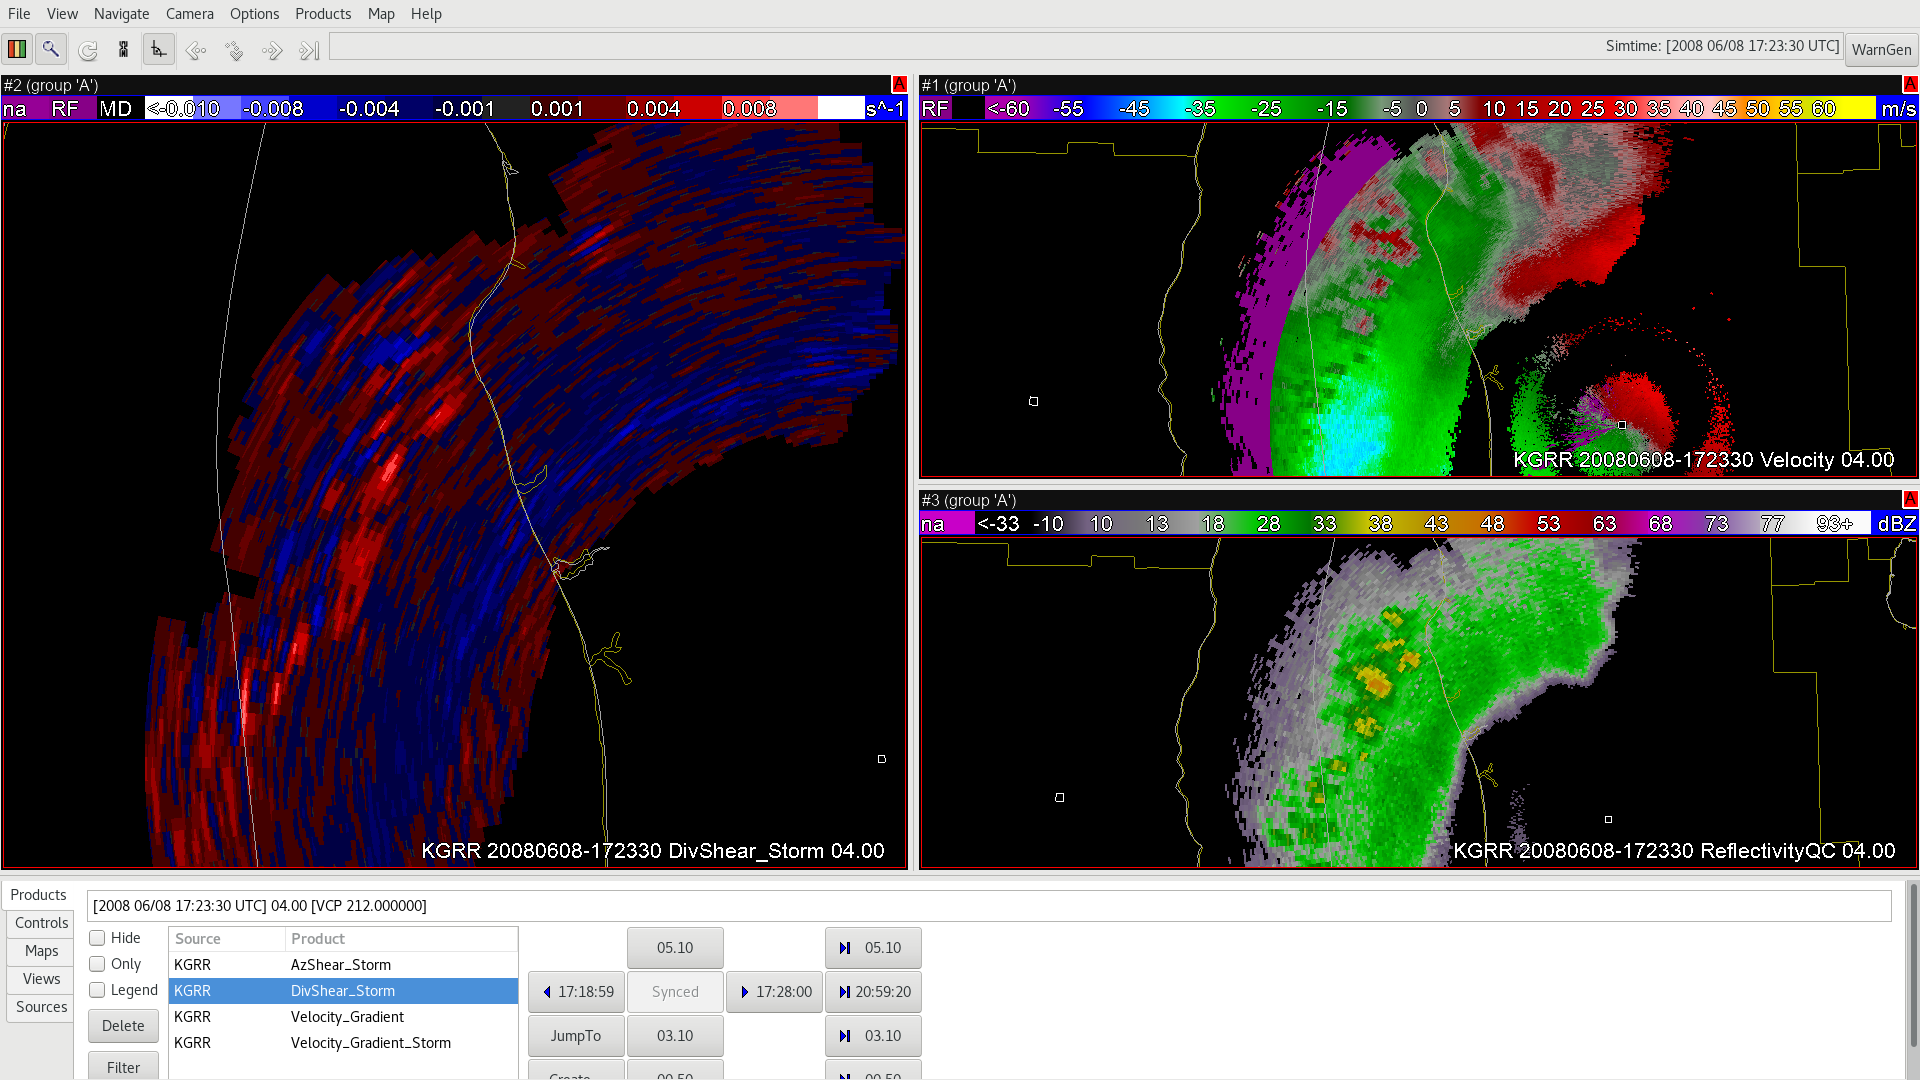
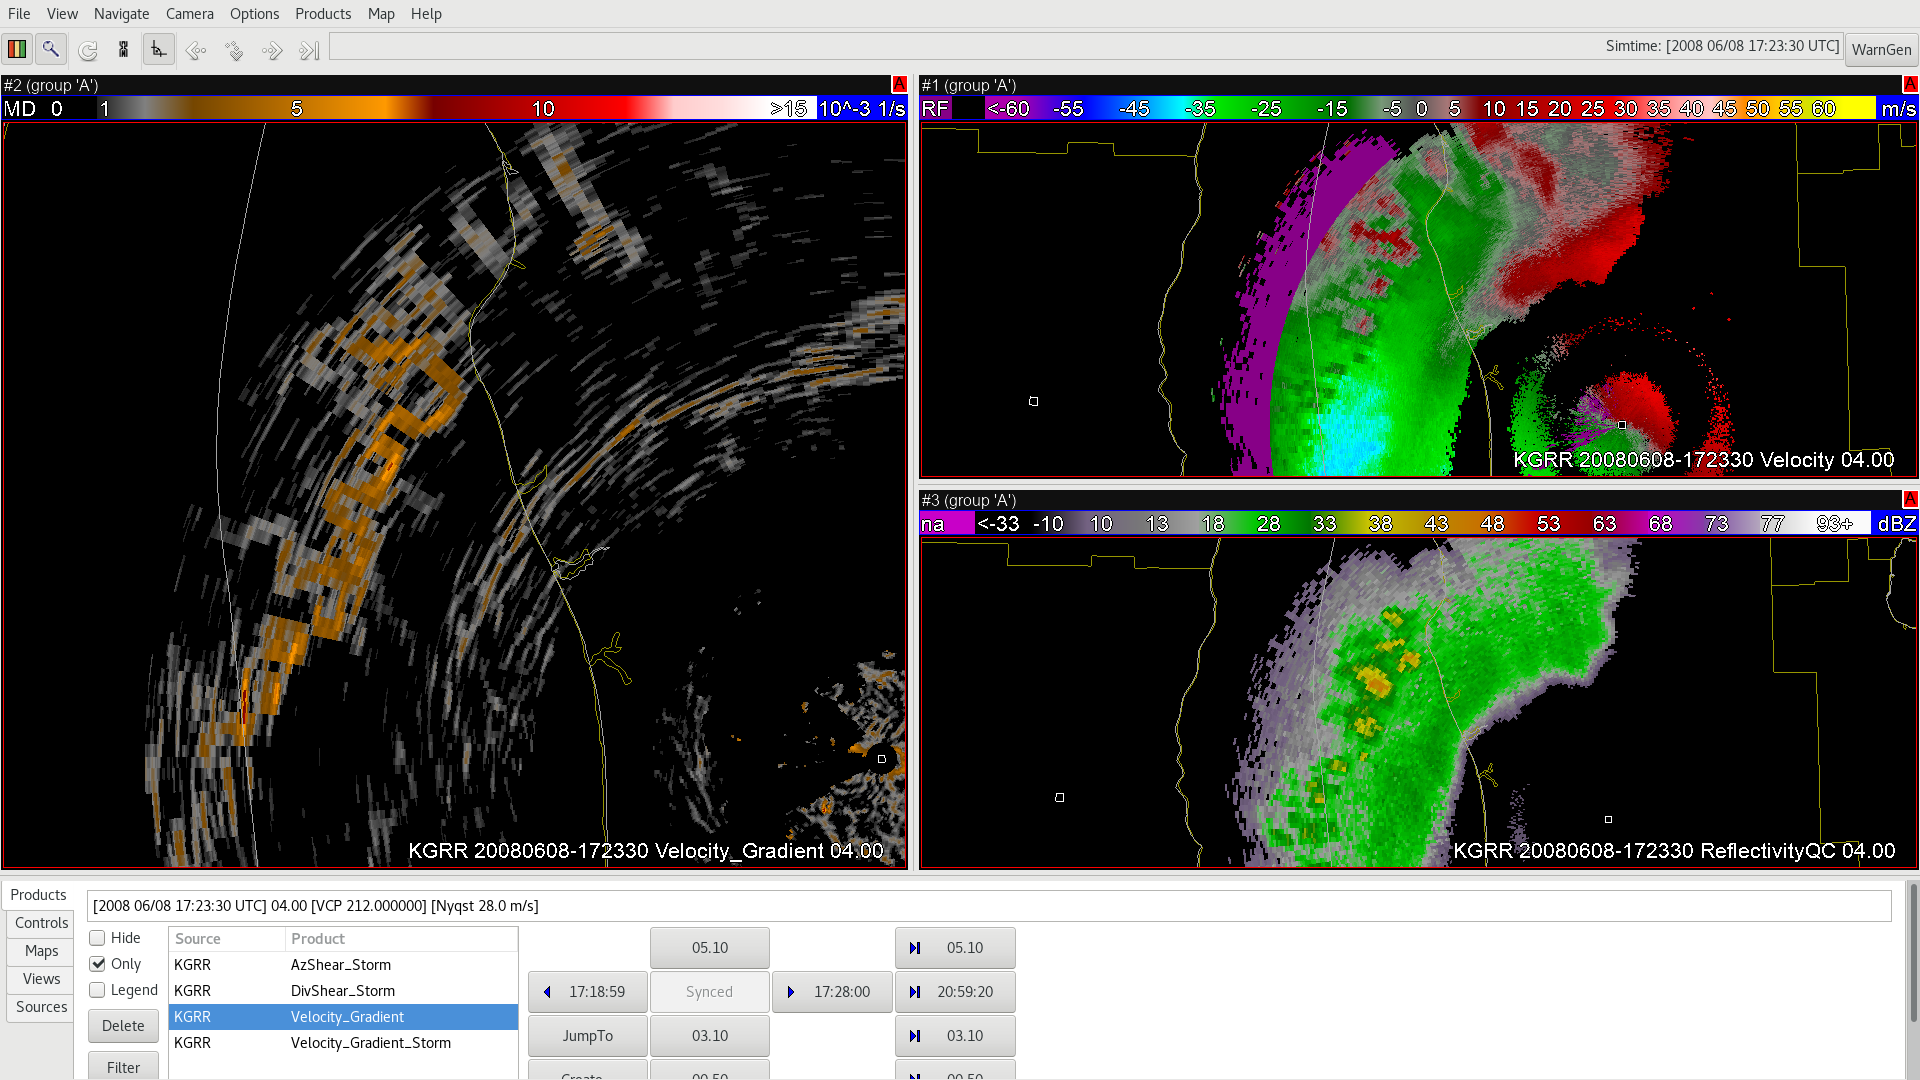
Div Shear and Velocity Gradient associated with a damaging QLCS mesovortex

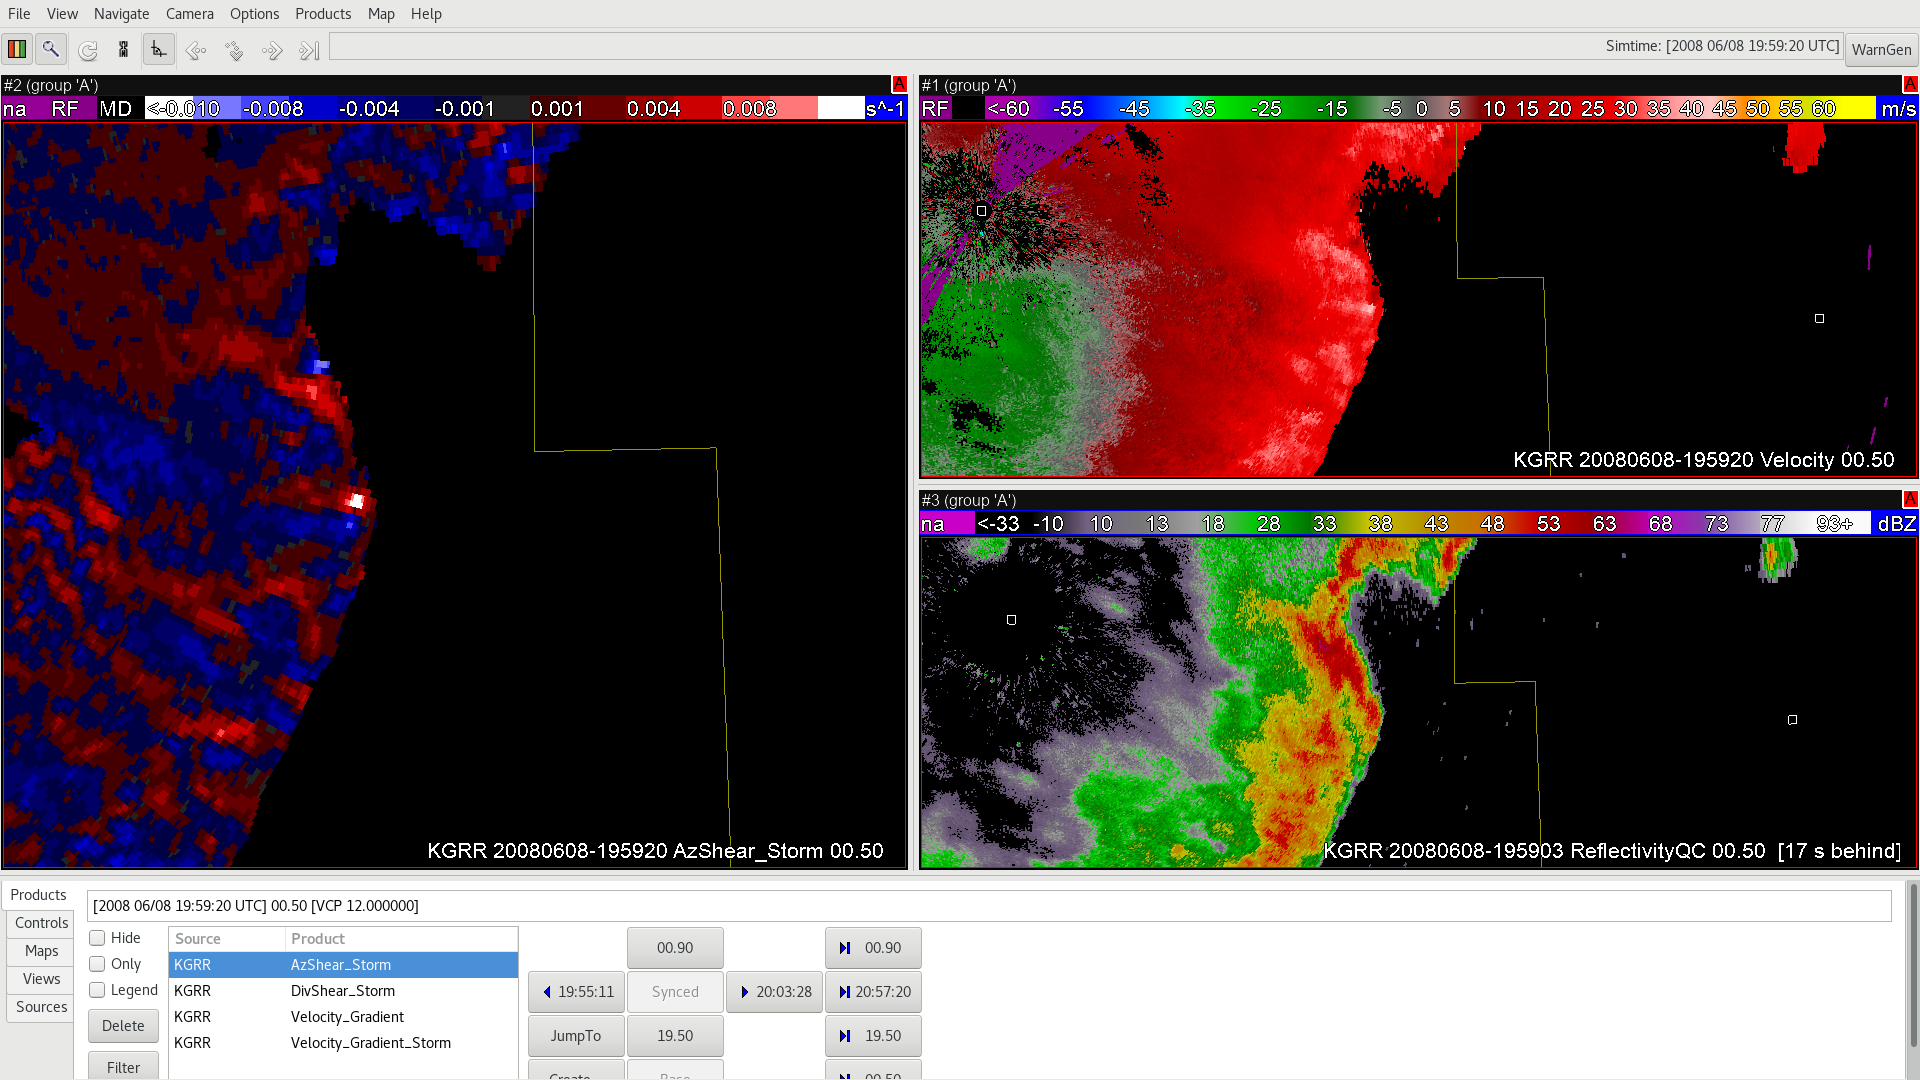
All righty, now let’s take a look at a maturing QLCS mesovortex, starting with AzShear…

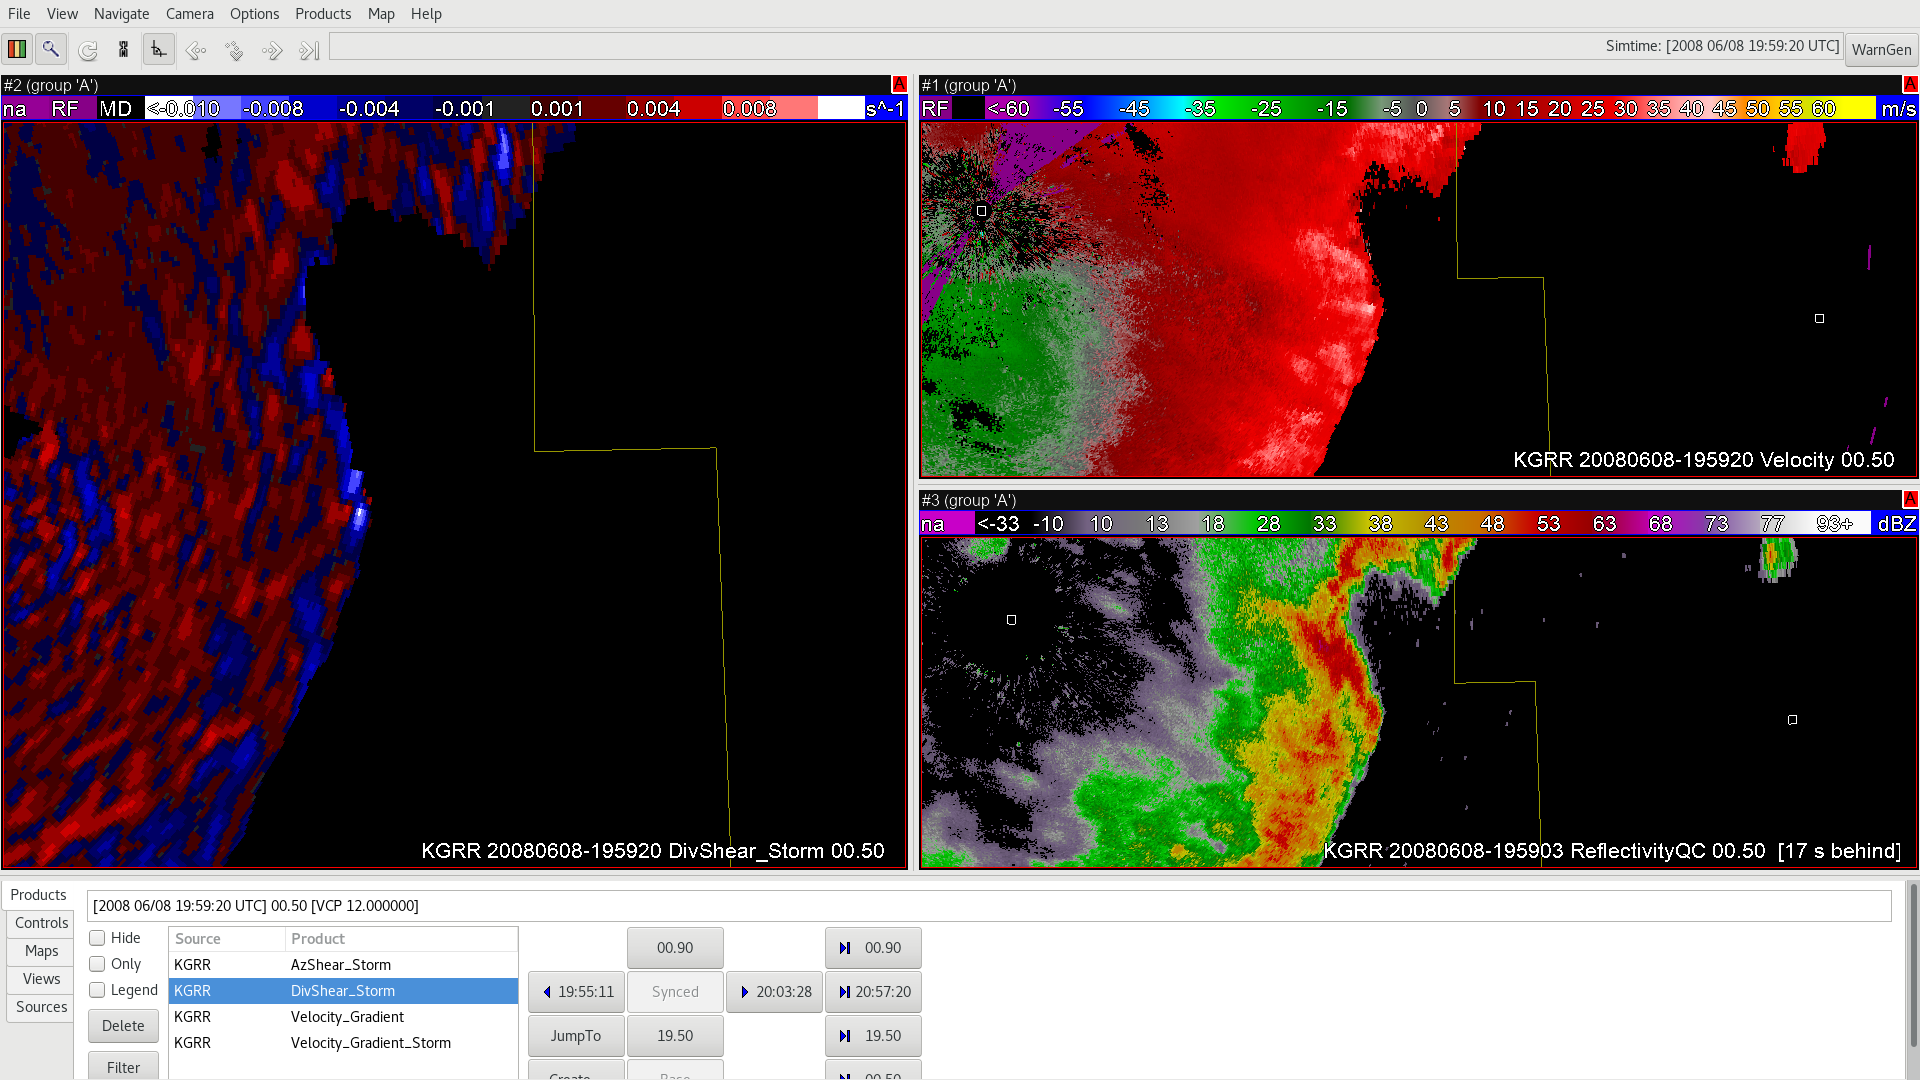
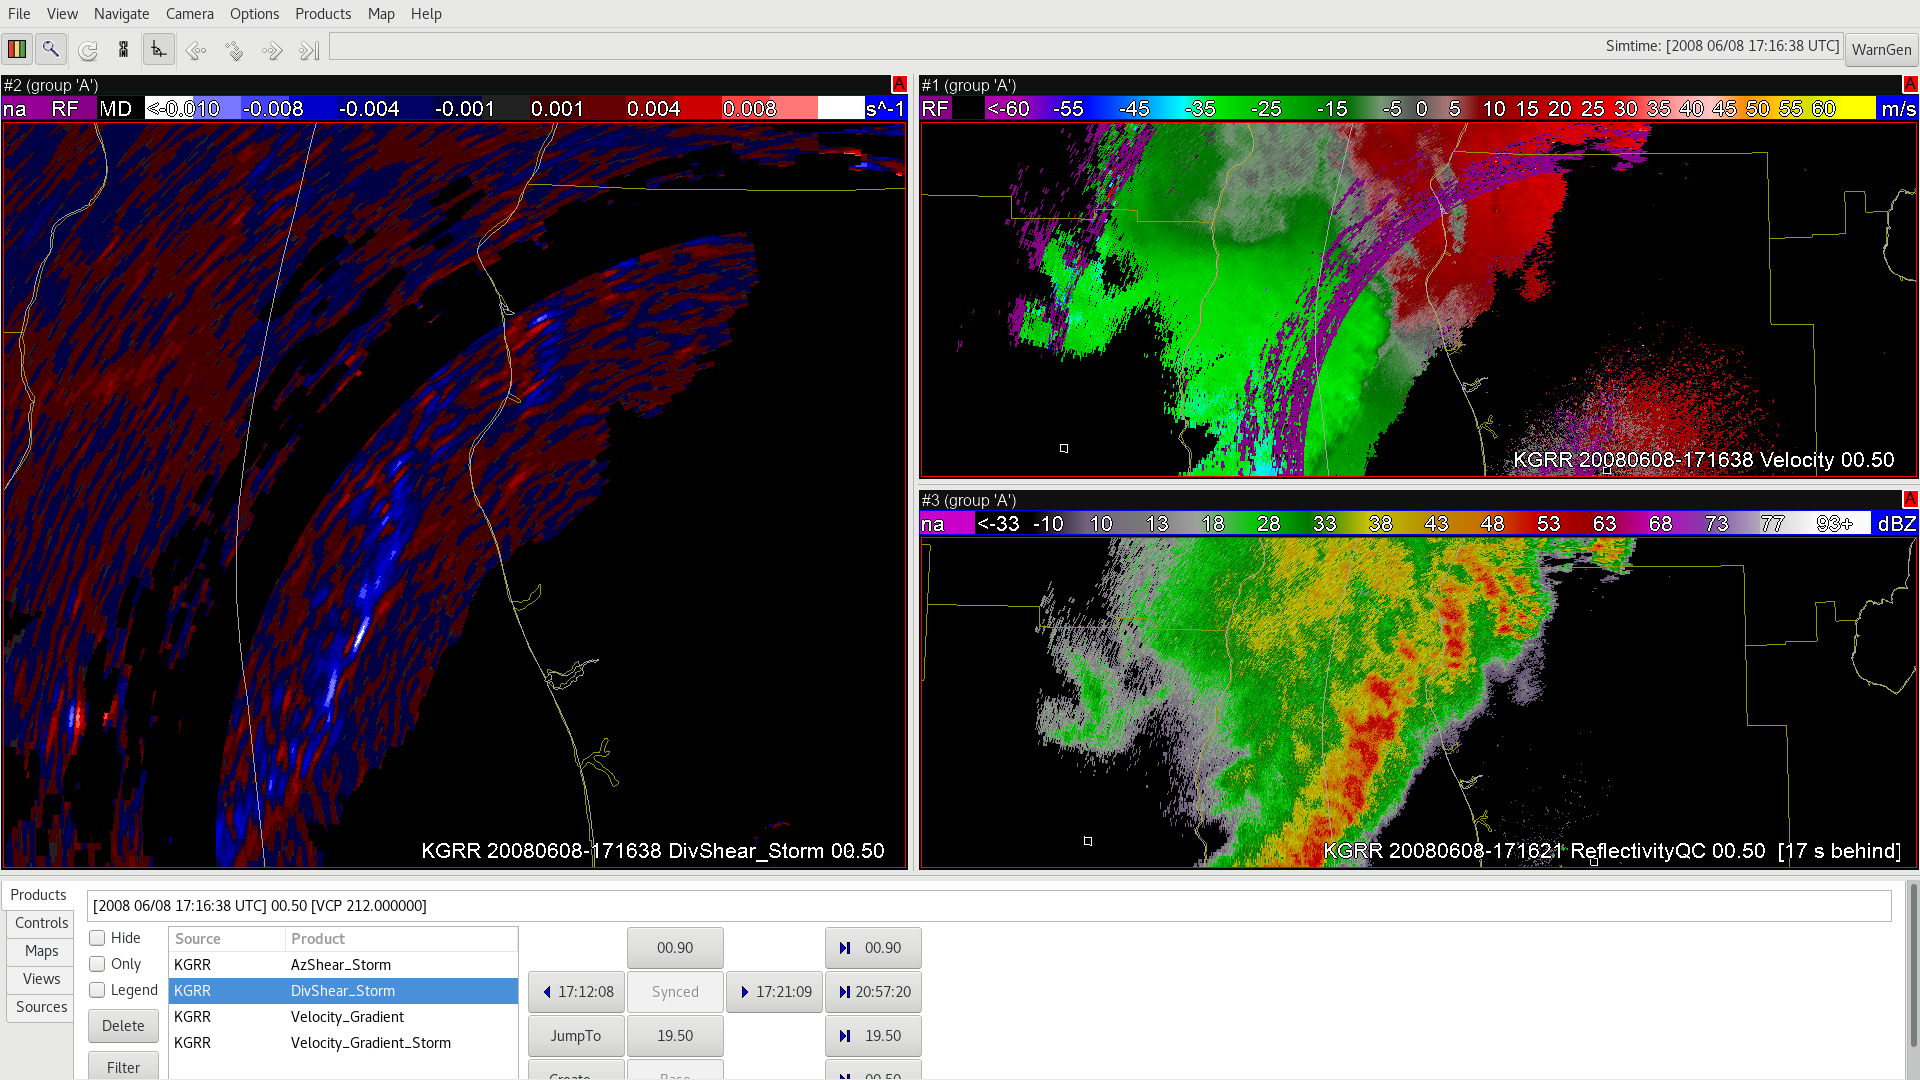
At the apex of the bow we see a bit of an AzShear couplet (maximum at the apex with a weaker “blue” minimum just to the south). Comparing this to DivShear…

Hmm, certainly some blue negative divergence (i.e., convergence) there too. Now putting them together into Velocity Gradient…

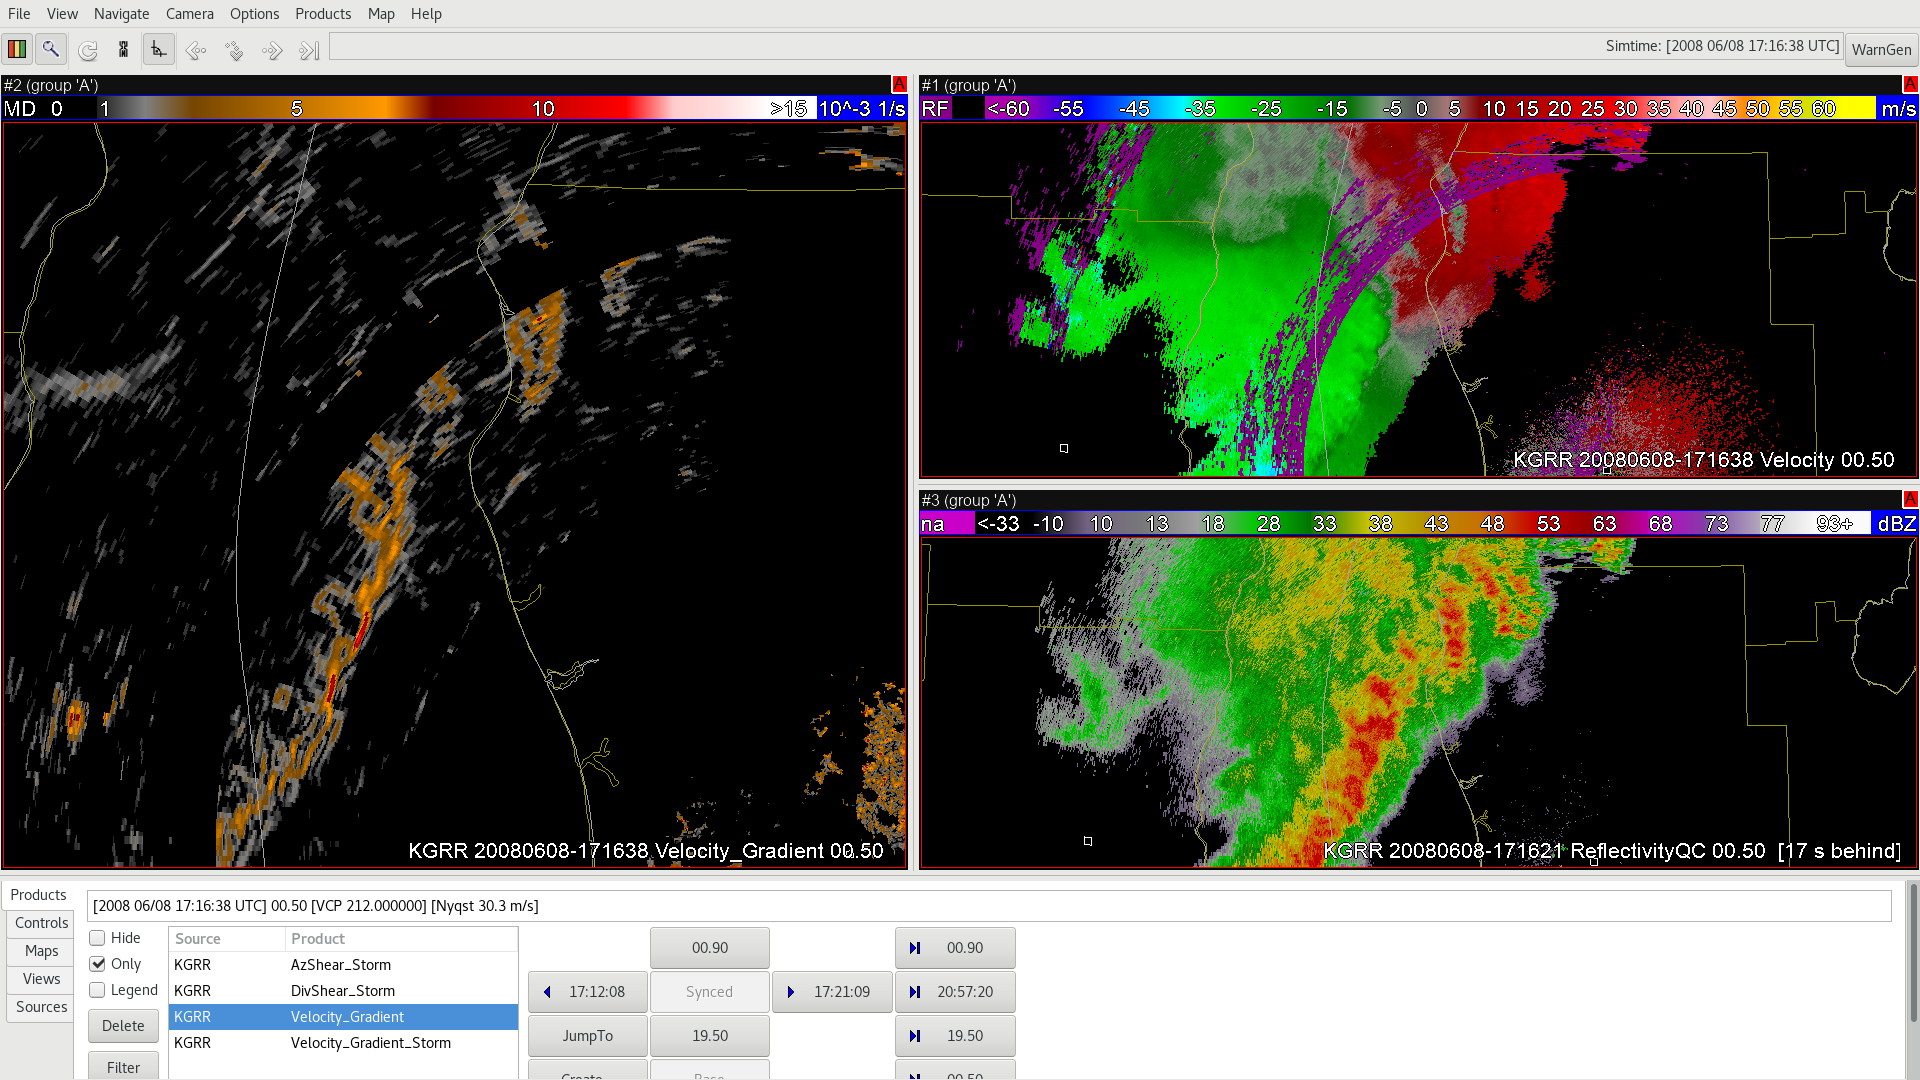
…things really really start to pop. At this point, it appears that the azimuthal shear is a bit more of a contributor than DivShear. Now looking later when the mesovortex is shifting away from the apex, starting with AzShear, we see a much less focused area…

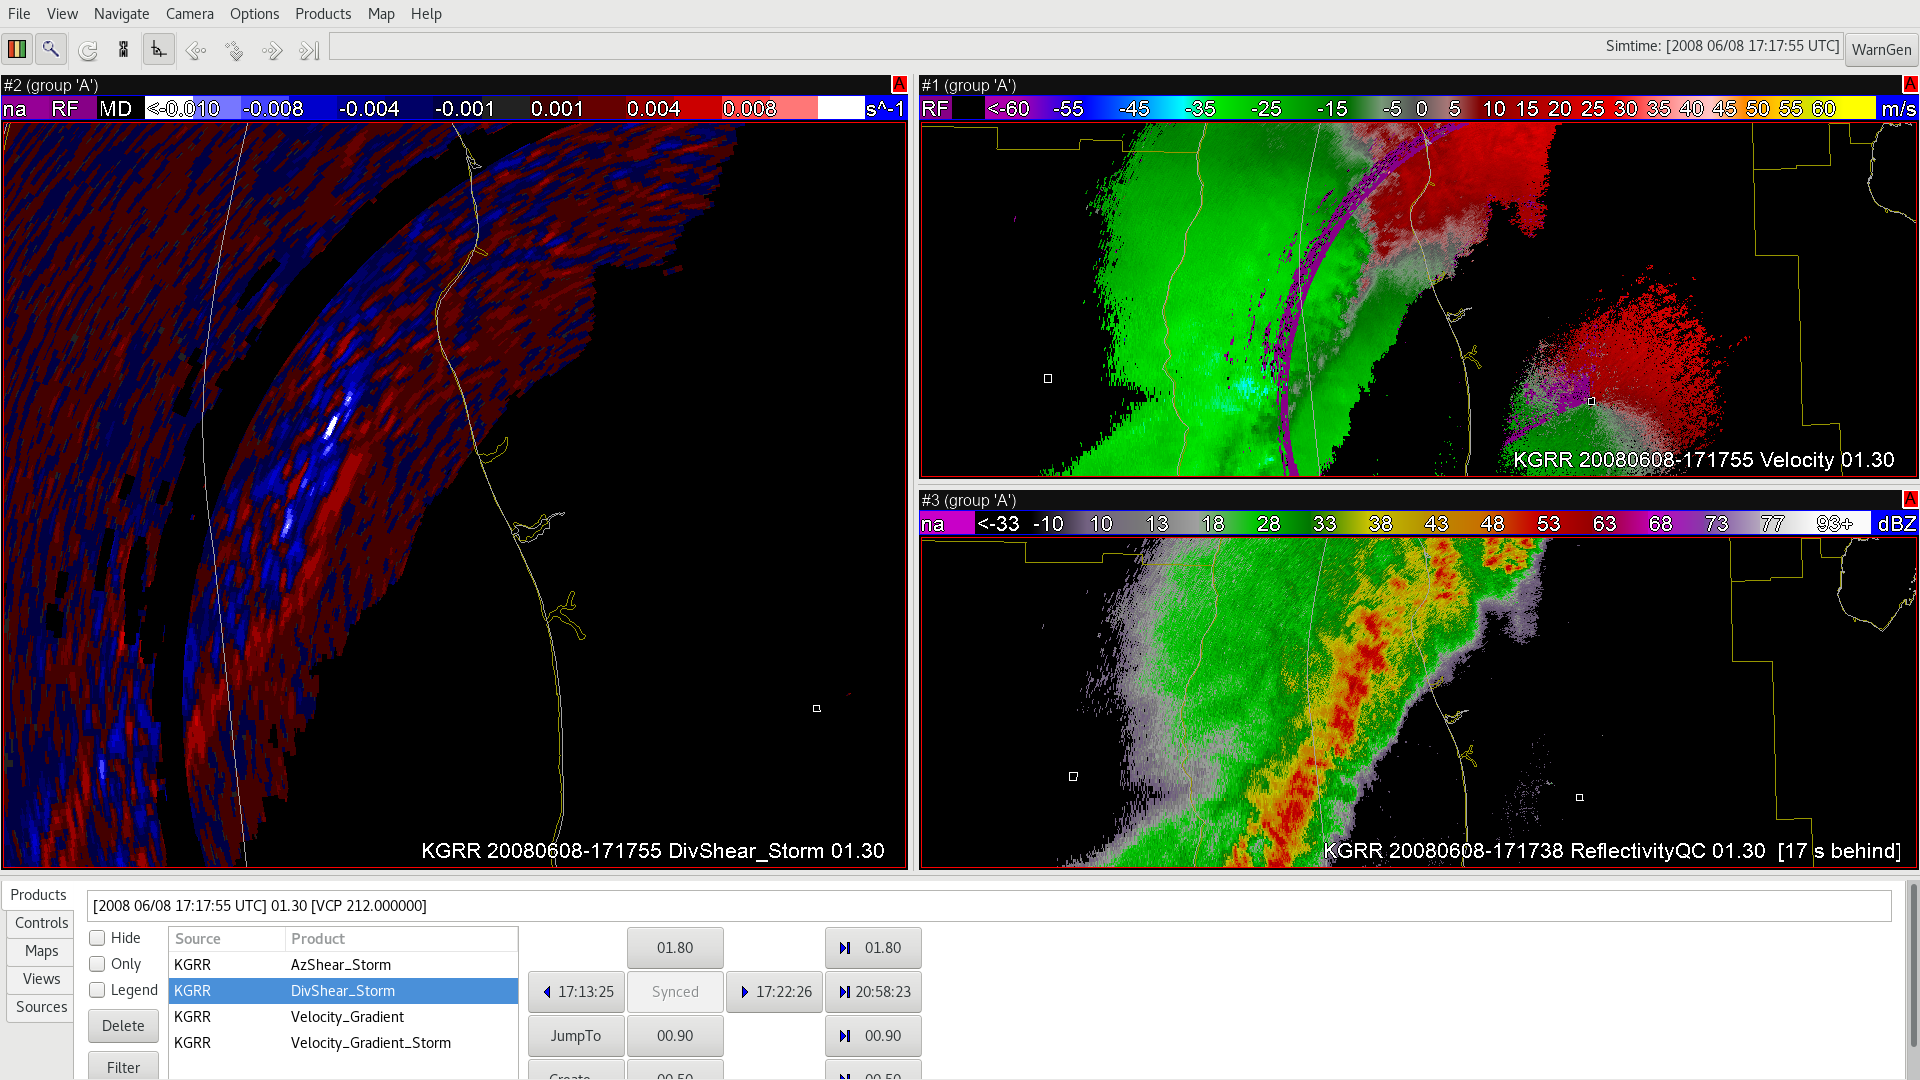
However, DivShear has really taken up the slack here with a strong convergence signature…

Finally, again putting it all together, we see a very clear signal in the Velocity Gradient showing the best superposition of cyclonic shear and convergence (white area). This is absolutely huge for diagnosing mesovortex evolution since we often see a shifting balance between convergence and azimuthal shear and we can use something like Velocity Potential to get it all at once.

I really appreciate the efforts of Thea and others here who made this dataset available on such short notice. They also showed some examples of these products with tornadic supercells that blew my mind.

#MarfaFront


Velocity Gradient – A product that is even cooler than it sounds

What’s even better than AzShear?

AzShear + DivShear = Velocity Gradient

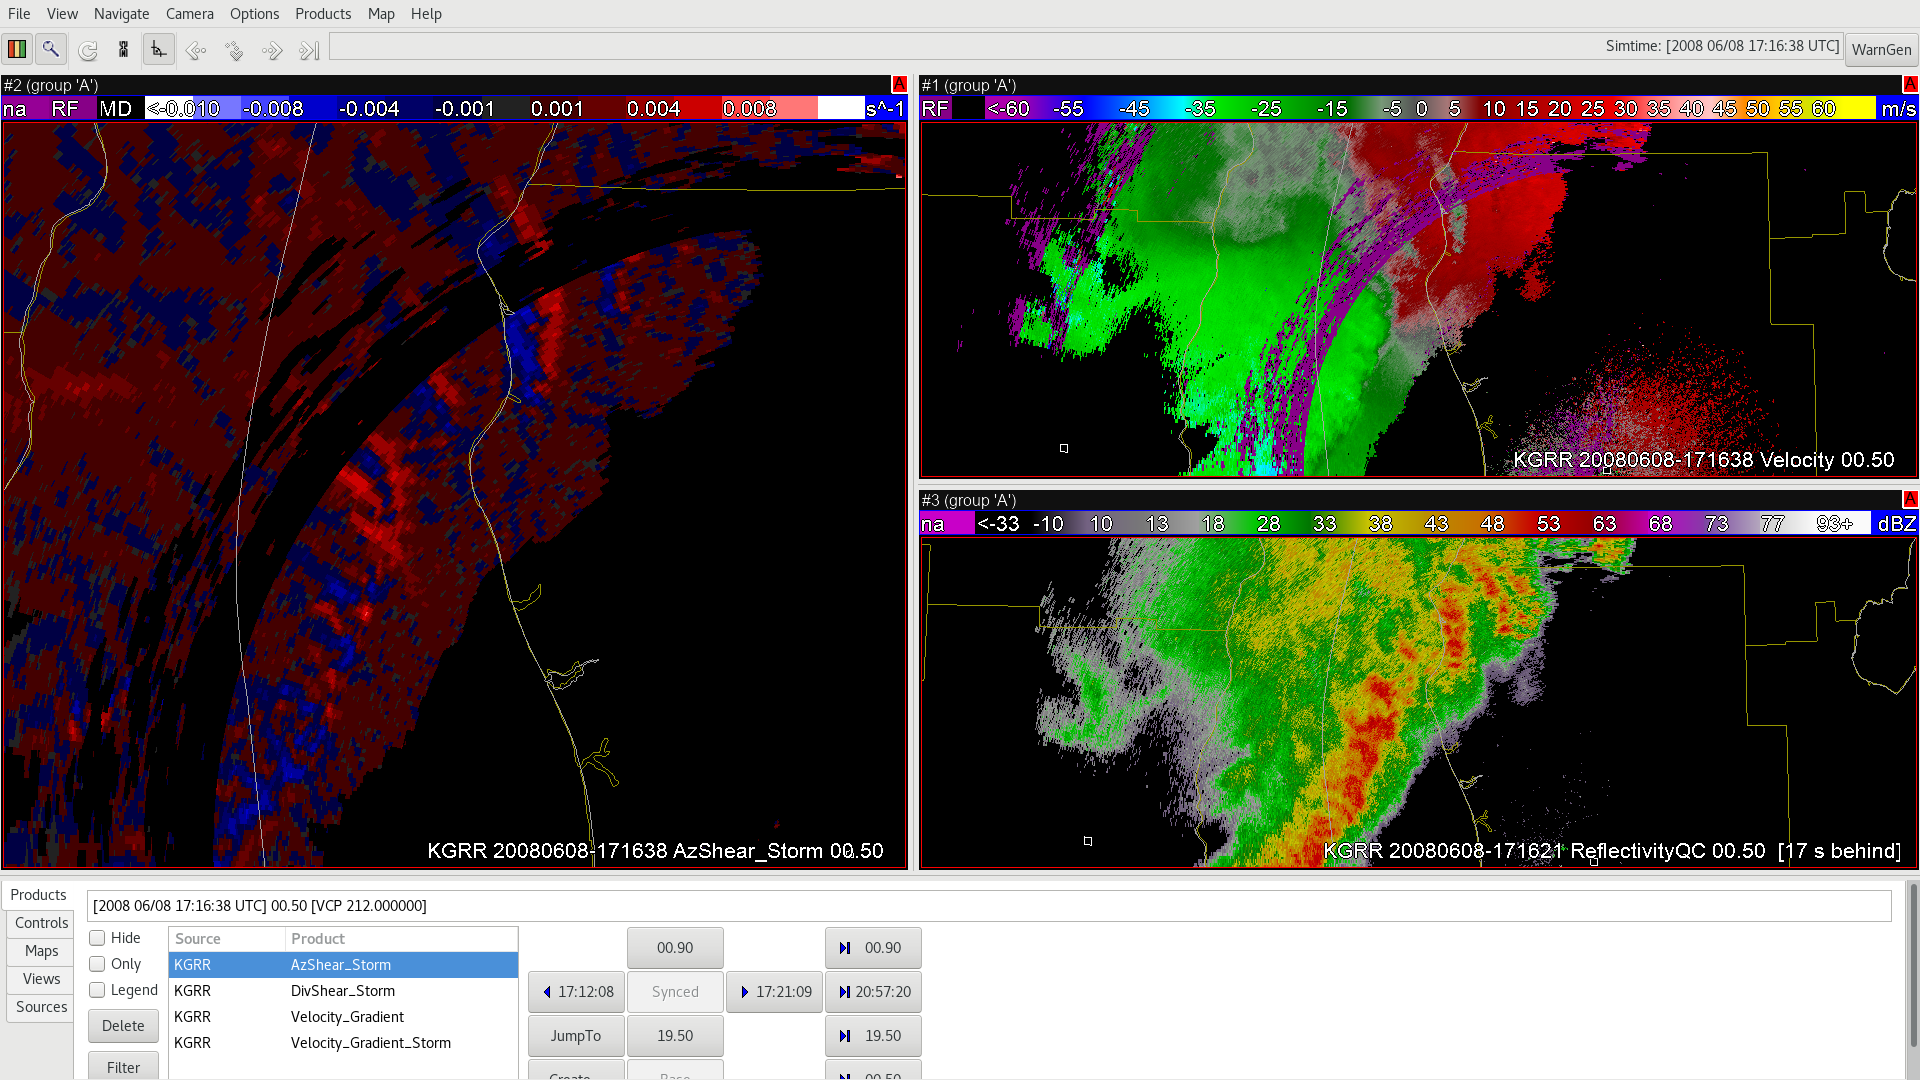
Below is a look at AzShear down low with an approaching QLCS. Fairly noisy right?

Here is another view using DivShear – in other words, divergence along a radial similar to how shear is computed across radials. The convergence (i.e., negative divergence) shows up nicely, eh?

Now combining those fields together with Velocity Gradient, things really start to jump.

Look how well DivShear works with MARCs , too:

Certainly better than AzShear when it comes to mid-level convergence…

And then putting them together for Velocity Gradient…


Now, closer to the QLCS “summit”, we see fairly coherent DivShear…

And this is how Velocity Gradient shows it.

Hoping to show some extremely cool results with these fields involving a QLCS mesovortex later in this case if time permits…

#MarfaFront

My AzShear Manifesto

Those of us who use GR2Analyst already have access to AzShear via its NROT product. I stated elsewhere that the negative values are important, and here I’ll attempt to explain why.  Below is a schematic of a Rankine vortex, which is akin to a rotating cylinder. Radial velocities are maximized at the edge of the cylinder and then drop off as an inverse  function  of range.
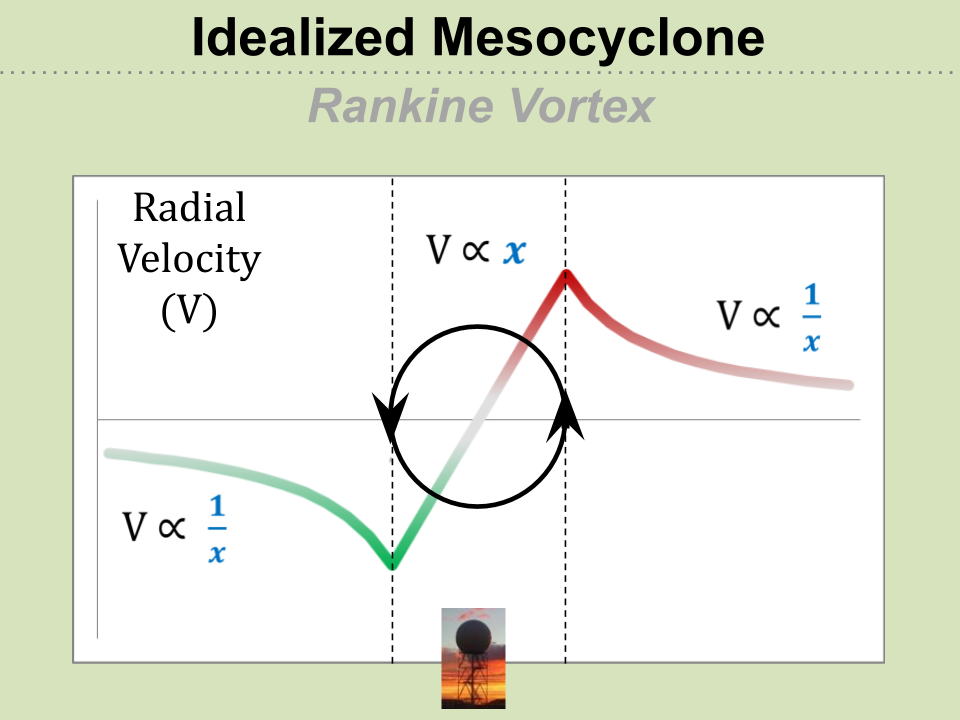
We know azimuthal shear is positive across the entire “cylinder”….
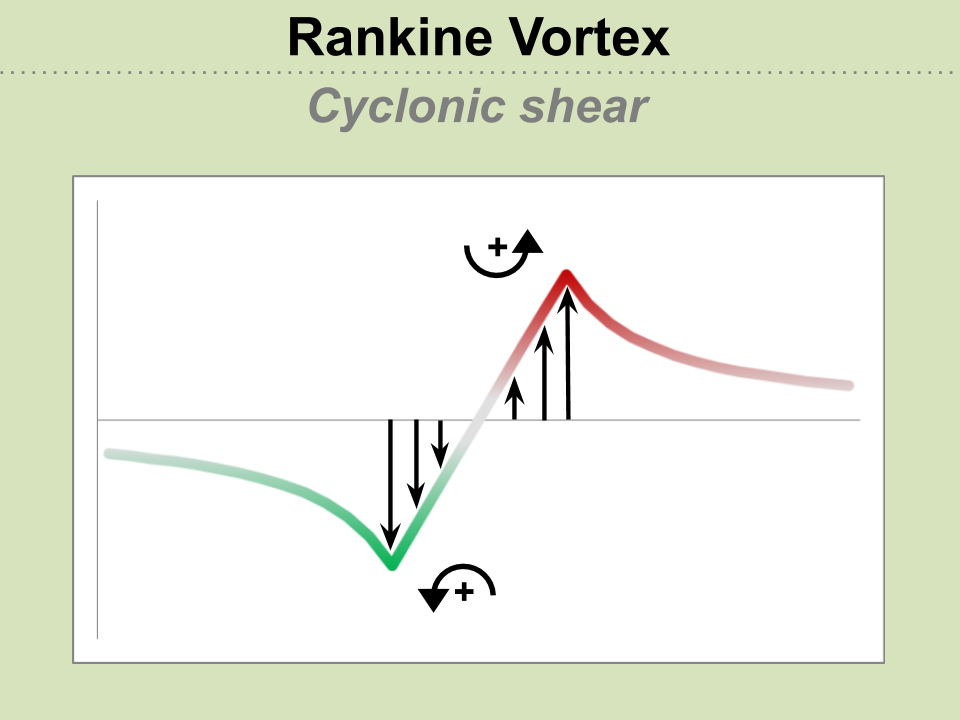
What about just outside the cylinder? If you look closely, you’ll see that there are *negative* AzShear regions on the radials that are just outside of the max/min radial velocities positions…
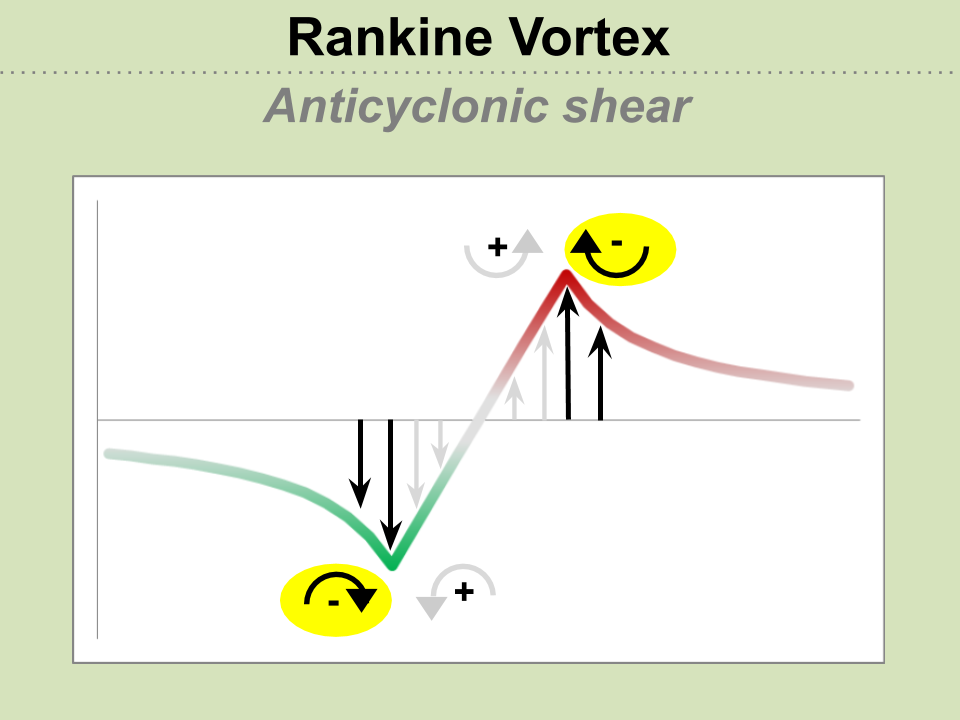
Putting it all together and thinking of azimuthal shear as a running average of shear as we move across the radials, we get a plot of AzShear that looks something like the black trace below.
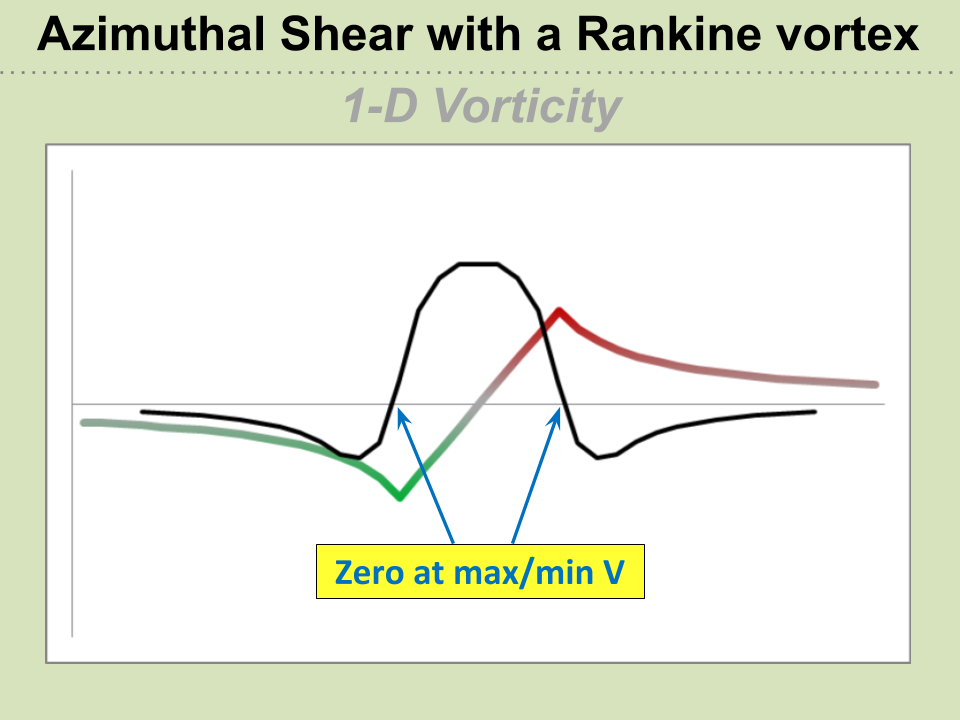
We see slightly negative AzShear regions flanking the AzShear maximum, which would be observable for a well-sampled mesocyclone, such as seen on the right hand side of the image below…
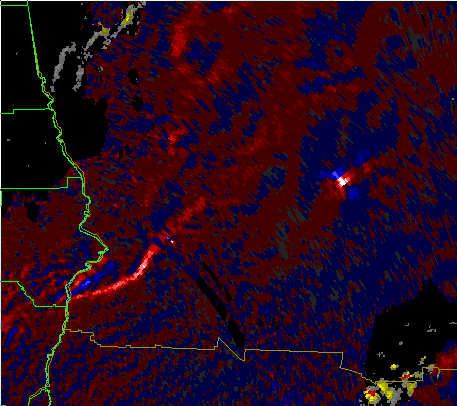
Also notice in the figure above that the maximum inbound/outbound velocities line up with where AzShear crosses zero.  Now, let’s pretend we have a rear flank downdraft or RIJ surge by boosting the “inbound” side of the circulation…
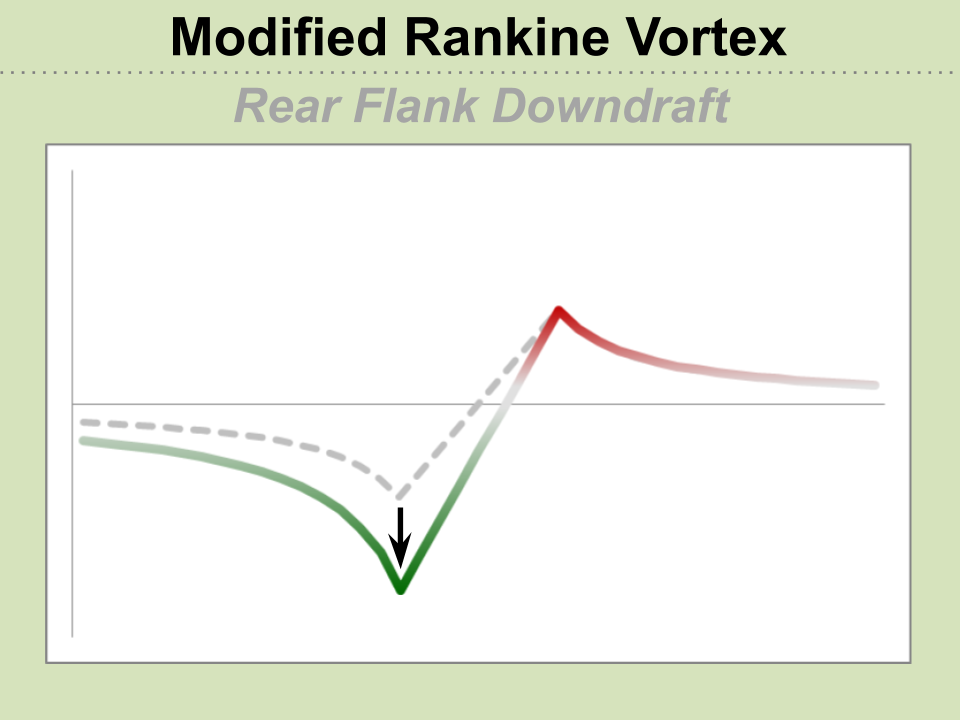
 

Now what does the new AzShear trace look like?
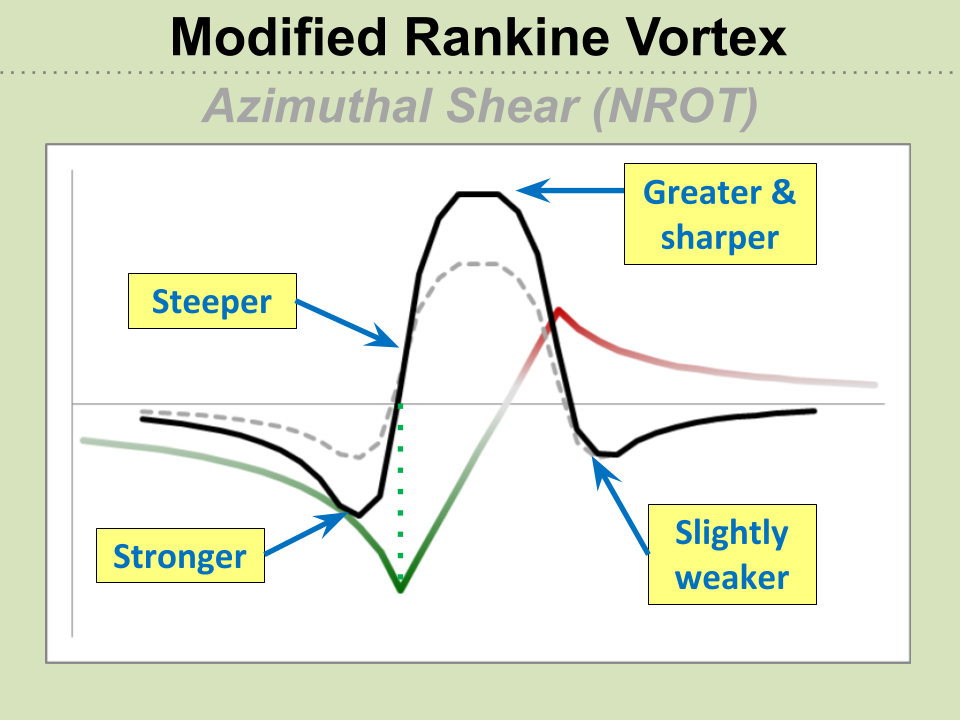
Well, we see more of an AzShear “couplet” as both positive *and* negative shear increase on either side of the surge. The maximum winds are still occurring where AzShear equals zero and this is located directly in between the AzShear maximum and AzShear minimum in conjunction with the center  the surge.

I’m firmly convinced that looking between these two features is an effective way to pinpoint where the most damaging wind will occur, whether it’s tornadic or straight-line. For the smaller tornadoes that most of us get, the southern edge of the AzShear maximum is a sweet spot that has the cumulative effects of rotation, translation, and inflow to maximize winds.

#MarfaFront
 

Using AzShear to Forecast for Large Areas

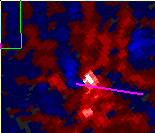
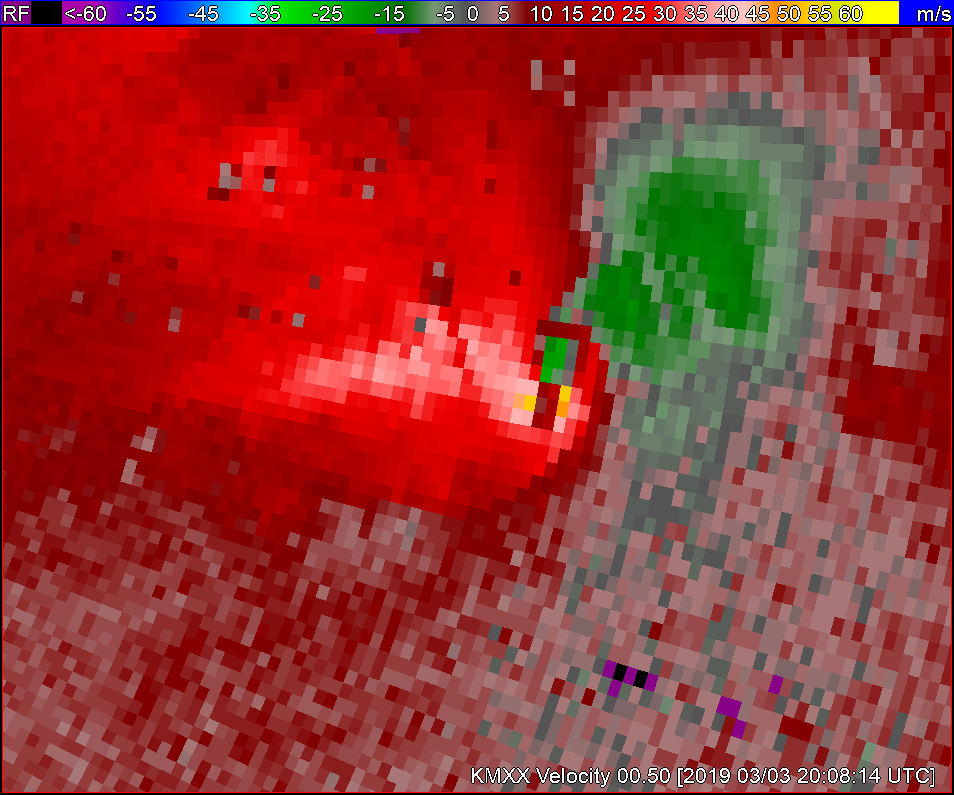
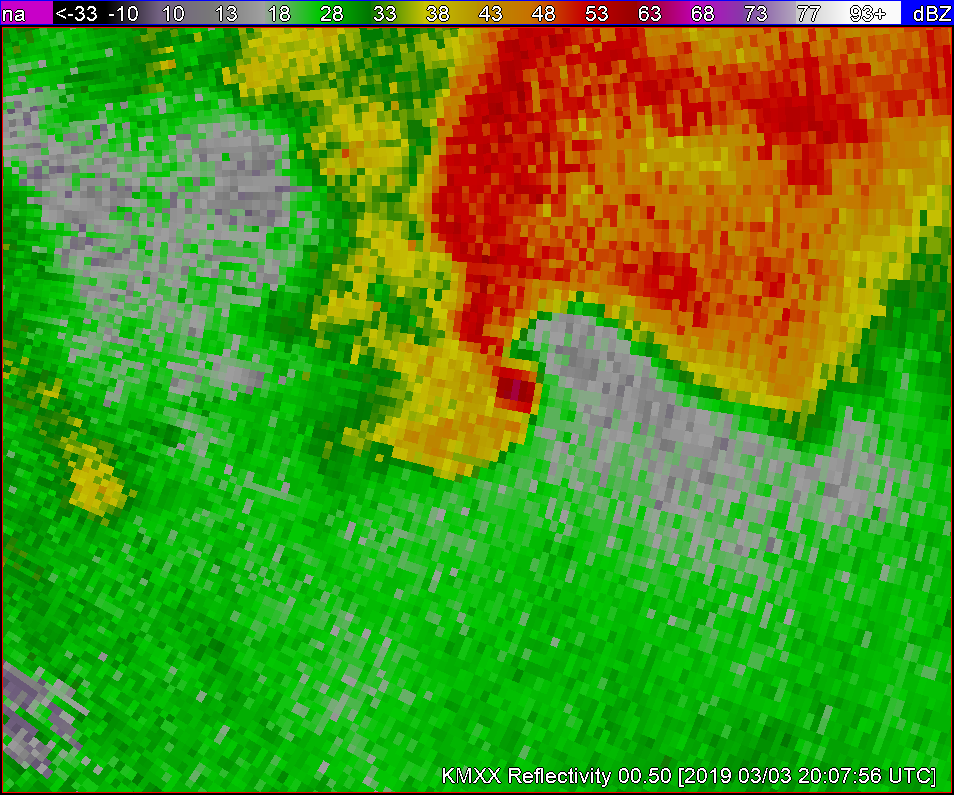
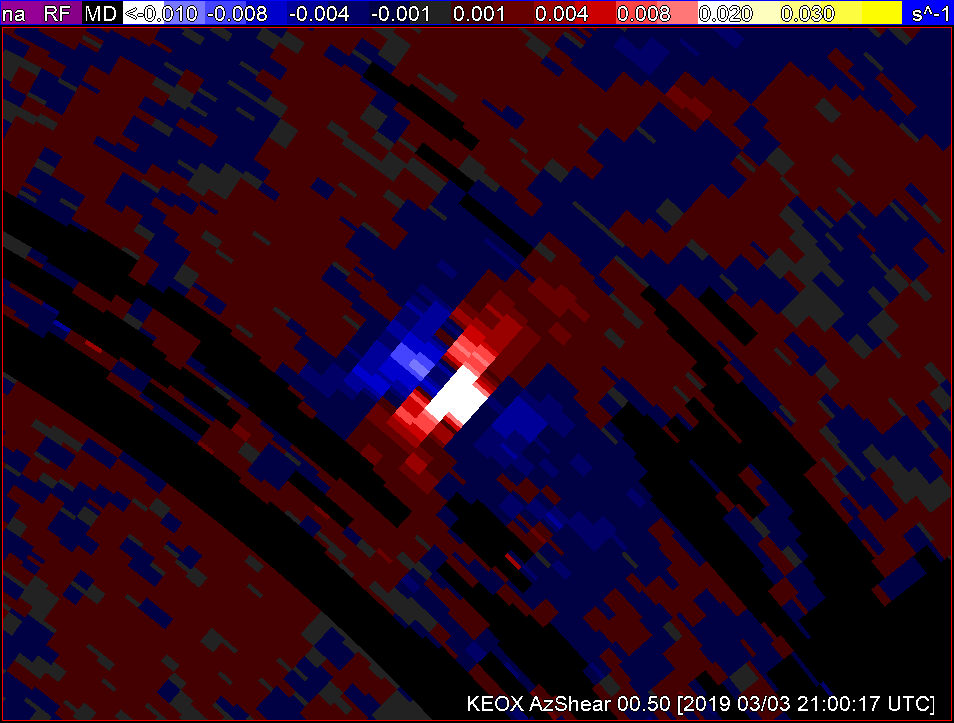
Analyzing the tornadic signatures on the KMXX RDA. This storm is quite obviously already tornadic with an apparent hook echo on reflectivity as well as very strong gate to gate velocity couplets through multiple levels. If I were to use AzShear in conjunction with the plethora of other available tools I would want the product to help me identify areas that are not as well developed as others.

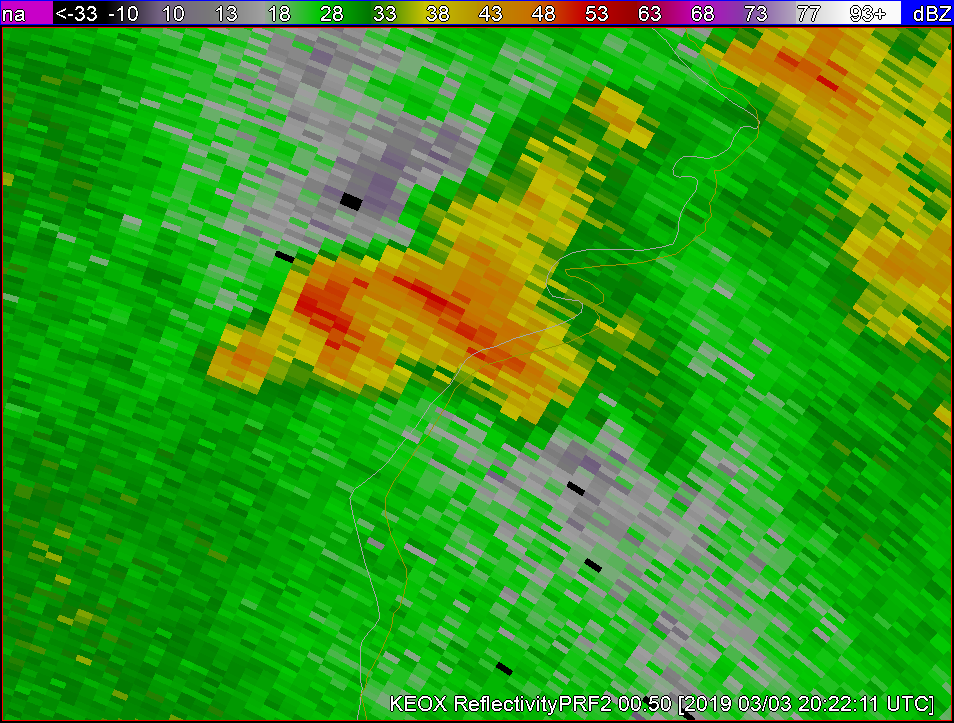
In a case like this I’m not sure how much AzShear would help me forecast what is an obvious tornado. But as I am usually responsible for a very large area to METWATCH I decided to switch to the KEOX radar and zoom out to see if AzShear would help to identify areas that aren’t such a ‘slam-dunk’.

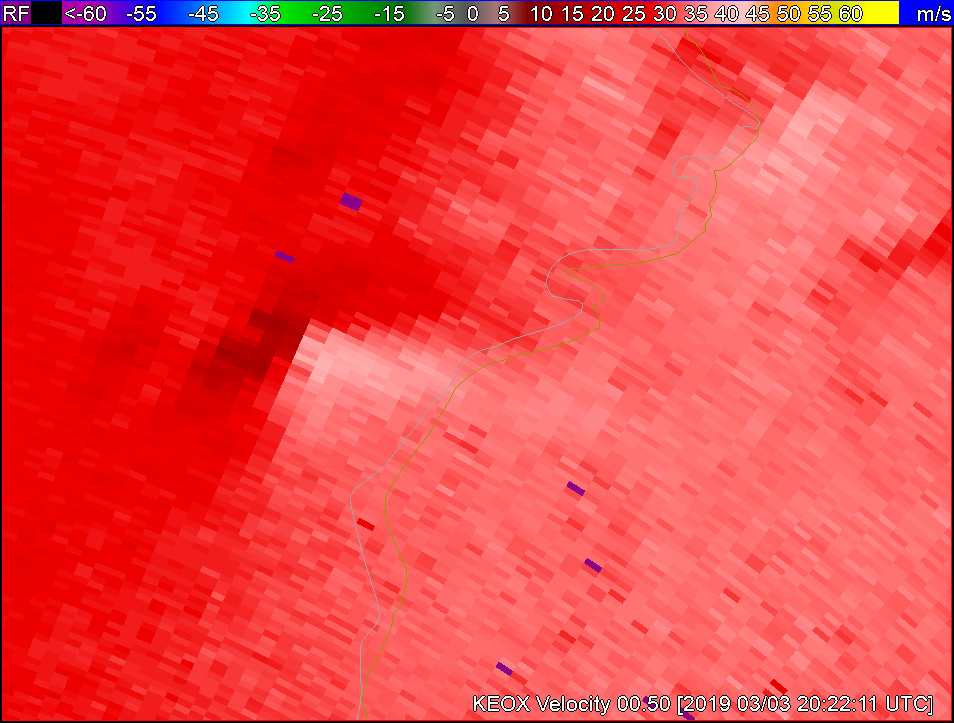
This storm to the NE of the RDA doesnt appear to be anything more than a lower threat general thunderstorm on first glance, especially when compared to other storms in the area.

Velocity doesn’t show anything too crazy either.

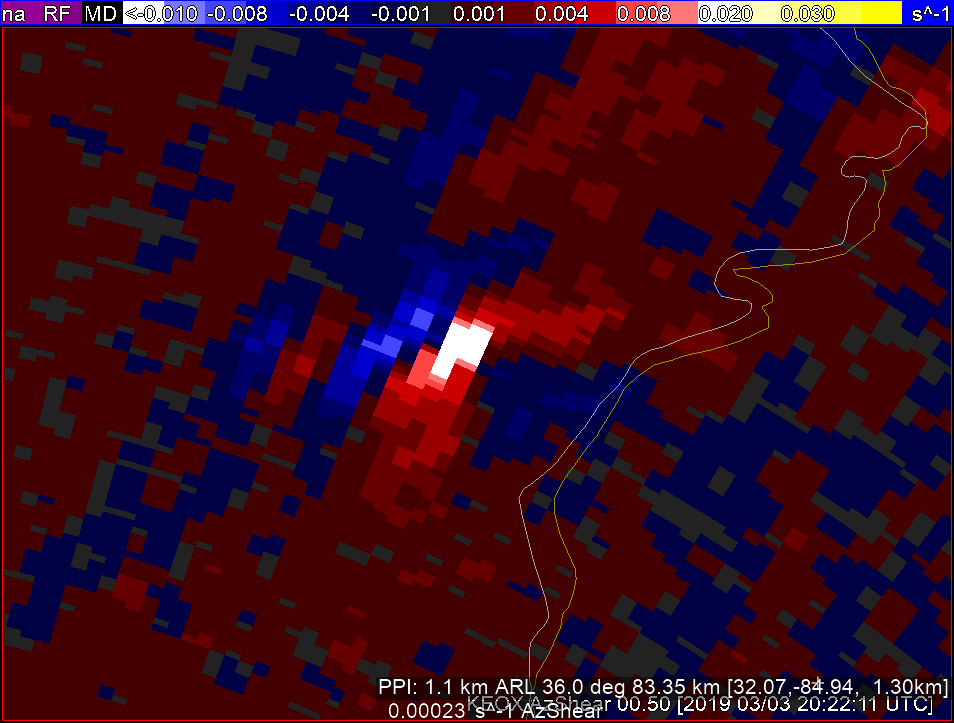
BUT when I look at KEOX AzShear  there seems to be an area of shear that may lead to something…Lets see…

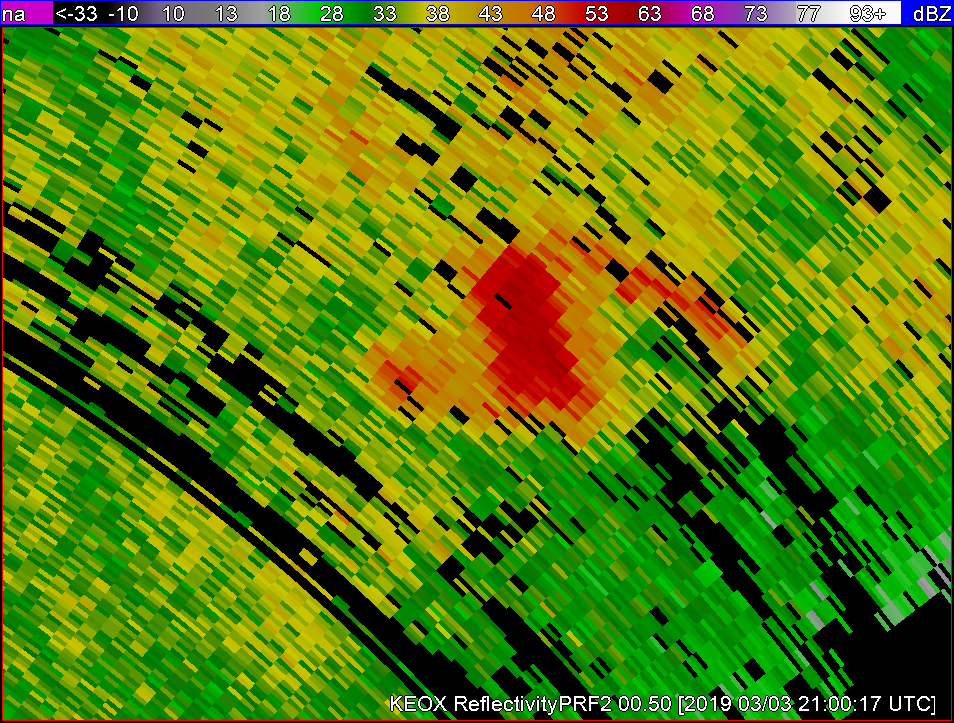
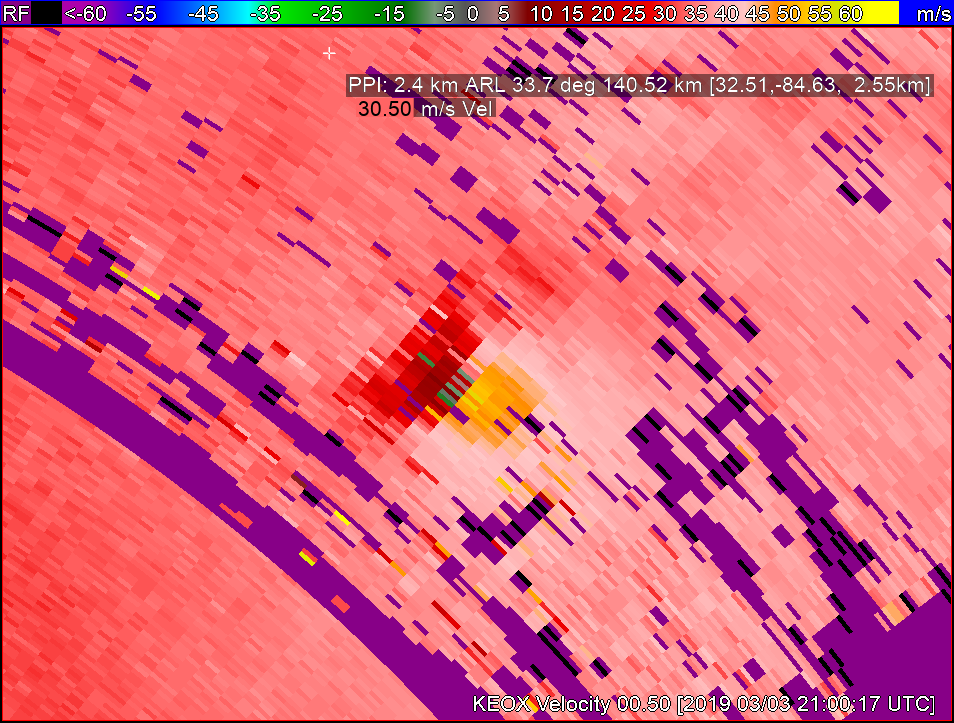
Following the same storm for 40 minutes  I noticed the following: The storm developed into a possibly severe thunderstorm with reflectivity dBzs in the low to mid 60s, significant velocity couplets as well as continued higher AzShear.

For the purposes of how I am required to warn customers, generally 1.5hr required lead time icelyfor a hit within 5nm, this 40 min advanced notice of a storm that has increased severity significantly would be invaluable when added to my stable of available tools to use.

***Desmond***