
Lightning data in the Texas panhandle late this afternoon showed low correlation between GLM output and data from ground based lightning networks. The output from the GLM flash extent density product appears underdone when compared to data from ENTLN, which has numerous areas of clustering in the vicinity of stronger thunderstorm updrafts. Meanwhile, the GLM flash extent density data shows low values and not much variance within the same general vicinity. The problem does not appear as significant in western Oklahoma where the GLM flash extent density product shows much higher values in concert with clustering in the ENTLN data. It is difficult to pinpoint what might be causing this issue just by looking at the data alone.  Dave Grohl
Author: Kristin C
Comparison of ENTLN and GLM Lightning Data
 Storm of interest is the supercell NW of Childress, TX. Increase in ENTLN lightning occurred before a substantial increase in the 0-2 km and 3-6 km MRMS azimuthal shear. The signal in the GLM flash extent density product was muted in comparison to ENTLN data. ProbTor went from 12% at 2124Z to 52% at 2130Z. At 2140Z, ProbTor peaked at 91%, which corresponded with the maximum 0-2 km MRMS azimuthal shear (0.20 S-1) associated with this rotation track. I frequently use the ENTLN data in operations and am trying to incorporate GLM products.
So far, the most useful GLM components, largely because of their visual representation and relationship to updraft growth rate or intensity, are the flash extent density and total optical energy. These two products helped me maintain situational awareness on individual storm intensity trends. Plotting the flash extent density and total optical energy in a four panel with GOES IR imagery and base radar data, I can quickly decipher which storms pose the greatest risk for severe weather. Roy
Azimuthal Shear and Lightning Trends Prior to Tornado
Pair of supercells exhibited intensification as they tracked northeast through the eastern Panhandle of Texas. MRMS azimuthal shear ramps up to slightly over 0.010 S-1 near time of a reported tornado from the more eastern of the two supercells. The GLM event density data also increases prior to or near the time of the tornado between 1950z – 2000z (upper right panel). Comparing to the ENTLN lighting flash frequency (1min data), an jump was noted peaking 1947Z before it dropped off and remained lower through 2000Z (36 count to 15 count). To summarize this data, there was a jump 10-15 min before the tornado, then a drop off, and then another jump 10-15 min after the tornado.
 0.5 storm-relative velocity couplet was strongest with the eastern of the two primary mesocyclones. Spectrum width (low right panel) displays a consistently strong signal of wind speed variance with the eastern tornado producing mesocyclone.
 The tornado component of Probsevere jumped significantly before the tornado touchdown. At 1944Z the probability was at 7%, then quickly increased to 46% by 1948Z and peaked at 54% at 1952Z.
-Roy
Bad Velocity Data Trips Alogrithms
 Just after 20z on the eastern fringe of the LUB CWA, the KFDR radar indicated an area of very high inbound velocity. However, this data is in question as the elevated velocity occurred in an area of low Z and high SW, and likely not representative of the actual storm. This may have been caused by a side lobe. This had cascading affects with algorithms being tested which could not filter out the bad data. Low level az shear spiked to over 0.01 in a group of stationary pixels. This caused algorithms that ingest the az shear product to spike including ProbTor which increased to over 90%, as well as CPTI which showed lower end probabilities of a violent tornado in progress.
Dave Grohl
the California convection that could actually convect
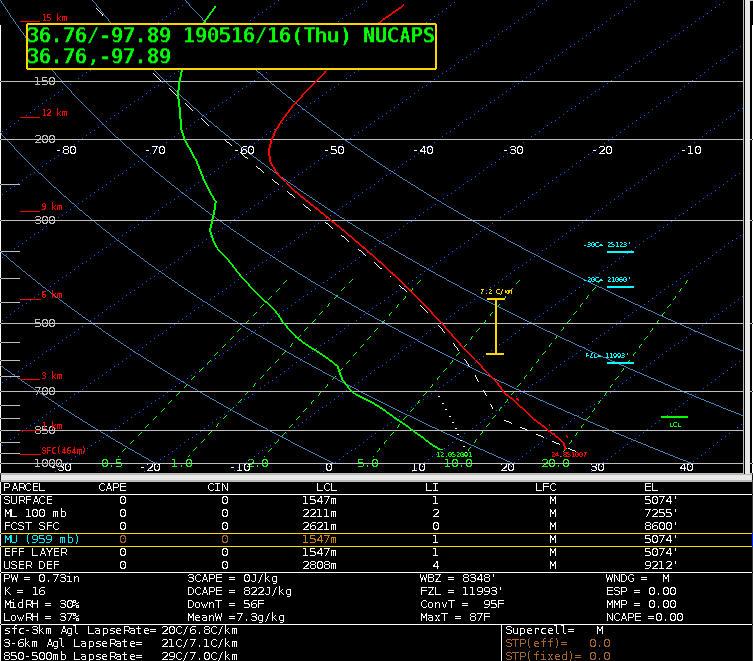
A late season trof moving onto the west coast has everyone east of the Rockies excited for tomorrow and the weekend. It is associated with an unusually late season and significant rain event throughout CA with afternoon storms scattered about in the central valley, deserts, and Sierra Nevada. The GLM was able to detect lightning in several storms in CA and NV. NOAA-20 made an overpass around 21Z and provided several viable soundings in the San Joaquin Valley and near the CA coast.
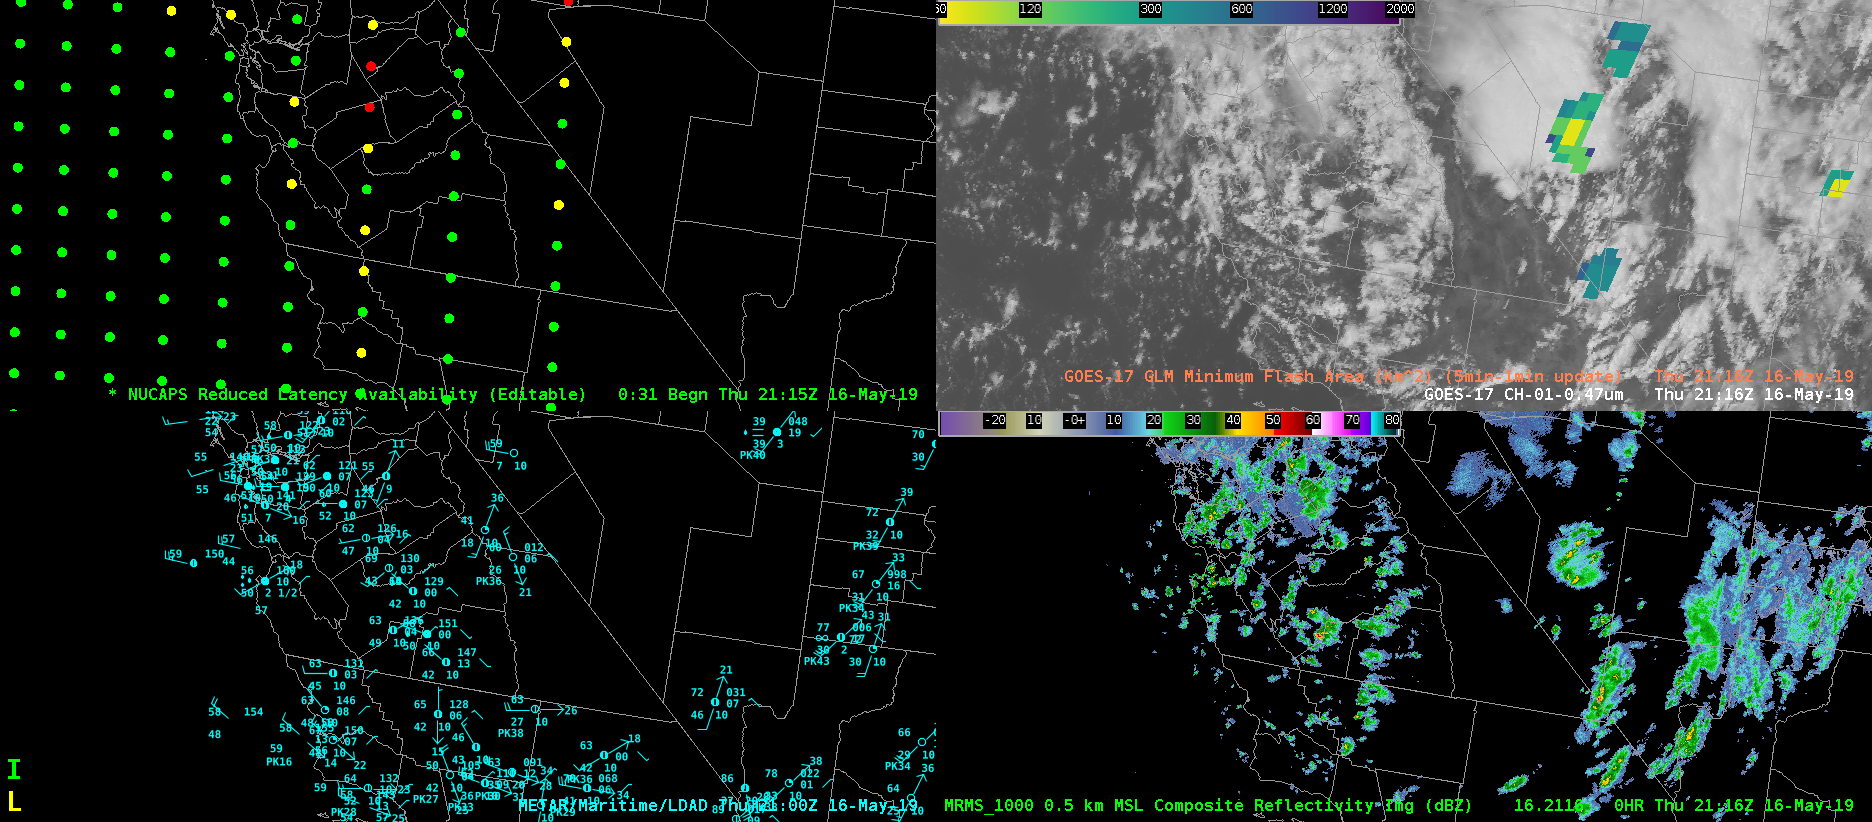
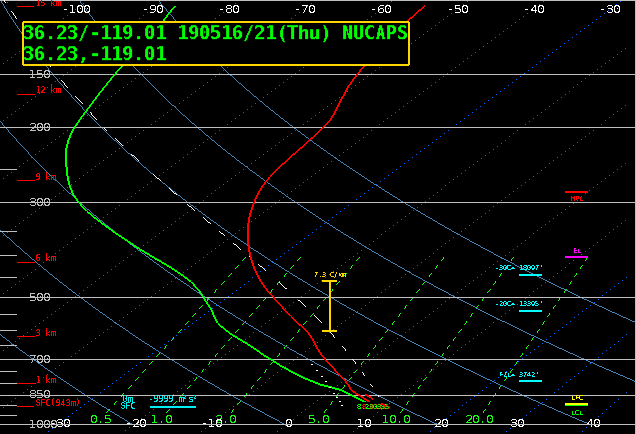
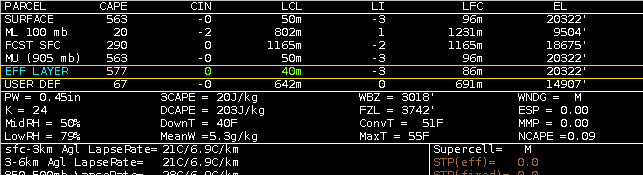
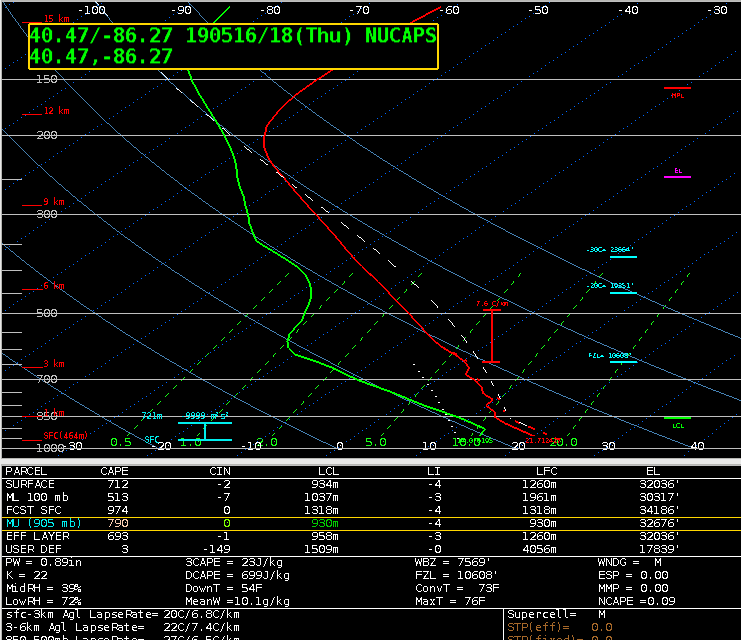
The NUCAPS sounding centered in Tulare County is shown below. MUCAPE values on the order of 563 J/kg were supportive of low-topped thunderstorms. Neighboring soundings indicated similar or slightly reduced values of instability. With the focus on severe convection east of the Rockies, it is nice to see NUCAPS perform so well in a completely different region and dynamical regime (namely post-frontal open cellular convection).
Brian Kahn
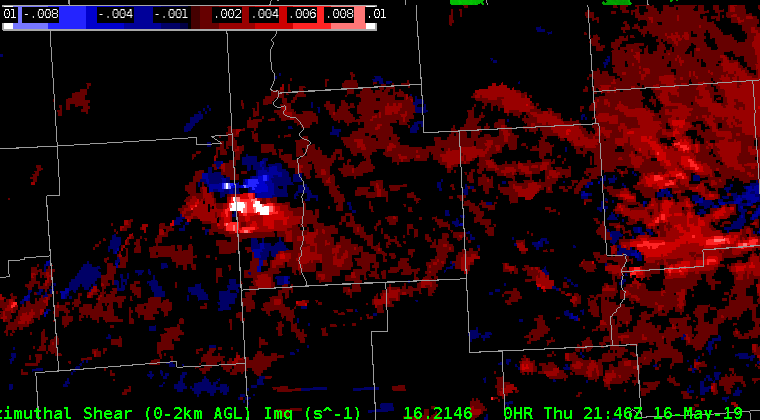
Vertical Data Smearing – the bane of AzShear’s existence
All right, maybe that’s a bit over-dramatic, but at least I got you still reading. I’ve discussed elsewhere the sensitivity we’ve seen with low level AzShear and Rotation Tracks when it comes to surface features such as outflow boundaries or artifacts such ground clutter. Here we see sensitivity to what’s going on above – i.e., velocity data with a high reflectivity mesocyclone aloft being smeared downward with sidelobe contamination. To illustrate…
KIND 3.1 degree Z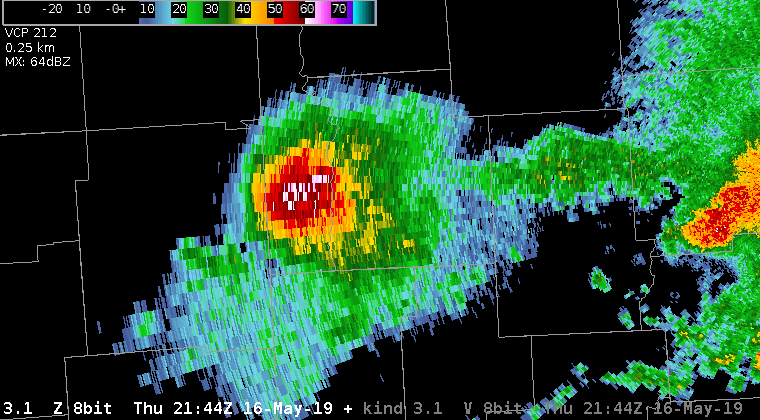
|
KIND 3.1 degree V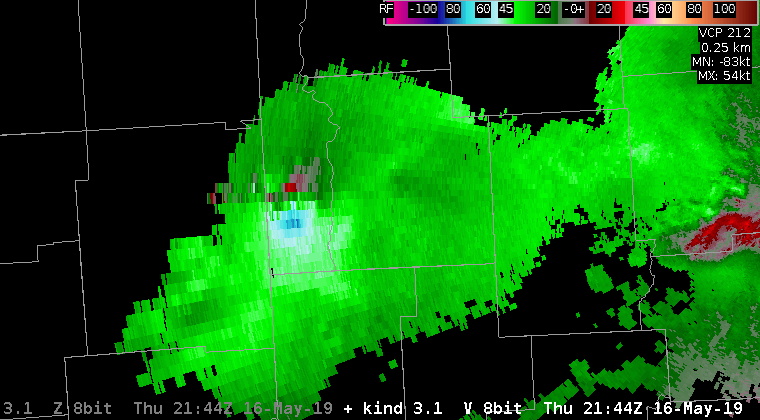
|
KIND 0.5 degree Z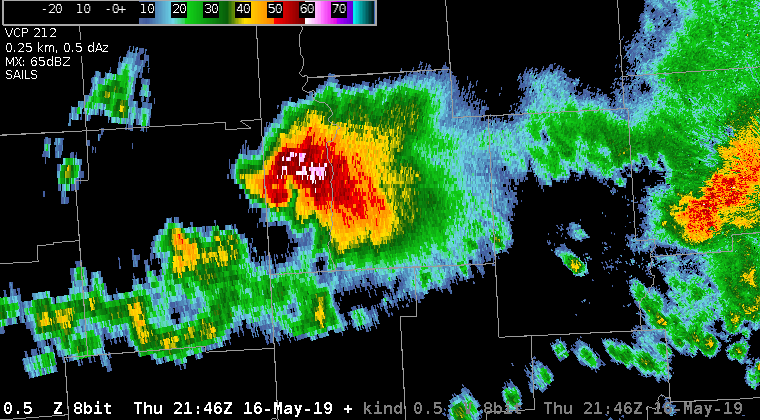
|
KIND 0.5 degree V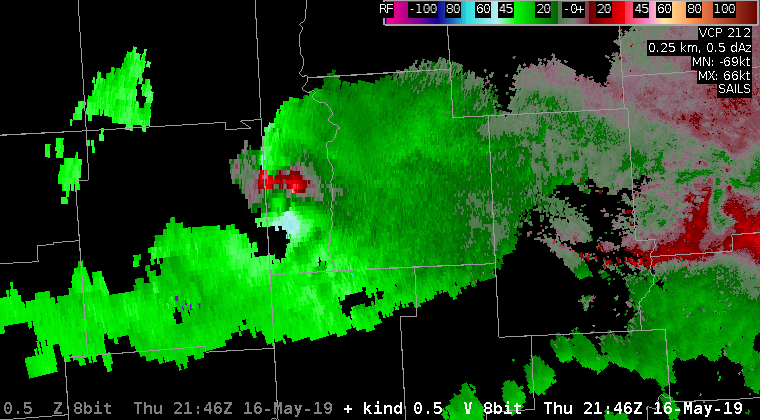
|
So, it’s fairly evident that velocity is being contaminated down low. Unfortunately, this also affects the AzShear calculations…
Just something else to be aware of…
#MarfaFront
A Day to Compare
I initially wanted to compare model data, especially skew-t’s, that I usually use, to the NUCAPS products. My purpose was to ascertain the feasibility of replacing or supplementing point based model products with NUCAPS. As I was unable to access the model data I use daily I decided to compare NUCAPS with NAM and GFS.
First the comparisons in the rapidly changing thunderstorm environment in which I interrogated a large MCS over the Illinois/Indiana border.
I compared NUCAPS 18z skew-t (from clear air area) to NAM and GFS skew-t’s, at the same time and location.
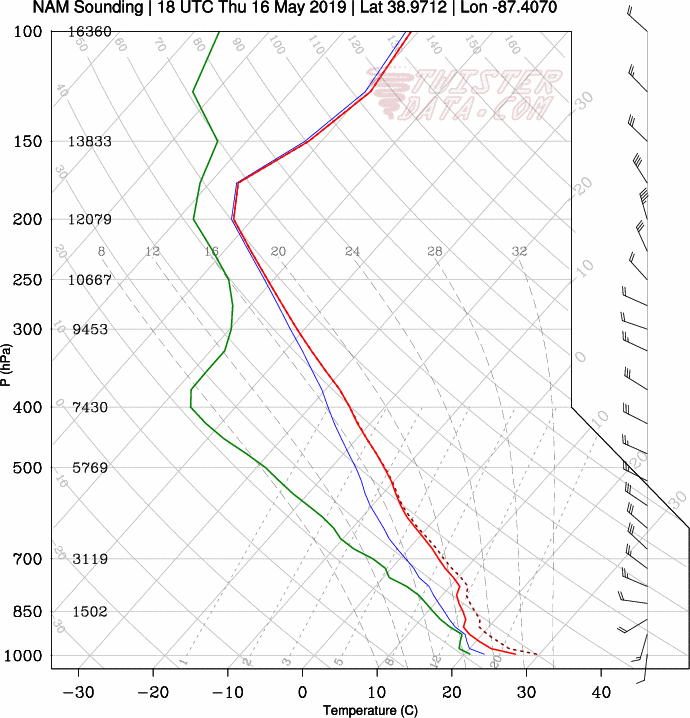
NUCAPS presents a much more stable and dry environment than the model skew-t shows, and also much more stable than the actual current environment considering this storm has already produced hail, tornadoes and heavy rain.
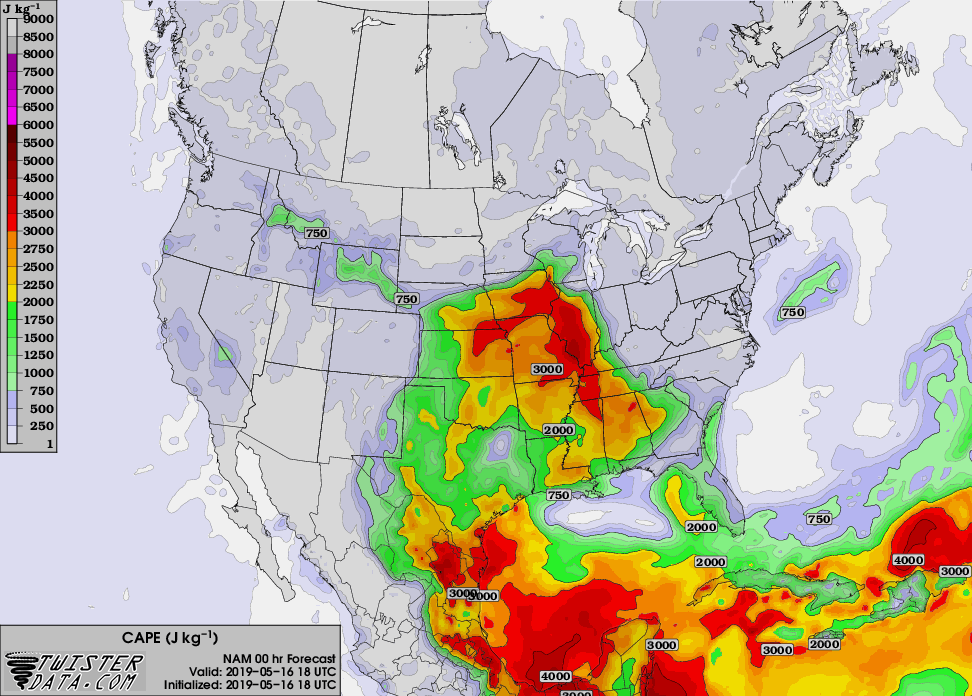
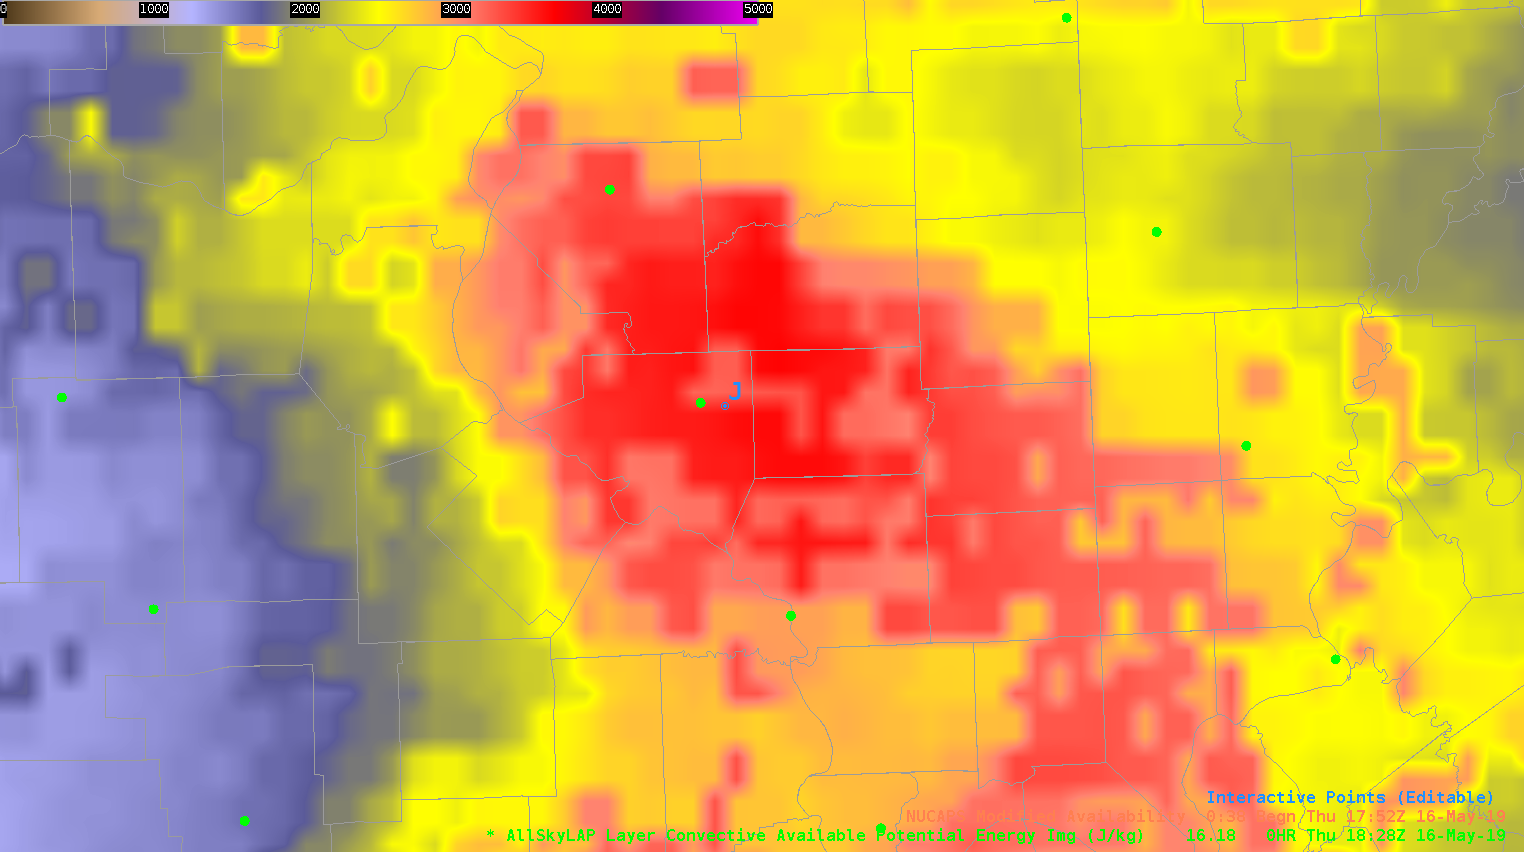 Next, I compared an AllSkyLAP CAPE img at 18z (point J on the above picture), to a NAM CAPE map over the same area/time. AllSkyLAP seems to be about 500J/kg higher than the NAM CAPE map.
Finally, I compared a NUCAPS CAPE img and the NUCAPS Skew-T at 18z over the same area and there was a huge variance. The skew-t was higher than the CAPE img by over 1300J/kg.
Lastly I decided to compare NUCAPS and model data from a stable area, non changing area.
I compared an observed skew-t from the KS/OK boarder to a NUCAPS skew-t. There is a one hour difference in the data but for the sake of this comparison I think this will work. 
The observed skew-t is a relatively dry column with .87pw and a T/D of 31/20C at the surface and 10/-20C at 700mb. The CAPE is at a ridiculous 3746 J/kg. But with no moisture, lifting mechanism nor shear I wouldn’t expect development. When compared to the NUCAPS skew-t one can see a definitive difference. CAPE on the NUCAPS is at 0 with T/D at 24/11C at the surface and 7.9/-9.3C at 700MB which is a huge departure from what the observed skew-t showed…but how would the observed skew-t hold up to a model skew-t?
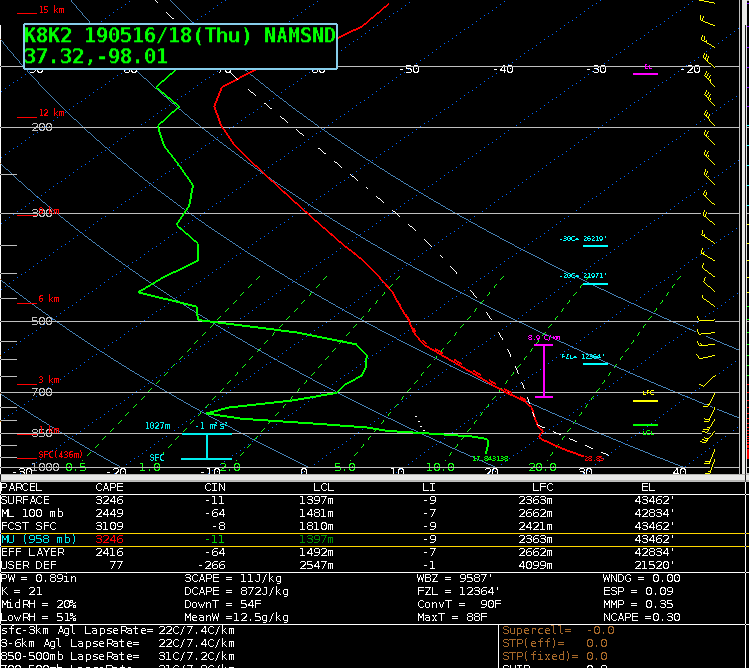 NAM 18Z model skew-t compared to the 17Z observed skew-t from the same area shows 28/17C SFC temps, only 3C off from the observed skew-t and at 700MB NAM shows 9.5/-8C only .5C off the temperature and 11 off the DP. Also, CAPE was much closer than when compared to the NUCAPS where SFC CAPE on the NAM is 3246J/kg and 3746J/kg on the observed.
Overall, after this small sample size of data, both severe weather and in clear weather, I believe that I would continue to use NAM/GFS over NUCAPS for my point based forecast needs.
***DESMOND***
Eye Candy – Nothing More, Nothing Less
#CaptionThis
#MarfaFront
Slight Risk West and East
Operating across the CONUS today with one team of forecasters located in Idaho/Montana in MSO and the other in Illinois (ILX). The forecasters have also been encouraged to investigate the environments nearby their official CWAs including the ongoing MCS currently crossing the Chicago CWA.
For those in Illinois, the environment remains supportive of development off of outflows from the ongoing MCS or other possible convection. Though it remains likely that the MCS will continue to remain strong and pose a threat for strong winds at least across the NE section of the CWA.
For Idaho, it currently remains rather calm, but the CAMS have consistently latched onto expected convection later in the day including supercell storms.
-Kristin
Marginal Day in the HWT
Forecasters are beginning the day located in both the Melbourne, FL and Kansas City/Pleasant Hill, MO CWAs each with very different environments.
Ongoing convection with a focus on lightning is in store for forecasters in the MLB location. A (semi-stationary) frontal boundary across central Florida combined with the sea-breeze and plenty of low-level moisture is providing a decent environment for storms capable of producing lightning and high winds.
Forecasters beginning in the EAX region will likely be diagnosing the environment and pre-convective initiation products for the first half, if not majority of the operational hours today. Later today, we expected isolated convection to develop with enhanced lapse rates and associated increase in CAPE as well as increased low-level moisture. The HRRR doesn’t initiate convection until ~0200 UTC, but hopefully we will see activity a bit earlier.
-Kristin Calhoun