
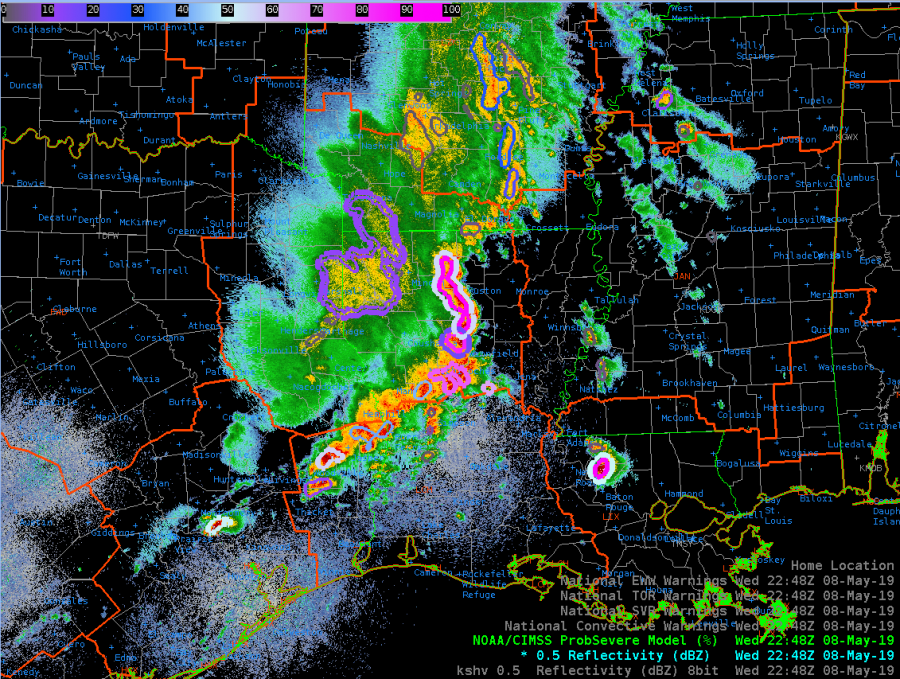
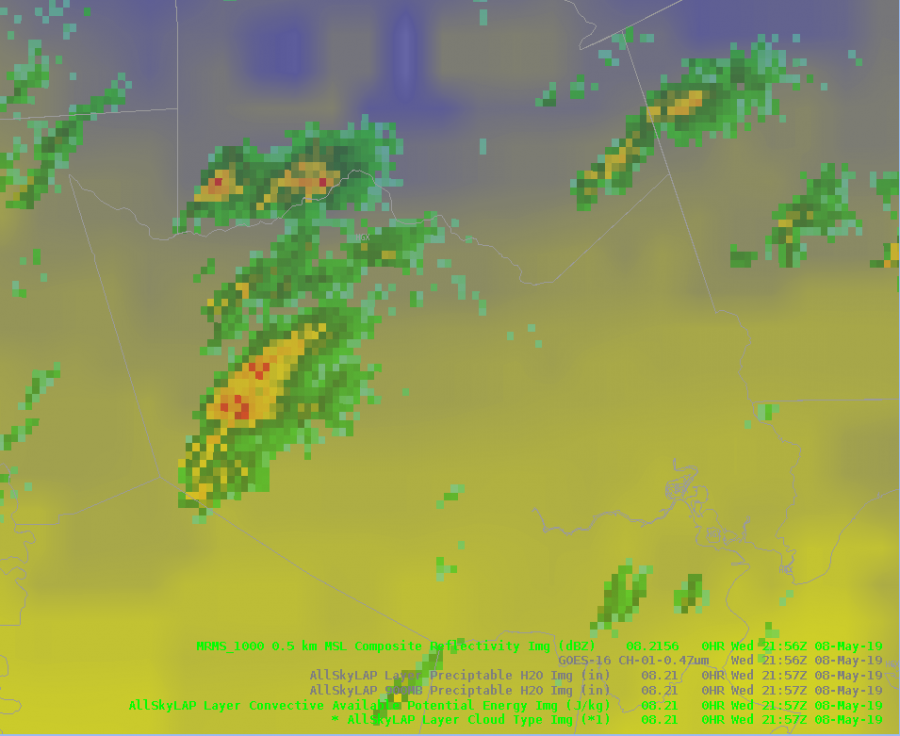
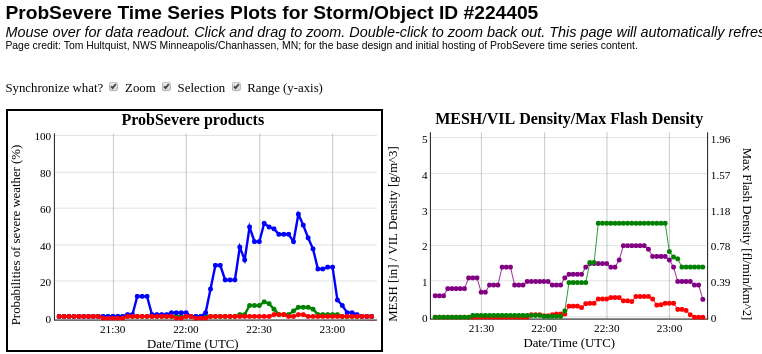
Here is an example where the ProbSevere algorithm identified an area of concern in heavier stratiform rain. ProbTOR values peaked around 12% in this area. This is a good reminder that YMMV when using ProbSevere.
Official websites use .gov
A
.gov website belongs to an official government
organization in the United States.
Secure .gov websites use HTTPS
A
lock (
) or https:// means you’ve safely connected to
the .gov website. Share sensitive information only on official,
secure websites.

Here is an example where the ProbSevere algorithm identified an area of concern in heavier stratiform rain. ProbTOR values peaked around 12% in this area. This is a good reminder that YMMV when using ProbSevere.
In this case of a rapidly developing storm, GLM data was leaned on to issue a SVR Warning on what otherwise may have been a marginal storm. AllSkyLAP showed the storm was developing in an area of MLCAPE values over 2000 J/kg, and ProbWind model had rapidly increased to ~50%. GOES-16 1-minute imagery showed rapidly cooling cloud tops, with a sharp increase in lightning activity. Given GLM values comparable to other severe storms on the day a SVR warning was placed on the storm. The warning was sent out relatively early to try to capitalize on lead time.
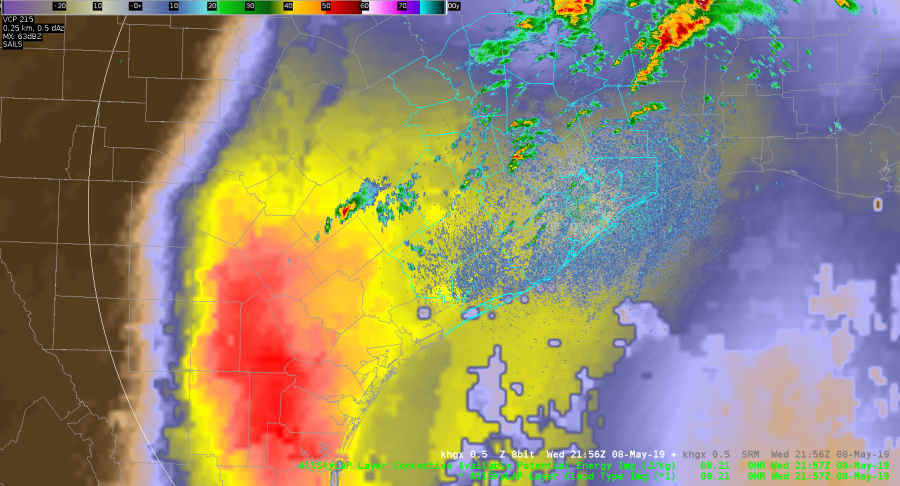
Radar w/ ProbSevere:
IR-Sandwich:
Flash Event Density:
Minimum Flash Area:
Event Density:
Total Optical Energy (too fast, whoops!):
AllSkyLAP CAPE:
ProbWind Model Increase:
UPDATE: Shortly after warning on the storm, it completely fell apart after failing to become rooted in the boundary layer and all indicators (i.e., ProbSevere, GLM imagry) dropped to null. Initial warning was shamefully cancelled.
Really living up up to my name!
Radar w/ProbSevere:
Flash Event Density:
ProbWind Model Increase:
#ProtectAndDissipate
In today’s case, MRMS rotation tracks did a better job at showing where the most likely tornadic storms were in a QLCS compared to the 0-2 km merged AzShear, at least over the entire period which makes sense. I would never warn just based on rotation tracks, but I couldn’t find a better SA tool today. It was easy to step back in after working way too long on a previous blog post and get an idea of what happened while I was away. I still feel like the single-radar AzShear would have been extremely useful with today’s QLCS.
As a good tool for a mesoanalyst, the enhanced gradient for CAPE within AllSkyLAP would indicate an area of focus for discrete convection forming along the southwest flank of the line of convection that fizzled earlier. This area would be a place to focus for future possible convection.
ZDR_Arcophile
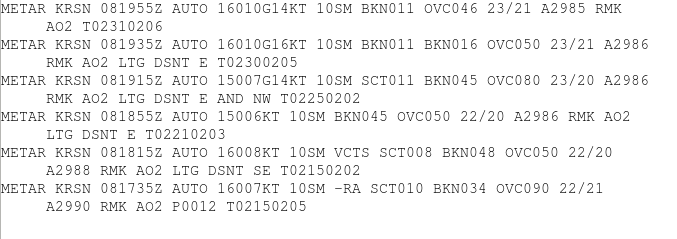
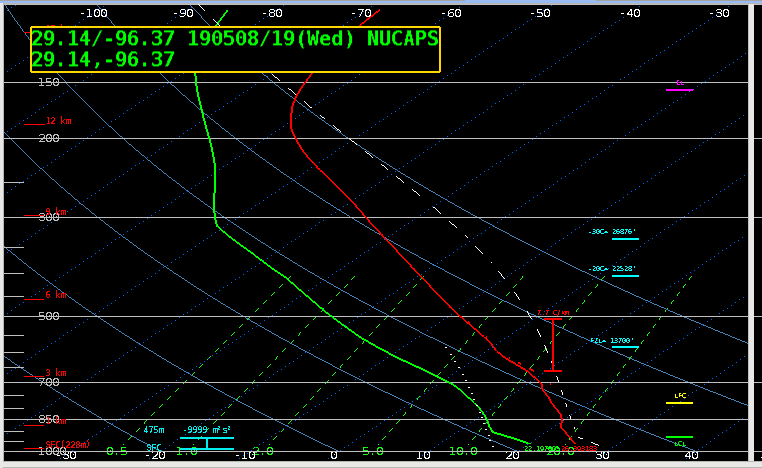
In trying to give due diligence to all of the products I decided to look at the NUCAPS soundings a little deeper today. The location of the sounding point was around 9 mi SE of Ruston Regional Airport in an area that was impacted by a weak line of convection moving across central Louisiana, as shown in the METARS from KRSN.
Both soundings passed the QC checks and were towards the center of the swath. So what did NUCAPS show? Here are the lowest levels of both the NUCAPS and Modified NUCAPS soundings at 19Z…
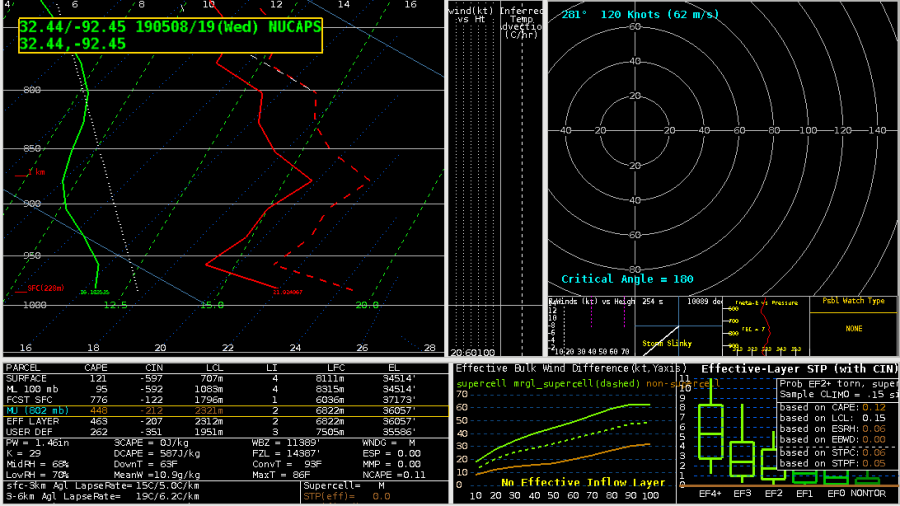
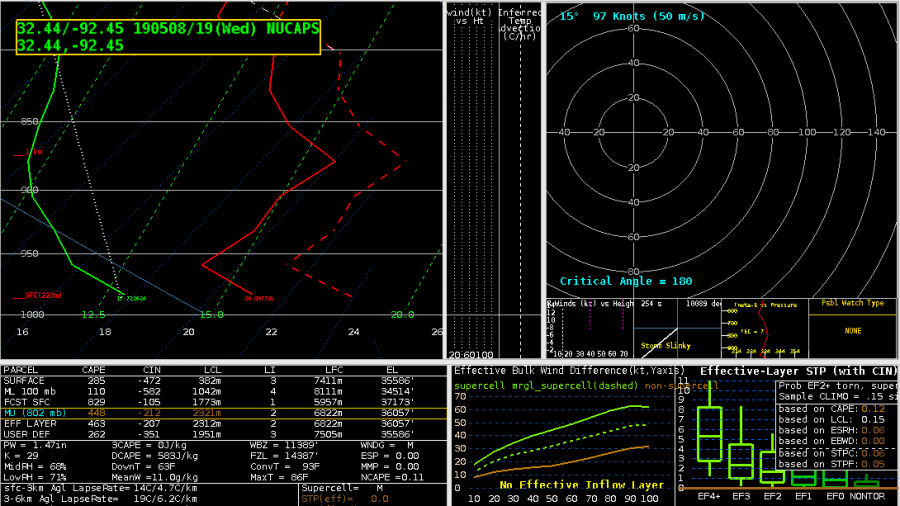
The NUCAPS sounding had a temp of 21.92C (71.47F) and a dew point of 16.18C (61.12F). The modified NUCAPS sounding had a temp of 20.81C (69.46F) and a dew point 17.72 C(63.87F).
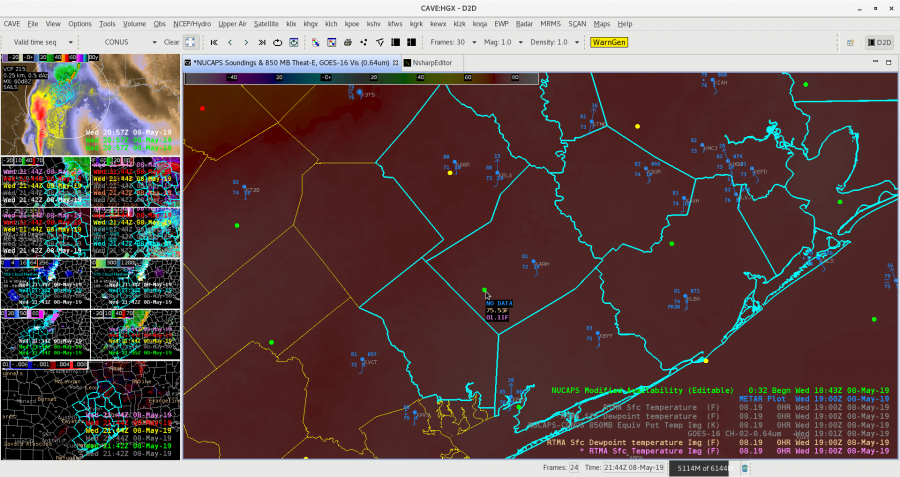
For comparison here are the RTMA temp and dew point between 17-19Z at the sounding point and at KRSN…
T/Td @ NUCAPS T/Td @ KRSN
17Z 72.65F 72.76F
18Z 73.68F/69.49F 74.08F/69.39F
19Z 71.47F/69.93F 73.10F/70.40F
It makes sense that the RTMA dew point depression is small given the recent rains, and if the RTMA is suppose to be the ground truth, it looks like the NUCAPS soundings did a bad job in this case. Temps for the NUCAPS soundings were 2-4 degrees cooler which is okay, but the modified sounding was cooler. It would have probably been better to keep the temp from the unmodified sounding. With regards to dew points, both the modified and unmodified soundings had lower dew points than RTMA, on the order of 6-7 degrees. These definitely affected the thermodynamic calculations, though I’m pretty positive that it was the mid-level inversion that did the most damage. I’m not sure how to fix this since only the surface points get modified.
Anyways, hindsight being 20/20, I probably should have looked at an area that wasn’t recently impacted by rain, but by the time I realized it it was too late and I already gathered all the data. Anyways, both NUCAPS soundings in this case did not accurately represent the environment in the lower levels, likely a result of evaportaive cooling and outflow behind the line of convection. This is a word of caution that despite the soundings passing the QC checks (the points were both green) and being in the center of the swath the data may not be the most useful.
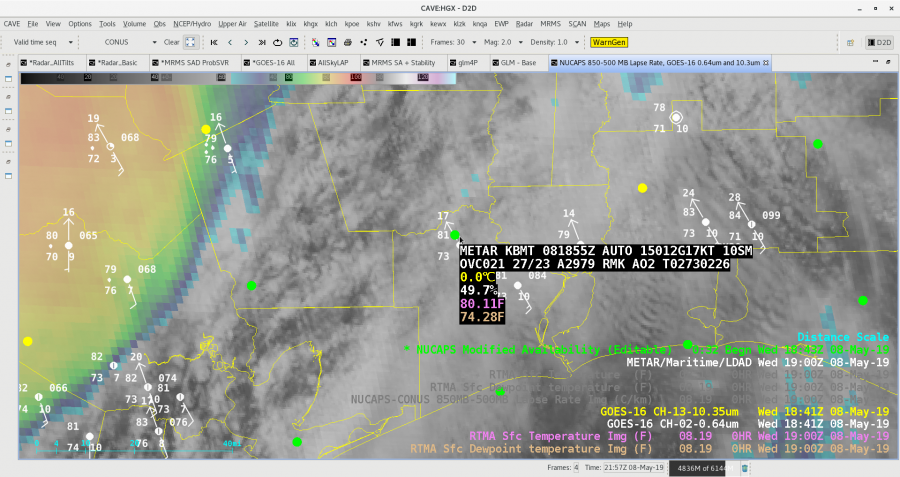
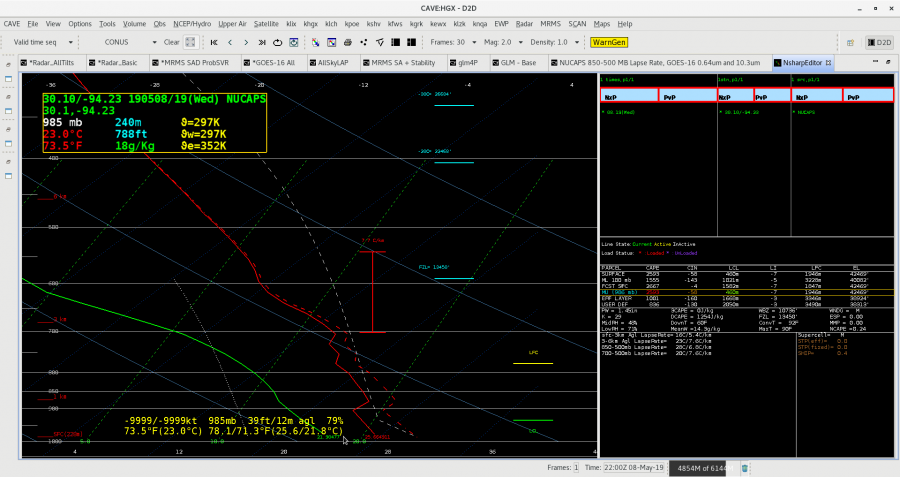
Another attempt at looking at the NUCAPs sounding and comparing to a local METAR and RTMA. This time the modified soundings seemed to do much better. The NUCAPs sounding point was roughly 2 miles away from the BMT METAR which was measuring a temp/dew of 81/73. RTMA was measuring 80/74 at the NUCAPs sounding location. NUCAPs unmodified sounding came in at 74/69 (not shown), however, the modified sounding was adjusted to 78/71.
So the modified sounding was adjusted well from the original, but looks like it may have not been adjusted far enough for this case. Although if there’s a bias throughout the sounding perhaps correcting too far would make the sounding unrealistic. Not sure w/o in situ observations throughout the troposphere.
#ProtectAndDissipate
At 19Z, the modified sounding southwest of KARM compared to RTMA was about 2 degrees cool for temperature and 5 degrees cool for dewpoint, presumably due to temporal interpolation issues. Still is a useful tool.
ZDR_Arcophile
In general, the performance of the NMDA along the thunderstorm line moving across the northern SHV CWA has been superior to both the MDA and DMDA in terms of more accurate detection of greatest, often small, regions of cyclonic vorticity along the leading edge of the line that I’d likely be issuing TOR warnings for as a warning forecast in the SHV office today.
-icafunnel

Fluctuating TORprob occurring within small group of weak updrafts. Nothing of note to show on AzShear.
ZDR_Arcophile
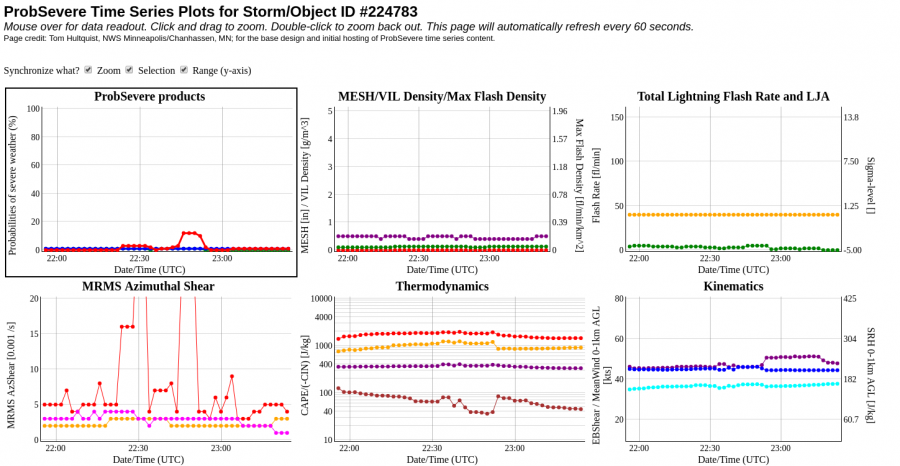
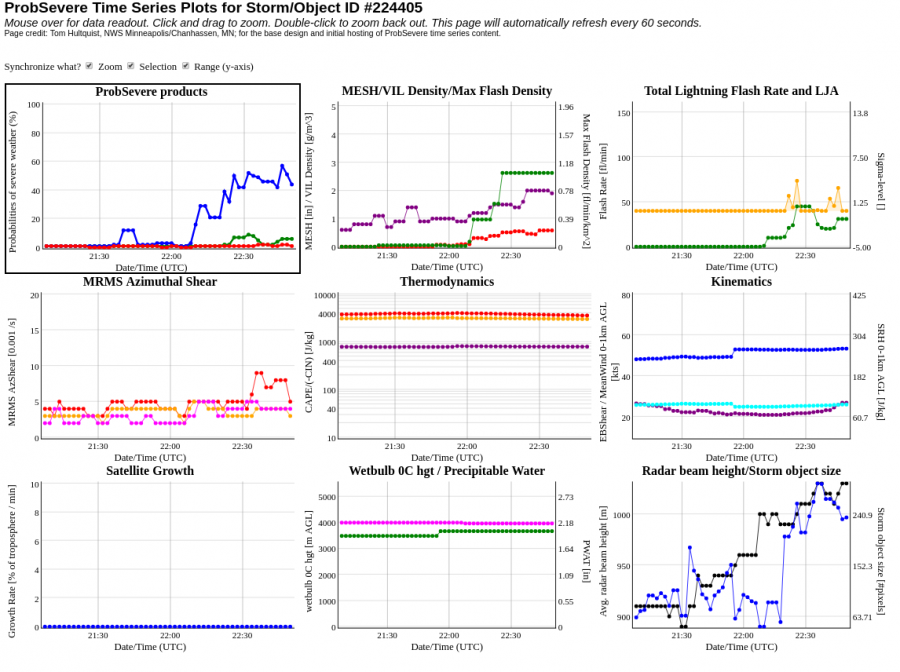
Here’s a case where the ProbTor model significantly increased in an area where tornado potential was extremely limited. Below are animations of the radar velocity at the closest radar (KGRK), the low-level Merged AzShear, and the time series of the ProbSevere product. The cell in question was small and behind the main line of storms in the more stable airmass, yet the ProbTor model jumped to 79% for several minutes. The time series seemed to indicated this was due to an increase in AzShear yet the Merged Low-Level AzShear product showed no distinct signature (same for Mid-Level AzShear not shown).


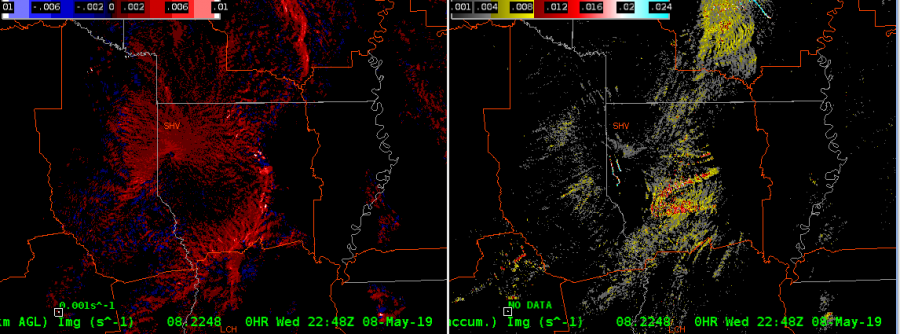
UPDATE:
After consulting with the fantastic Mr. Cintineo, he found that the false flags were likely from a jump in the Low-Level Rotation tracks in MRMS (shown below). These false signatures, however, were not making it into the aforementioned AzShear product.

#ProtectAndDissipate