

For the RNK CWA today, new afternoon convection didn’t materialize, although residual precip and cloud cover exited the eastern CWA to the southeast (blue arrow in KCFX 0.5 Z below from ~19Z) and seem to have left stable air behind.
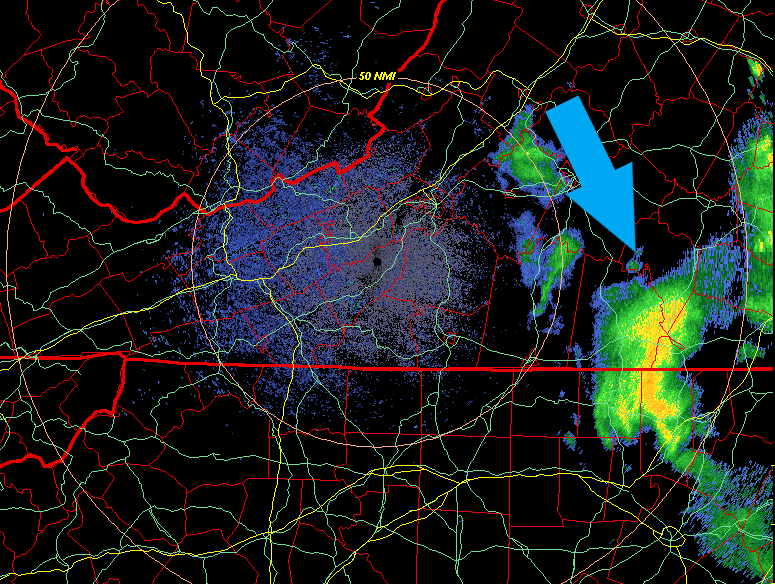
The corresponding visible satellite for the same time is shown below.

Only the western half of the CWA looked to remain sun-lit, with potential for additional development. Although there wasn’t much forcing, initially the airmass looked unstable, but how unstable was it really?
Looking at the RAP forecast valid at 19Z below (point B corresponds to the KFCX radar location), around 4000 J/kg are forecast. It’s worth noting, the RAP model did correctly capture the relatively low CAPE to the east, in the stable area where previous precipitation was still exiting.

However, leveraging polar hyper-spectral sounding and ABI combined modifications to a RAP-like model, the following PHSnABI derived CAPE can be compared to the RAP forecast above.
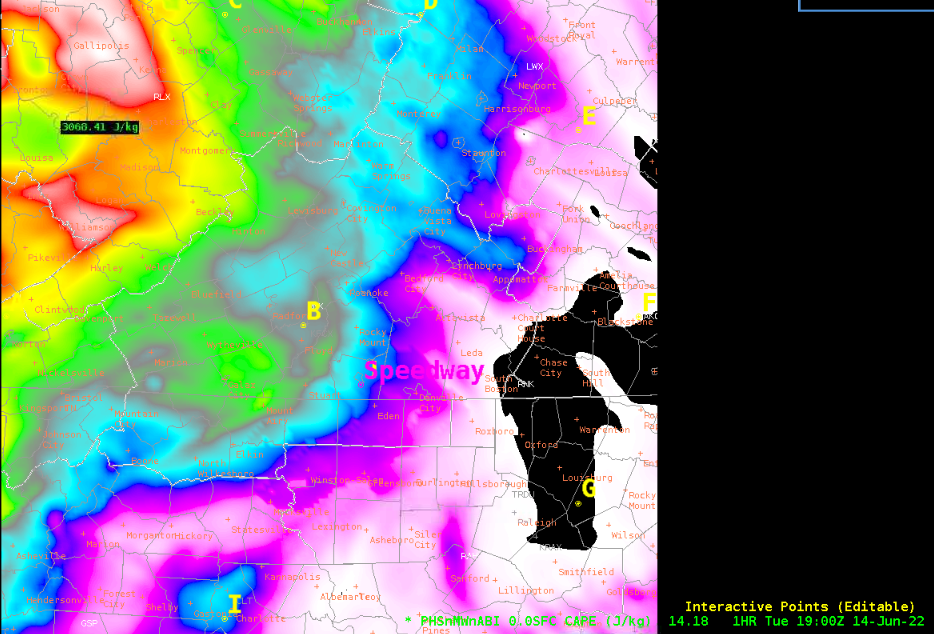
This seems to show a more toned down instability situation relative to the RAP, particularly around our point B. If correct, this could partly explain the less-than-anticipated convective development. But the higher resolution data also gives clues to where CAPE remains relatively higher than the surroundings. In fact, the 19Z visible satellite does appear to show an attempt at cumulus development along the CAPE gradient east of point B… to be fair, the RAP had the same gradient, too. I didn’t get a chance to overlay visible imagery with the PHSnABI data above today, but it would’ve been interesting to see directly how the cloud fields overlapped.
I didn’t dig deep into why PHSnABI CAPE was lower than the RAP, but the comparison graphics available on Polar/Geo-Satellite Atmospheric Profiles – SSEC (wisc.edu) could hold answers.
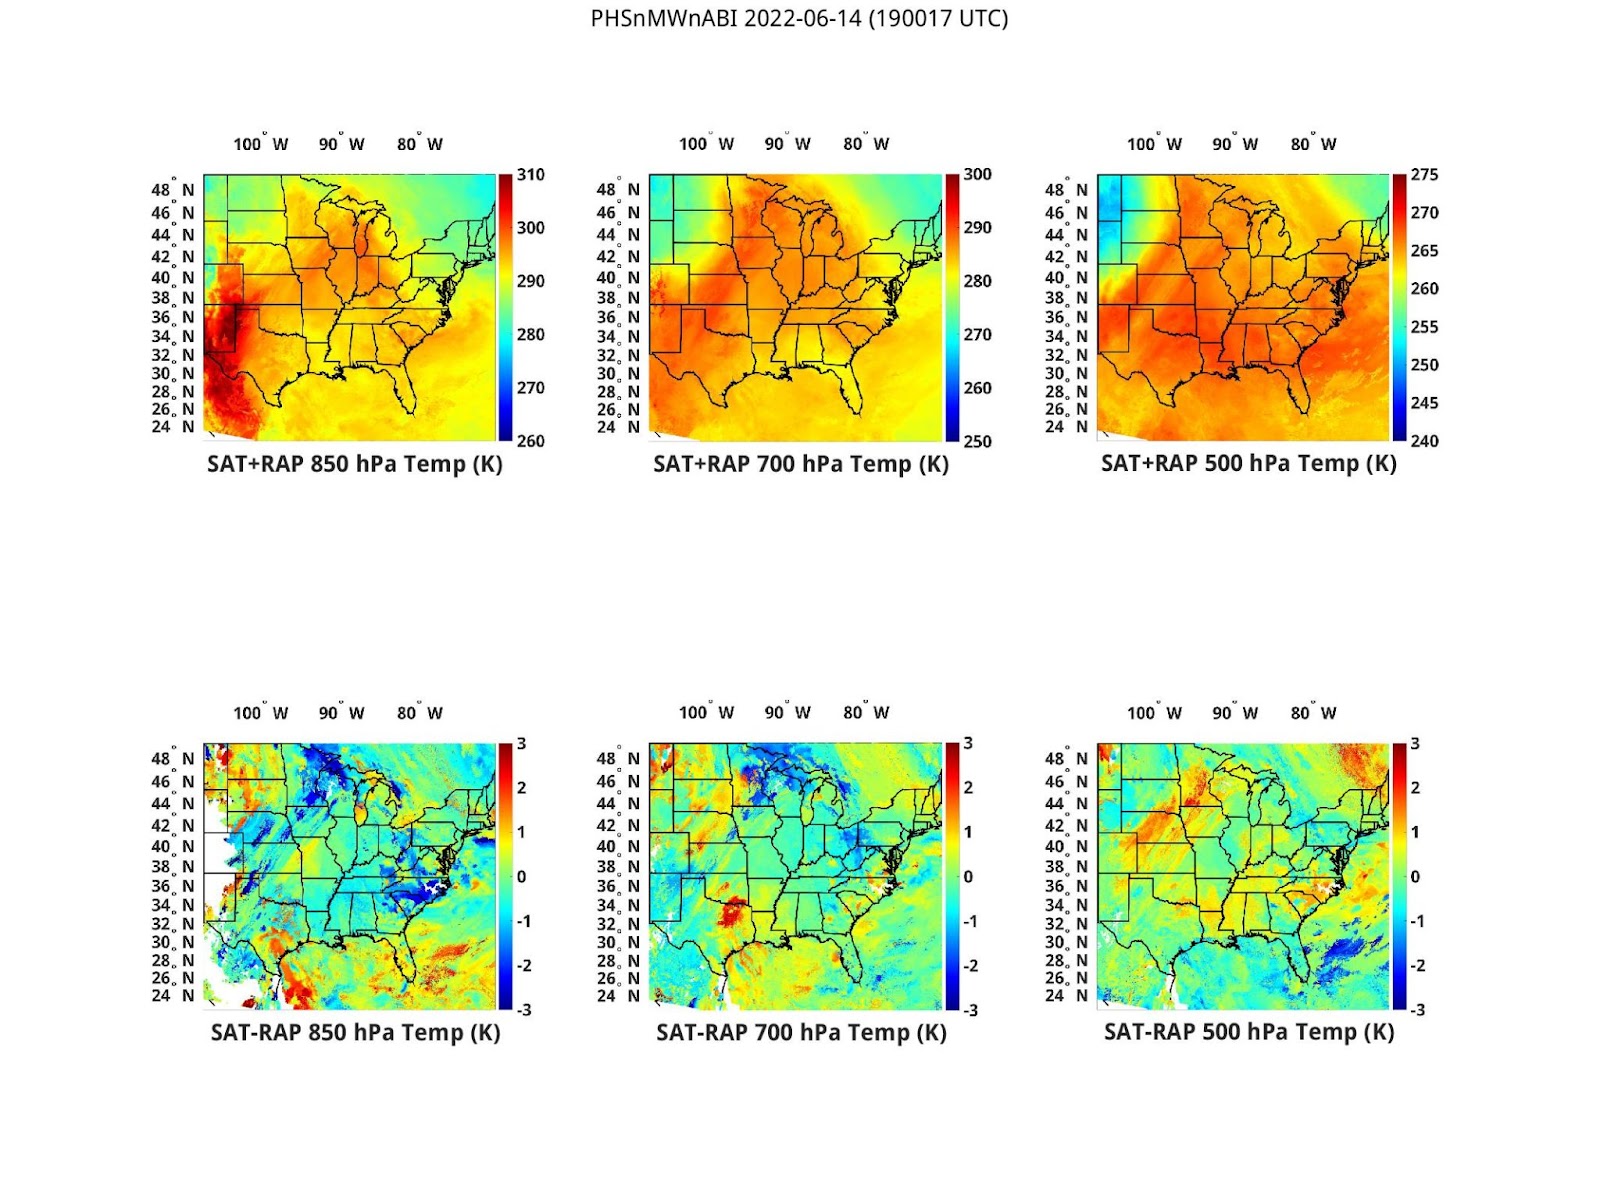
Between the plotted differences in both temperature and mixing ratio, the values in central/western Virginia are a bit noisy and hard to generalize… but there do seem to be some reductions particularly in mixing ratio at all three levels (850, 700, and 500 hPa), suggesting RAP might have been too moist. (Zoomed in example below for 850 hPa SAT minus RAP mixing ratio over Virginia, with dark blue indicating -5 g/kg correction )
Now how about soundings? Looking at a special ~19Z (or 18Z?) sounding from KRNK, a colocated RAP model sounding (at point B) also at 19Z, and a NUCAPS sounding around the same point and time, we can compare the temperature and moisture profiles.

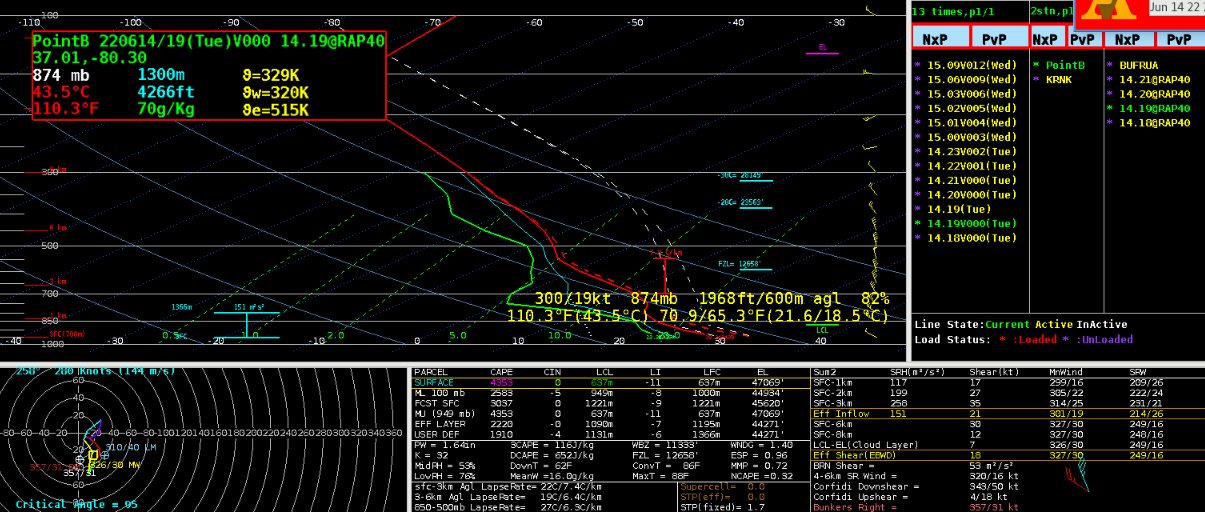
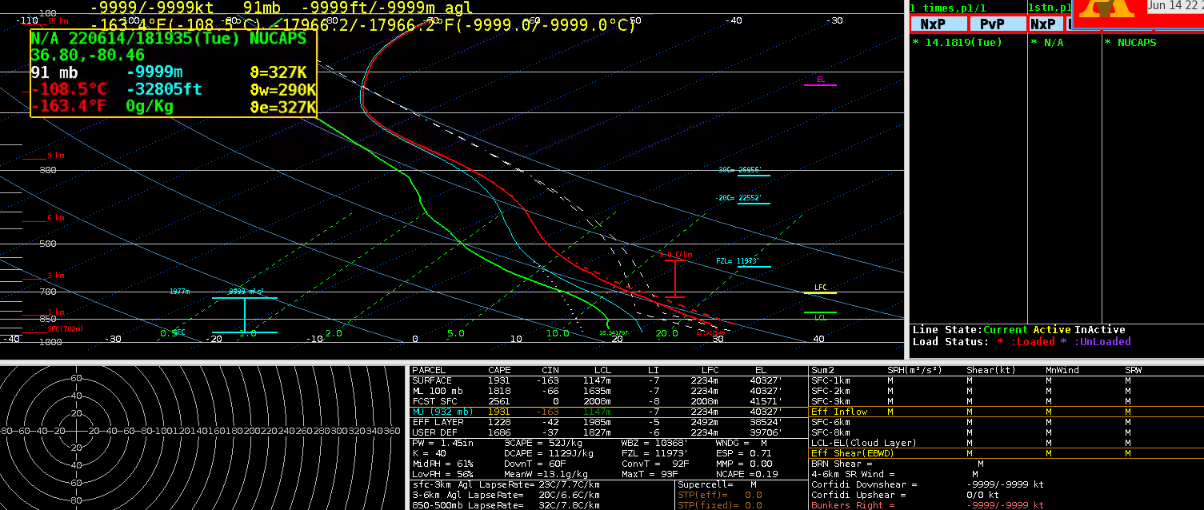
Overall, temperature profiles appear decent for all three. It’s primarily moisture which seems to differ, with the RAP being the most moisture-rich in both boundary layer and in a layer centered around 600 mb (note a ~1.64 PWAT from the RAP sounding). The NUCAPS has less low level and mid-level moisture overall, and a PWAT of 1.45. Despite the NUCAPS’ smoothed profile, if NUCAPS is supposed to have skill at retrieving mid-level moisture profiles, perhaps this is useful information. Finally, in the actual RAOB, a very high moisture observation at the surface may have caused the computed SB CAPE to be quite high… however, the low-level moisture as a whole arguably matches the NUCAPS sounding a bit better. The mixed layer CAPE in fact matches better between the RAOB and NUCAPS soundings, and so does the overall PWAT.
Buzz Lightyear