EWX Mesoscale Discussion

AllSky_LAP ML CAPE Forecast as of 1930z

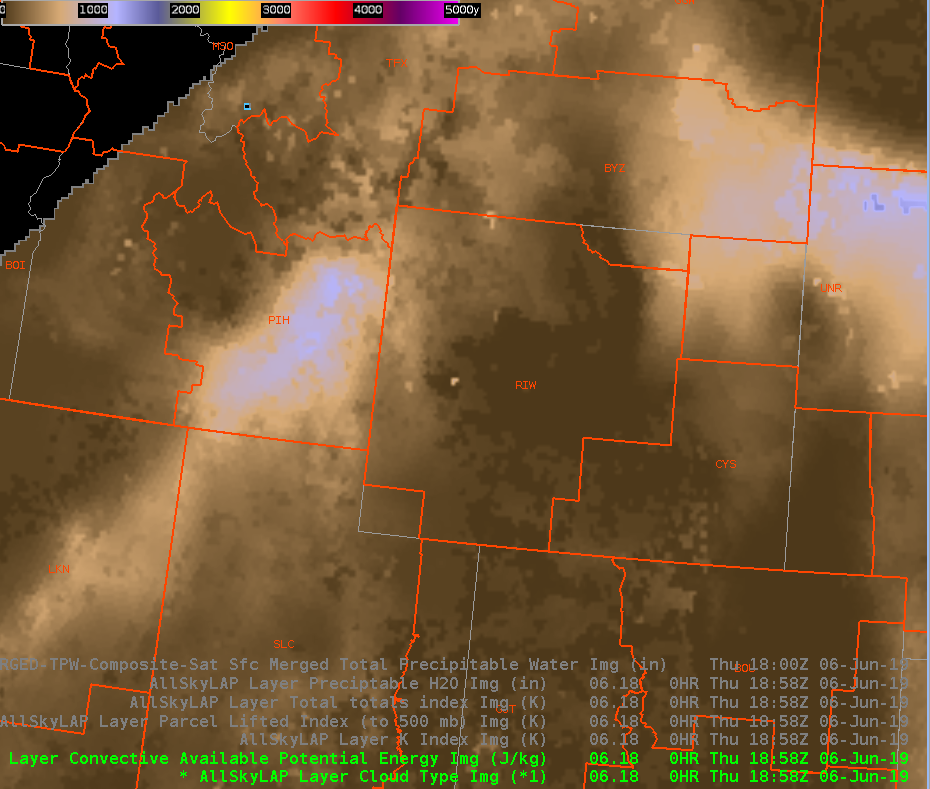
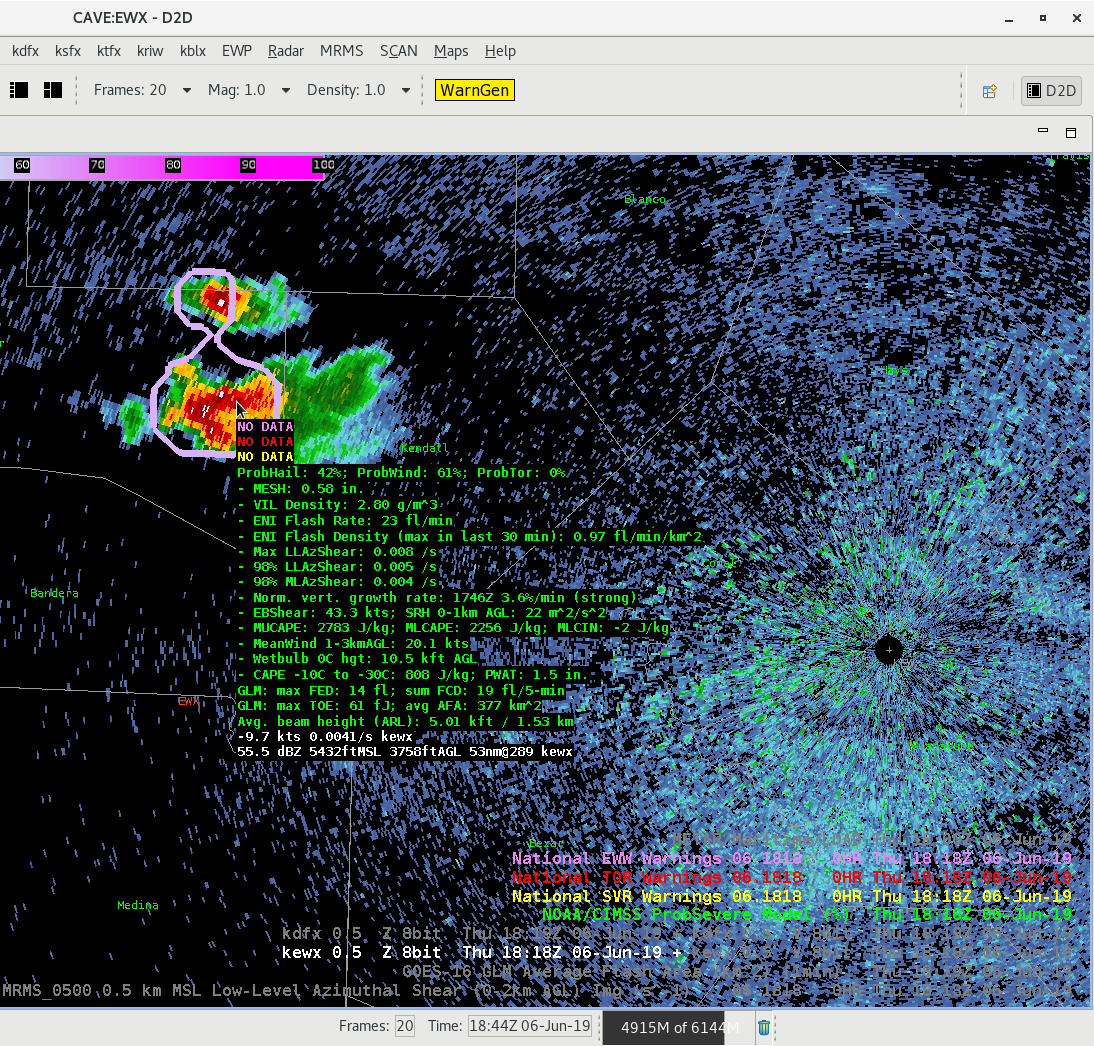
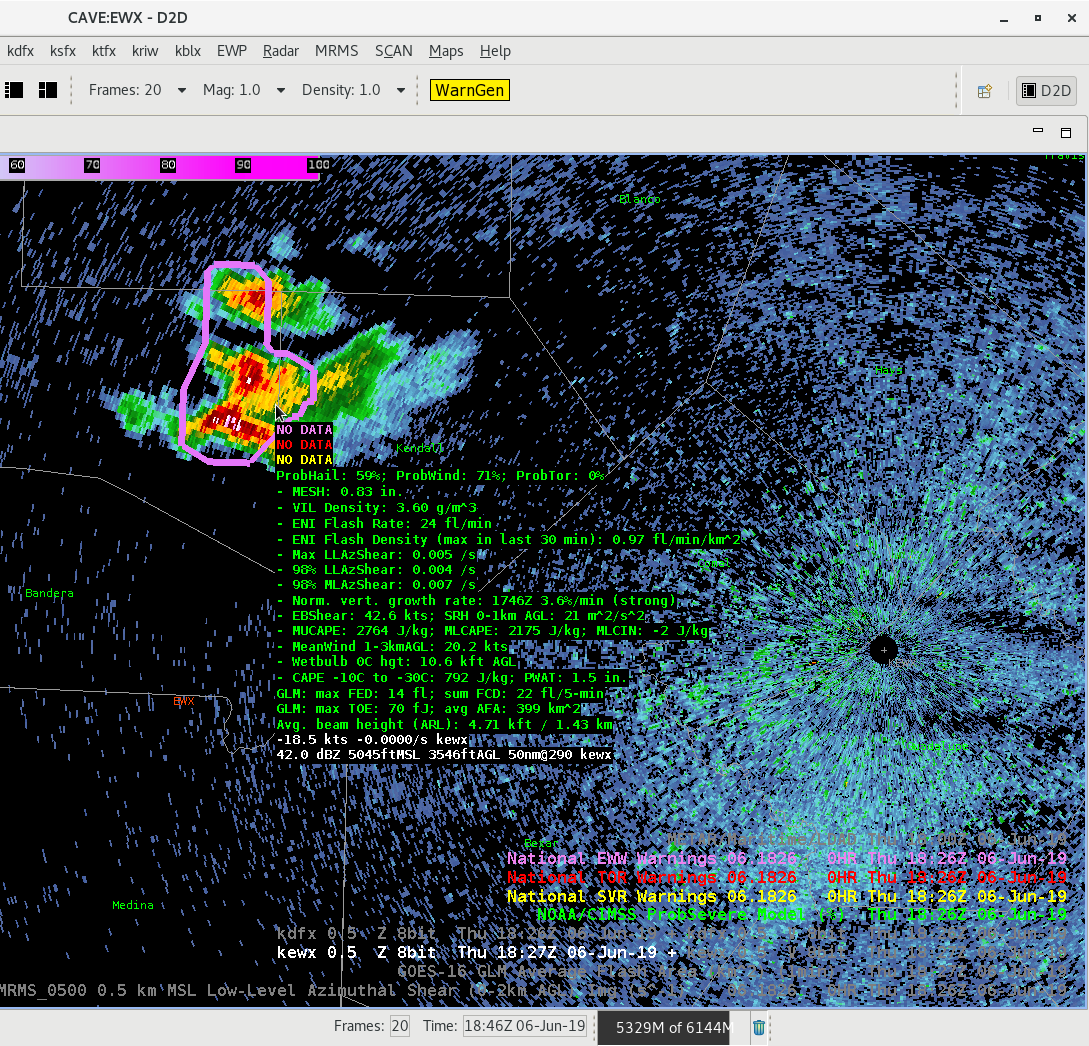
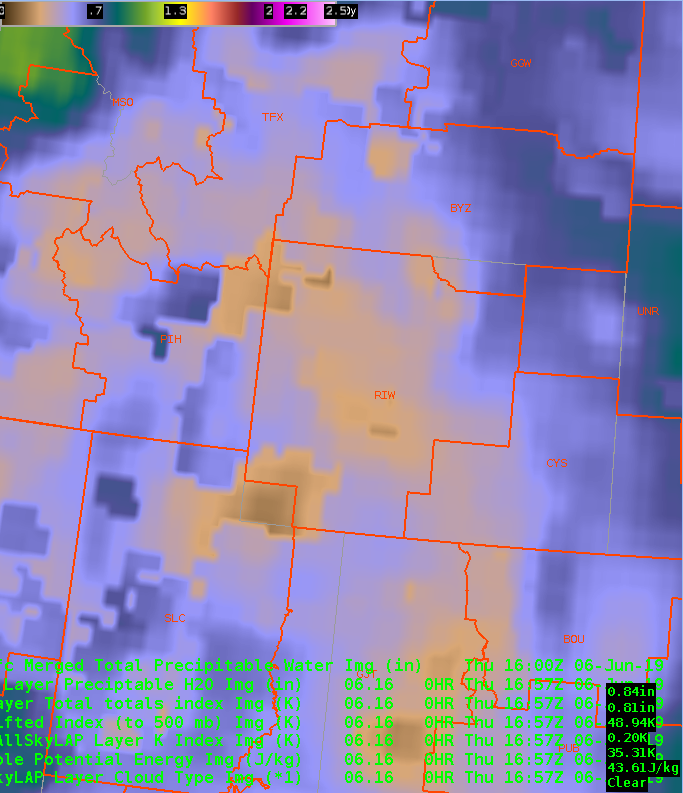
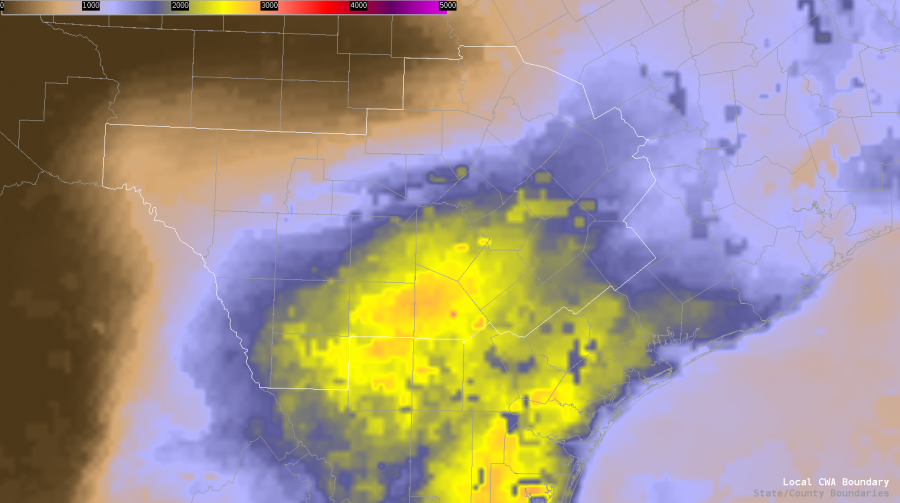
19z Surface analysis shows the nearly stationary effective dryline boundary draped SW to NE across the CWA from roughly Del Rio through Briggs, TX. This boundary continues to play epicenter for semi-discrete super-cellular development this afternoon, with additional cold pool driven activity likely to form over the next few hours, especially as a back door cold front begins to slide southward through south-central TX. Latest AllSkyLAP CAPE analysis shows destabilization continues southeast of the dryline, with ML CAPE values nearing 3000 J/KG in and around San Antonio as of 19z. TPW values also remain relatively high southeast of the boundary, with 1.5 to 1.75 inch readings common place. Mid to upper-level kinematics remain favorable for some supercellular structures, so we’ll continue to  keep large hail, damaging winds, and an isolated tornado threat in the forecast. Best chance for seeing a tornado (even with relatively week 0-1km shear values) will likely be through 7pm tonight in a cells that can remain discrete for awhile. Flash flooding concerns will continue thanks to the abnormally high PWAT values, especially in areas that see several rounds of convection this afternoon and evening.

—————————————————————————————————-Mountain Bone

Tags: None

Lightning over the Mountains

Having the different lightning products from GLM as well as data from ENTLN allows you to pick out which cells have started producing lightning.  One flash up in northern WY on this image, the dot in the upper left, did show up in the FED data a couple minutes later.

Charley

Modified Sounding for RIW

Modified the RIW 12Z sounding for low 70s over around 40 in the southwest WY area, and got an MUCAPE of 655 over  A little higher than what AllSky is showing there…

…around 200 in the image above.

Charley

Tags: None

ProbSevere Values Affected by Shape/Size of Polygon

The following series of images shows the change in ProbHail/ProbWind values based on the size/shape of the polygon area. Initially, at 1806Z, ProbSevere was targeting the stronger cell to the south, indicating Hail/Wind 78%/85%. (At this point V was indicating around 20kt). At 1818Z, the northern cell intensified and ProbSevere grouped the two cells together, as a result, Hail/Wind both fell to 42%/61%. At 1827Z, after the southern cell split, the ProbSevere polygone became more filled with deep convection, thus Hail/Wind values increased to 59%/71%. Soon after, around 1834Z, ProbSevere polygons split and then indicated increased probs on the southern cell back to 69%/75% (Hail/Wind).

Incidentally, the larger the polygon, it becomes increasingly likely that ProbSevere values will decrease.


Tags: None

Western Wyoming Cell Developing

IR imagery showing a taller/colder cell in western Wyoming.  KRIW radar just switched from VCP 35 to 12.  Peak Z aloft now only around 30.  Lightning data, below, shows relatively low FED, but higher TOE, with peak values in the 300’s, similar to some of the storms we saw yesterday.

One other thing to note in these, is the relatively low FED and number of ENTLN/NLDN flashes.  That doesn’t mesh with the brightness of the TOE.

Charley

Suggested Hail 4-Panel Procedure

This is a 4-panel display that I find very useful with respect to hail potential monitoring in a convective environment. By incorporating Prob-Hail and/or GLM, along with MRMS Isothermal reflectivity, a forecaster can really get a good feel for hail potential within cells. Due to up to 2 minute latency within MRMS products, would not recommend as a substitute for All-Tilts methodology, but certainly could be used for situational awareness.

Top Left: MRMS_1000 0.5 km MSL Isotherm Reflectivity at 0*C

Top Right: MRMS_1000 0.5 km MSL Isotherm Reflectivity at -10*C with blinking ENTLN C-G and C-C Flashes (Could substitute GLM data here also).

Bottom Left: MRMS_1000 0.5 km MSL Isotherm Reflectivity at -10*C with ProbHail Model output

Bottom Right: MRMS VII or legacy VIL.

————————————————————————————————— Mountain Bone

Tags: None

Derived Products Comparison

Merged TPW, image above showing an area of higher TPW, 0.5-0.6 in PIH’s area, with values of 0.25-0.4 more over RIW.  AllSky product shows a little more variation, with a drier airmass, 0.15-0.25 inches moistening up over the course of a few hours, over the western border to 0.5″.  Also seeing those values in the far eastern part of RIW’s area.

Total Totals are ramping up over time in the AllSky product, from around 40 to a more severe 55. LI’s also are going negative.  K index also going for some storm activity, getting to the mid 30s.  CAPE’s are higher over PIH, but likewise rising across the region…with a similar max in the eastern RIW area.

Charley

Tags: None

Storms tracking toward St. Louis

A line of storms is north of St. Louis as of 630 pm CDT and is tracking southward toward an area of increased CAPE per All Sky LAP product.  This convection continues to trigger along the leading outflow.  The overall environment has limited shear so it is primarily cold pool driven.  ProbWind has consistently displayed around 65-78% since around 600 pm CDT.

Tags: None

Merger of storms

SPC issued a meso discussion talking about the threat for severe wind gusts on cells bowing out towards St. Louis.  The cell in Pike county on the look above has the outflow boundary tied into it on this RGB (in blue) and the updraft still is stronger with waves radiating out from the overshooting top.  We decided to issue a large SVR for winds traveling southeast out of this storm.

Tags: None