KMXX – Inst AzShear

Using a combination of Z, Zdr, inst AzShear from KMXX – can see development of low level mesocyclone quicker than V/SRM alone.  Can see the “white” > 0.01 s1 show up as early as 2000 UTC on the main TOR- while Z/SRM shows mainly a convergent signature.


Looking down the convective line – south of KMXX – examining the Azshear around 2040 UTC.  Area near the county border does trigger above 0.01 – whereas areas further south are slightly weaker (see image).  Would be interesting to know which of these produced tornadoes.  Reminder – plotting the tracks would be great!


AzShear Case Assessment

First time looking at these products (Single Radar AzShear, Merged AzShear 0-2km, and Merged AzShear 3-6km) and I’m already liking how quick it is to pull my eyes to areas I should be paying close attention to. The most obvious feature is the circulation well to the SW of the radar site (close to 115km out), but what I find to be even more useful is watching mid-level rotation tighten into a low-level circulation closer to the radar site (around 51km away). In the first screen capture below, the Single Radar AzShear product highlighted the RFD bulging out, which is very useful in being able to fully diagnose the developing case. In an operational setting, having the full suite of AzShear products available to supplement traditional radar products could raise confidence when making a warning decision. Both of the merged products increase my confidence in the vertical depth of the circulation, but is also useful when diagnosing shallow circulations, at least in this one case I’ve been looking at. I’ll be interested to see how these products perform in other cases, particularly ones that involve the more shallow QLCS TOR-scenario.

All that said, I will say that there are enough false positives appearing in the AzShear product suite, particularly the Single Radar one, that caution should be taken if using solo, without reference to the traditional radar products. In an even more active scenario, I could potentially see false positives taking the warning forecaster’s attention away from features that need closer attention.

~Gritty

Storm Structure More Evident with AzShear

The AzShear products seem to accentuate features such as the RFD which could allow for a better assessment of RFD strength and the potential for new tornado genesis in cycling supercells.

In this specific example the initial tornado weakens or dissipates, and when faced with a decision whether to continue or re-issue a warning, the enhanced RFD signature would have prompted me to continue the warning. Sure enough, several scans later a new circulation developed that would have prompted a new tornado warning on its own.

— FLGatorDon

AzShear and the Leading Edge

Spectrum Width is (I feel) a seldom used and/or misunderstood product, but one of the uses of it is to view the leading edge of a gust front with messy reflectivity. I think the Az Shear product, especially the single radar version, adds an additional layer to this boundary identification. A forecaster would need to be aware where the radar is with respect to the leading edge as the Az Shear flips whether you are north or south of the radar, but putting the Velocity, SW, and Az Shear together makes that leading edge ID easy. This is important when doing DSS for events for example, identifying and timing out right where the leading edge winds begin. Below are two screenshots one with AzShear, Reflectivity, and SW, and another with AzShear, SW, and Velocity. You can see where the leading edge is in the most norther part of the line in reflectivity (tight gradient that lines up well with SW). In the middle of the reflectivity though it gets messy. While details of the leading edge are still visible in SW, they stand out well in the AzShear, including where a kink the line and a new circulation is developing.

You can see this leading edge of the line in Storm Relative velocity as well (see above). Whether it is for tornadic circulation identification (which SW can also play a role in – high values of Spectrum Width = high turbulence like you’d see around a tight couplet) or for identification of the leading edge of the winds I think a 4 Panel of Reflectivity, Spectrum Width, Velocity, and Single Radar AzShear would be useful and valuable.

-Alexander T.

Single vs Merged AzShear as SAD Tool

In a zoomed out view the AzShear products can draw your attention to small gate-to-gate signatures in velocity data that would be harder to see without zooming in. In the image below it’s hard to see the gate-to-gate, but the AzShear product is standing out for the northernmost couplet.

Now reference the zoomed in velocity:

Additionally, the MergedAzShear products can alert you to couplets that are occurring at low-levels nearer to other radars than are currently being viewed. For example, in CWAs with multiple radars and with limited screen real-estate due to performance and monitor limitations, it is impossible to view all radars at once. Thus you find yourself switching tabs a lot. Utilizing the MergedAzShear can tell you when you need to look at a different radar and which radar you need to look at so you can triage a storm as fast as possible. See merged product:

vs. a single RDA AzShear product:

And note the detail you can see in northern AL and western TN. After addressing the storms in eastern MS, I know I need to switch and look at nrn AL.

— FLGatorDon

Comparing RAOB to NUCAPS and AllSky Layer Precipitable Water

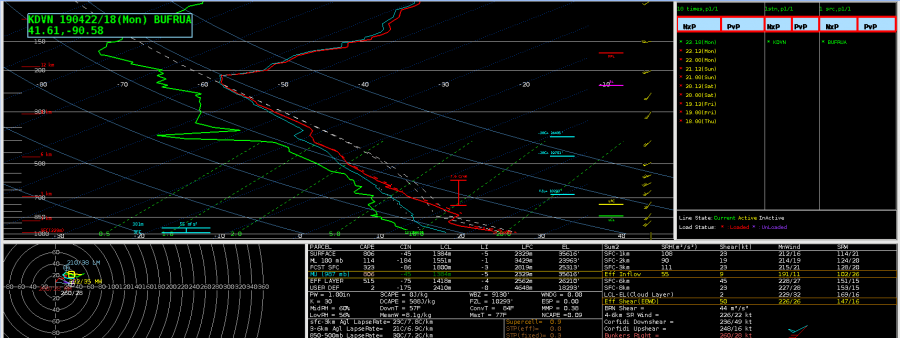
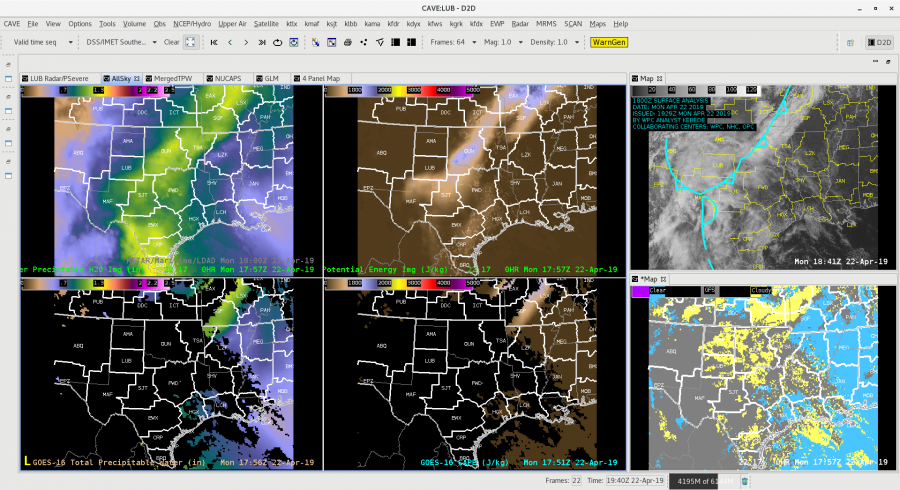
Davenport launched an 18Z balloon, which gave me the opportunity to compare the RAOB with a NUCAPS sounding (first and second images below, respectively). Initially, I attempted to modify the sounding in NUCAPS to try to bring it closer to the observed values, but after several minutes and attempts at doing that, I realized that I’d have to do multiple levels of modifications before it came anywhere close to the observed sounding. As great as it is to have the ability to modify the NUCAPS sounding, my initial thoughts are that I’m not sure how feasible it would be to do this in a much quicker-paced operational setting. If I’m sitting in the mesoanalyst seat during a severe weather event, I’d need to be able to analyze the available data much faster than doing a more detailed modification would allow.

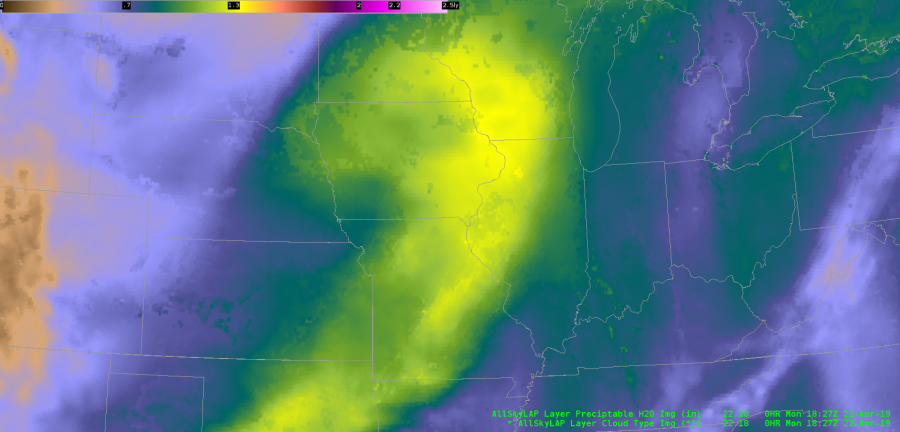
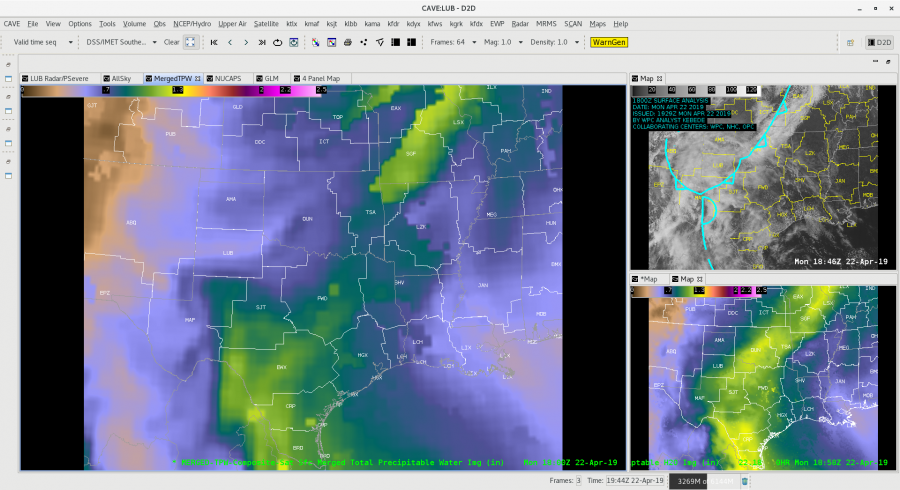
I was also able to do a PWAT comparison between these two soundings and the AllSky Layered Precip product. The NUCAPS and RAOB are very close together in values, whereas since the AllSky product (last image below) is currently utilizing the GFS to fill in the data in the DVN area, it’s noticeably higher (RAOB: 1.0″; NUCAPS: 1.1″; AllSky: 1.3″). I am very happy to be able to underlay the data type for the LAP products, since this is crucial for me to be able to see where the data is coming from and how to correctly assess and apply the right bias adjustments, as necessary.

As for the AllSky Layered Precip product, in general, this is very helpful to be able to identify potential atmospheric rivers and quickly diagnose PWAT trends with a decent degree of confidence, when again combined with the knowledge of what data is being used to compute the output.

~Gritty

NUCAPS in 4-Panel

When NUCAPS Sounding Availability is loaded in a 4-Panel and is ‘Editable’, you can sample the data by clicking on any of the other panels. This could be useful if there is an area of interest in one of your other datasets (i.e. vis/CAPE/PWAT) so that you don’t have to find the nearest dot using the NUCAPS imagery; simply click the area of interest on the panel you’re investigating. Works in panel combo rotate as well.

— FLGatorDon

Precipitable Water Overview

Looking at the different precipitable water (PW) products available in the HWT and doing a quick overview the All-Sky products provides a great first guess to fill in the PW where it is cloudy. Both the Merged TPW and the All-Sky take the first step in filling in where there are clouds. The image below  shows the sheer volume of data that isn’t available due to the pesky cloud cover. The 4-Panel to the left shows the All-Sky PW and CAPE on top vs. the raw derived PW and CAPE from GOES-16. On the right you can see the visible satellite and the All-Sky mask showing that most of the data, especially over Texas and Oklahoma is raw GFS (gray areas) at this point.

Looking at the Blended TWP vs. the All-Sky there are significant differences over north Texas and Oklahoma for this time frame. The BTWP product “is not forecast model dependent. ATPW uses  GFS model winds to advect the microwave retrievals and the GOES-16 component uses GFS in its TPW solution.” You can see where the blended product (big window below) only shows about 0.75 in PW, while the All-Sky is showing 1.25 in. across the Norman WFO. This can make a big difference when looking at rainfall forecasting and trying to assess just how much moisture in the atmosphere is over an area. In this case would certainly lean towards the All-Sky and then compare the information to other model soundings (from the HRRR, NAM, ECMWF, etc.) and to actual Upper Air soundings to see how the areas populated by the raw GFS are doing.

-Alexander T.

ProbSevere: Color Table Modification

While I’ve been a big fan of the ProbSevere Model for some time now, the default color curve has always been a little challenging for me to differentiate between the different percentages. Trying to find the right balance between the radar color tables and ProbSevere I know can be tough, but here’s my first go at attempting to better differentiate when the percentages move into the next 10% range. Unfortunately, I’m unable to really test this modified color table out since we’re currently not getting radar data in from the Davenport area, so will reassess this once I’m able to overlay the model output with radar imagery. But, just having the colors pop a little more is already helpful to me! Oh, and I’m very appreciative that ProbSevere v.2 now includes the separated values (i.e. ProbWind, ProbHail, ProbTor). Looking forward to testing this out once there’s a case to evaluate with it.

*Note: As of this posting, WFO DVN issued a Severe Thunderstorm Warning.

~Gritty

Single Radar AzShear Showing FFD and RFD?

Single radar AzShear appears to do a nice job of highlighting the FFD and especially the RFD right before and during what looks like a fairly significant tornado.

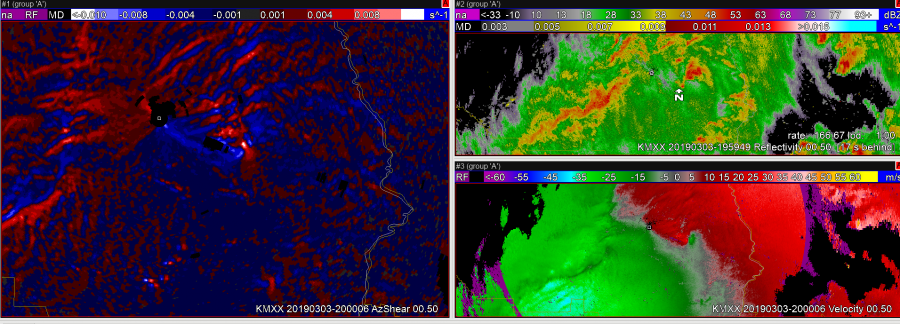
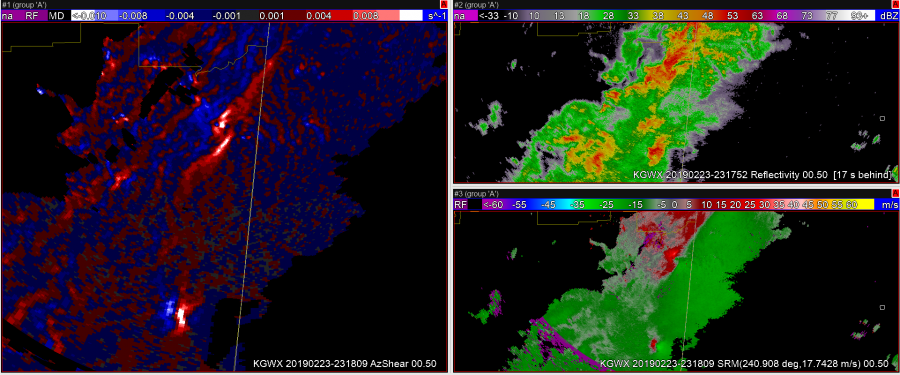
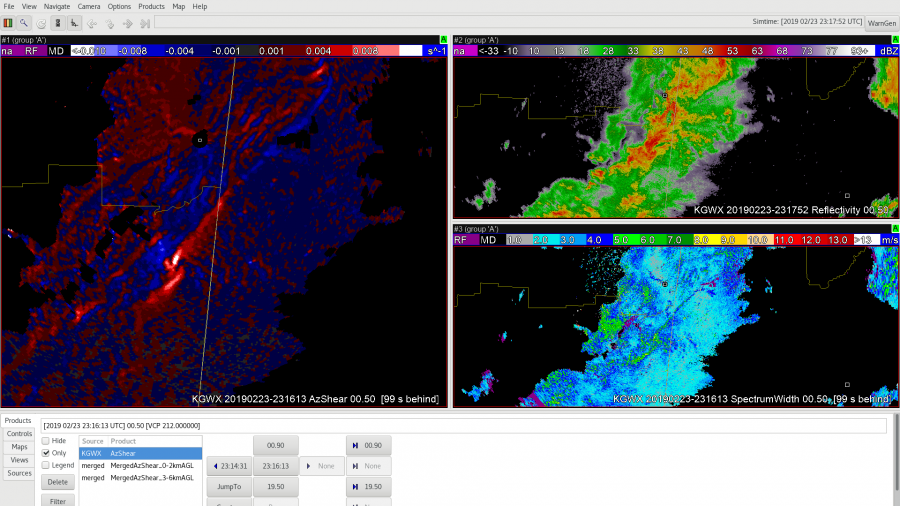
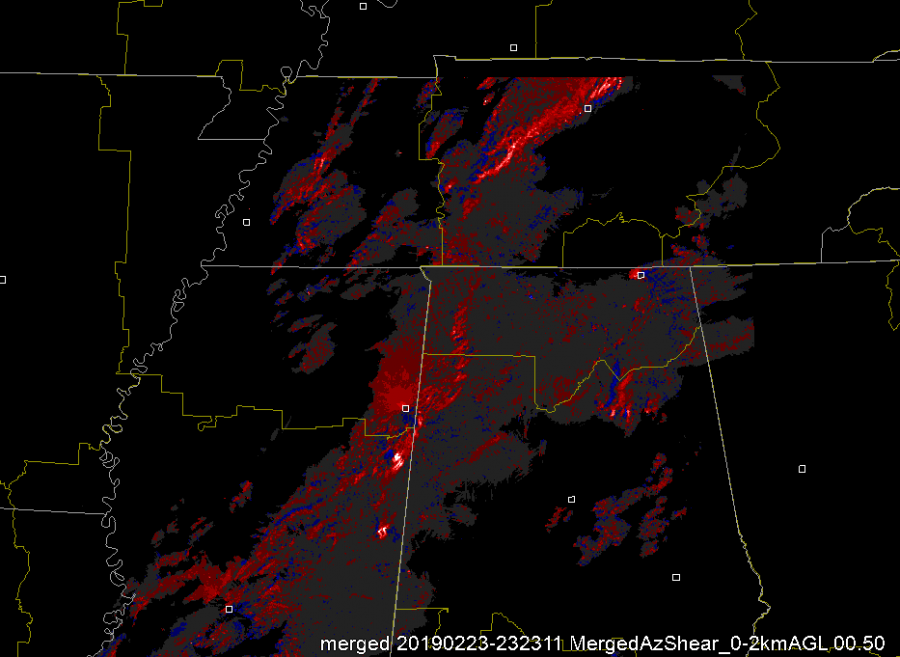
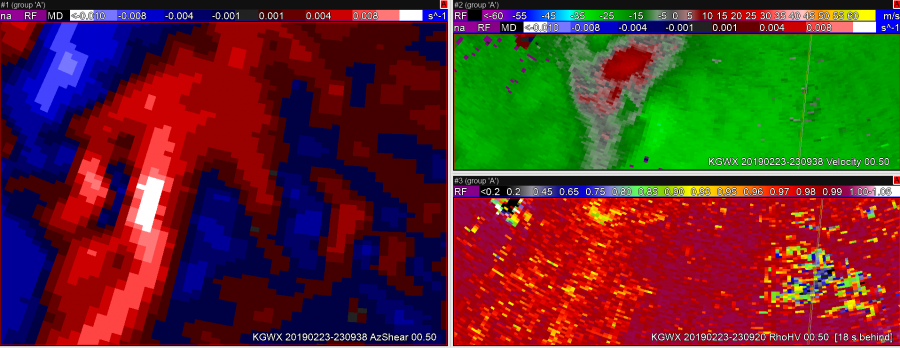
In this first image, the updraft-downdraft convergence zone appears to be a continuous line in AzShear.
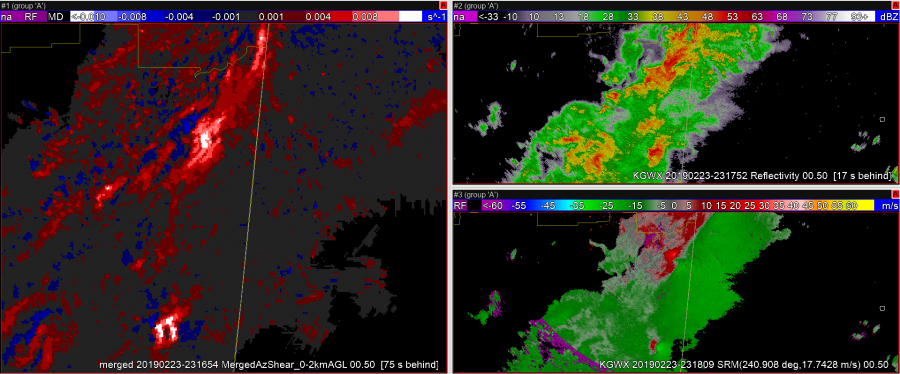
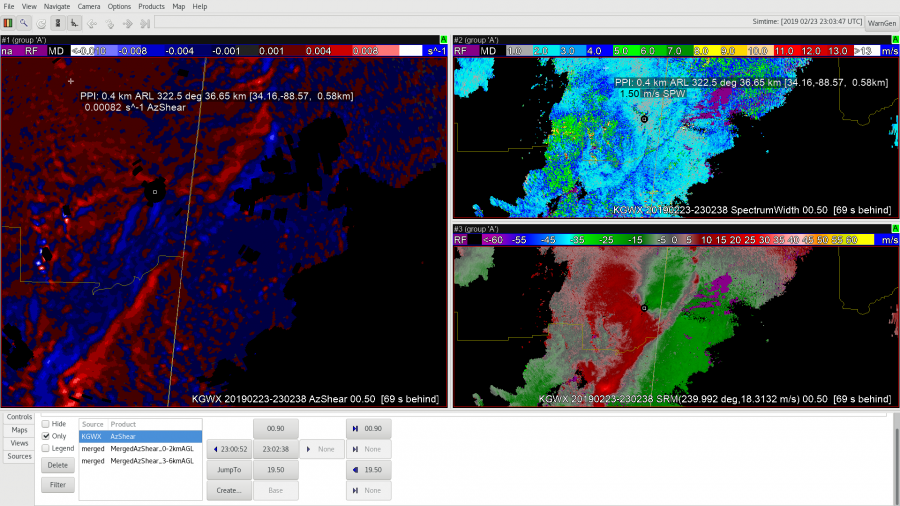
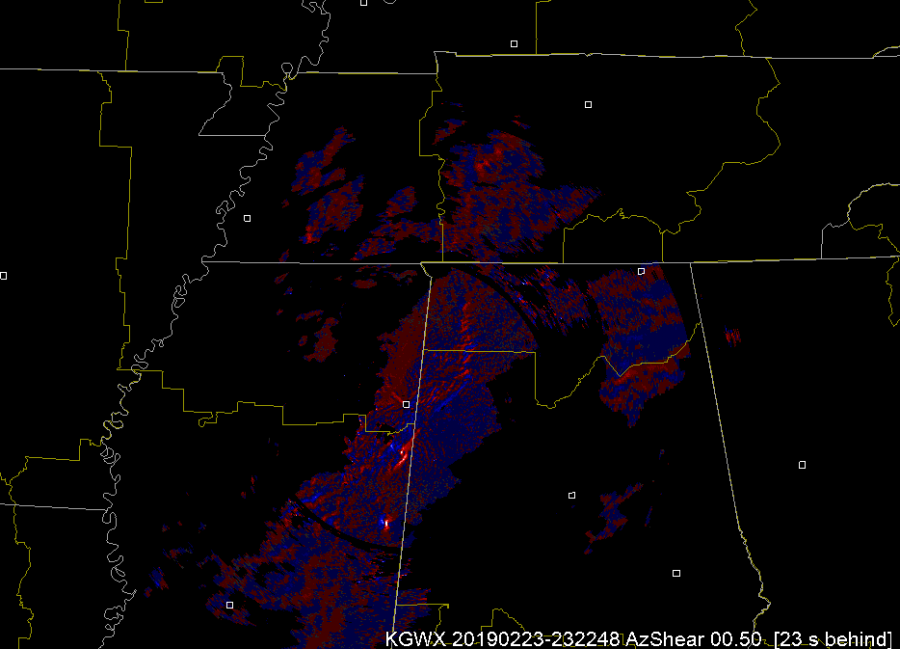
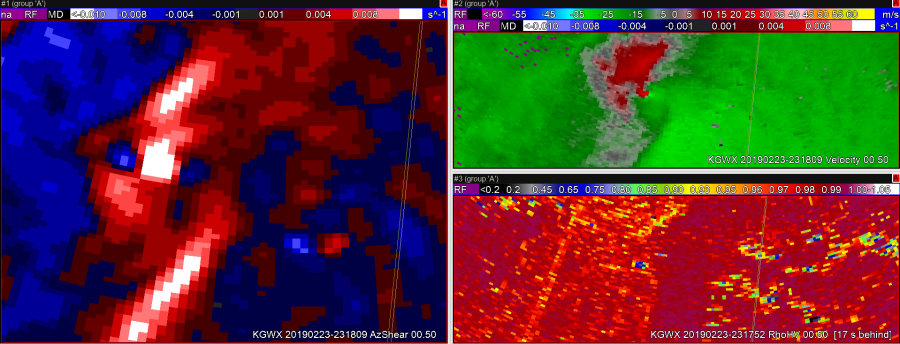
In the second image, you can see the RFD kicking out ahead of the storm right as the velocity couplet intensifies and a TDS appears.
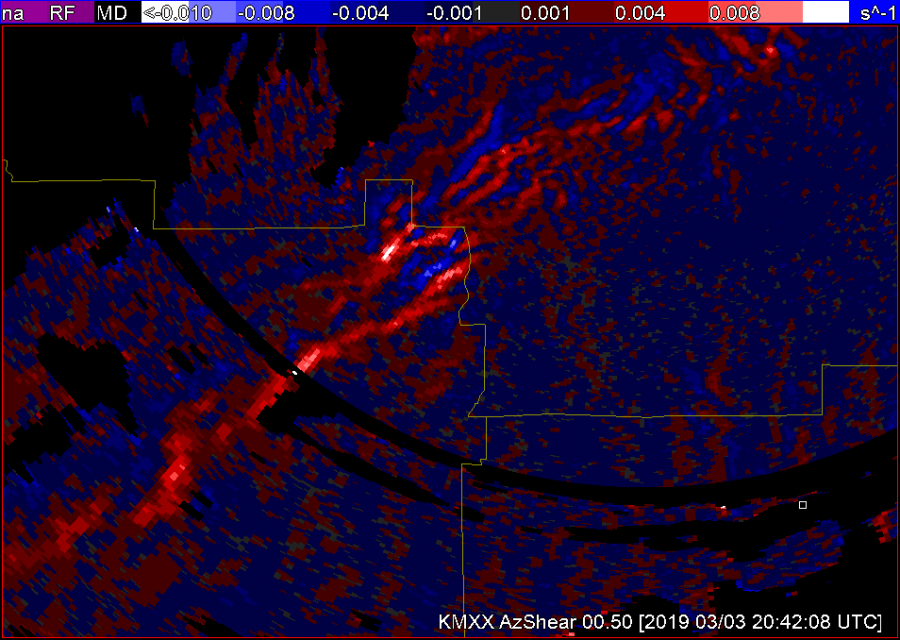
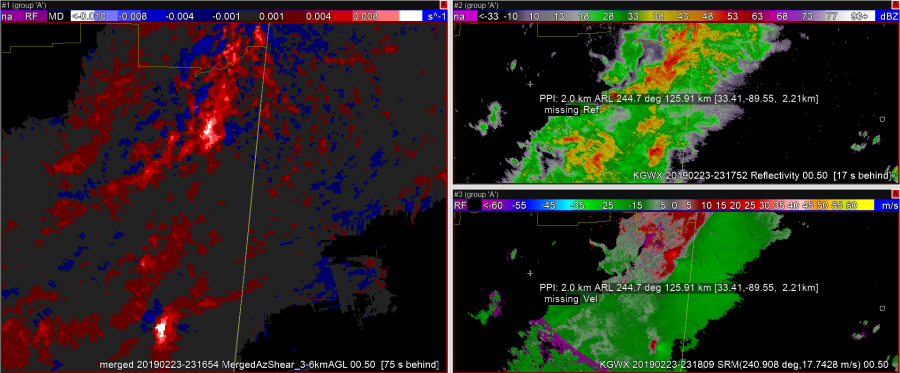
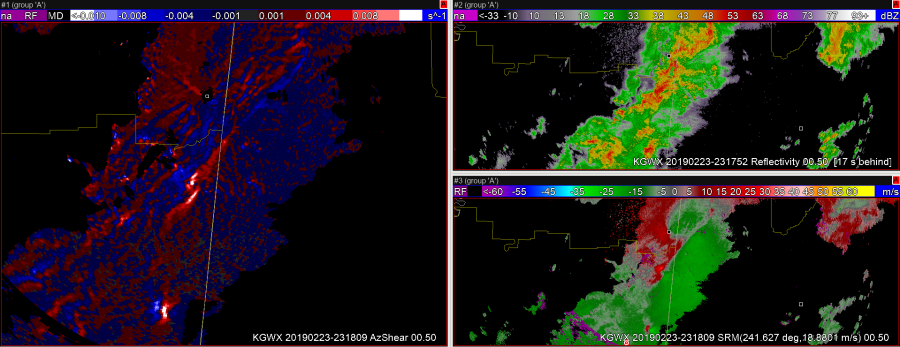
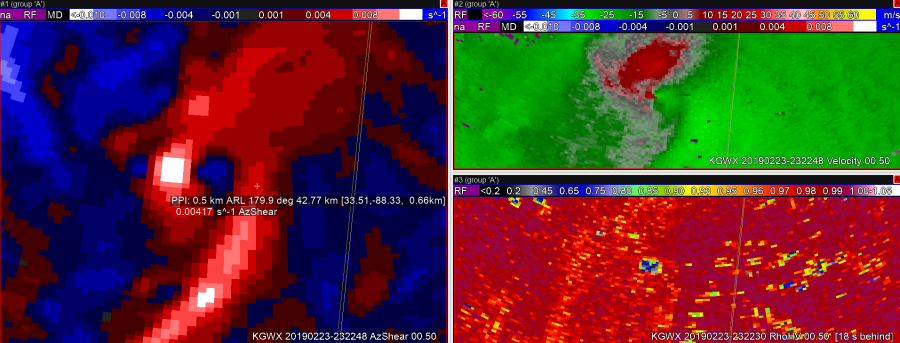
In image 3, it looks like the RFD has pushed well ahead of the tornado, perhaps hinting that the tornado may soon dissipate.  
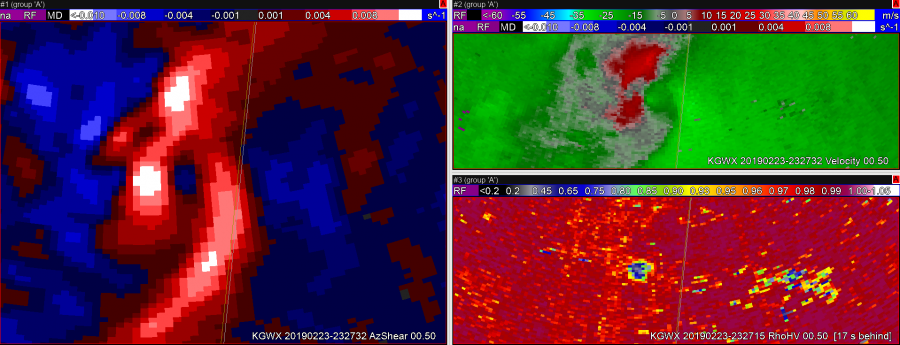
The TDS lingers in this image, but the velocity couplet has weakened.

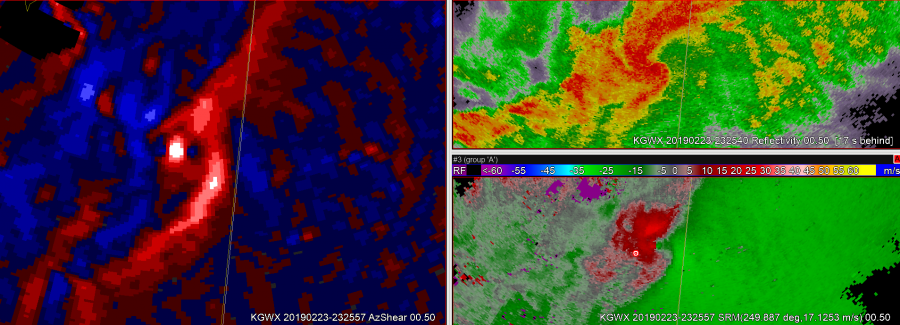
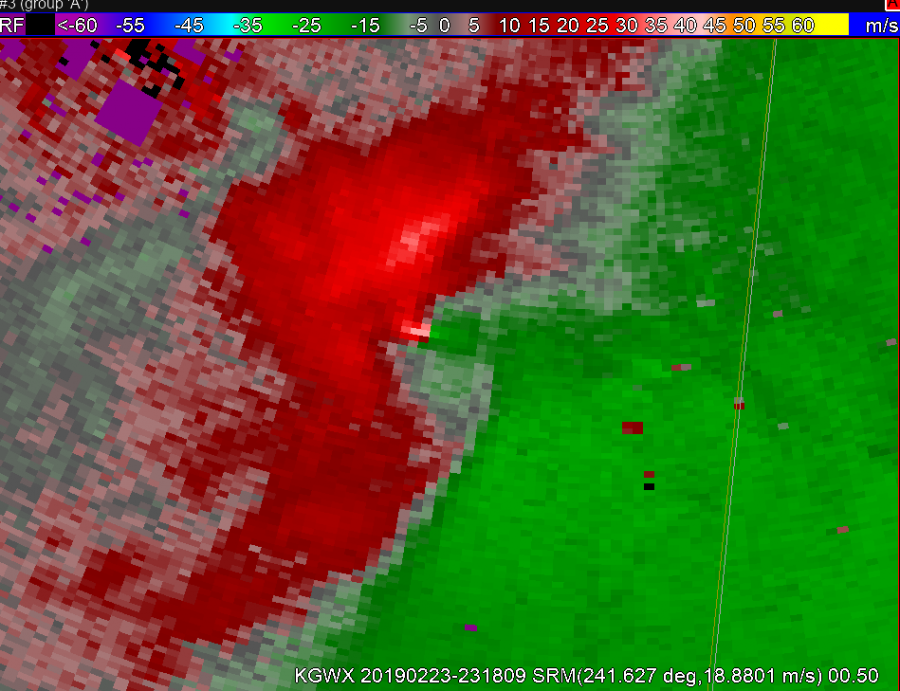
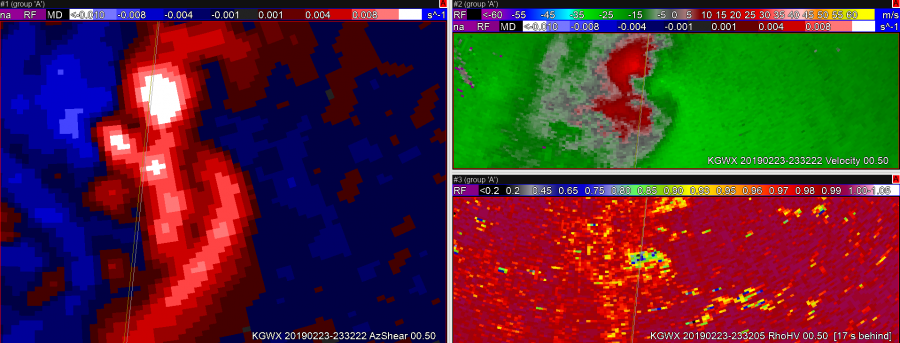
Still have a TDS, but velocity couplet has become very weak.

Sandor Clegane