2000z – Ellis County Tornado report

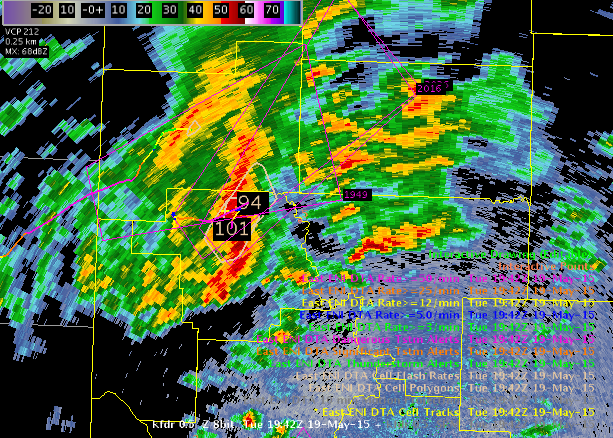
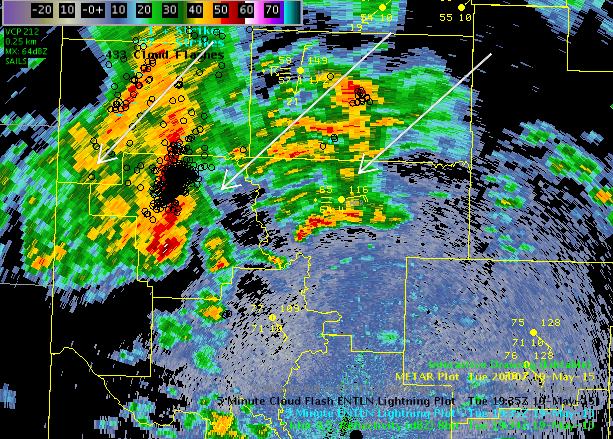
A tornado was reported in Ellis County with tstm near Waxahatchie around 2019z. Due to distance from kdyz radar…we were overshooting the low-level rotational signature. This storm had about 55dbz reflectivity at -20c. Since it was a marginally severe storm…with uncertainty on rotation…no warning was issued.

Possible EWP clues…

GOES R superscan did indicate a strong updraft with visible overshooting tops…although not picked up GOES CI and overshooting top detection.

At 1936z…ENI DTA was alerted on this storm…but CIMSS prob svr never increased more than 20 percent.  prob svr and dta 1936z

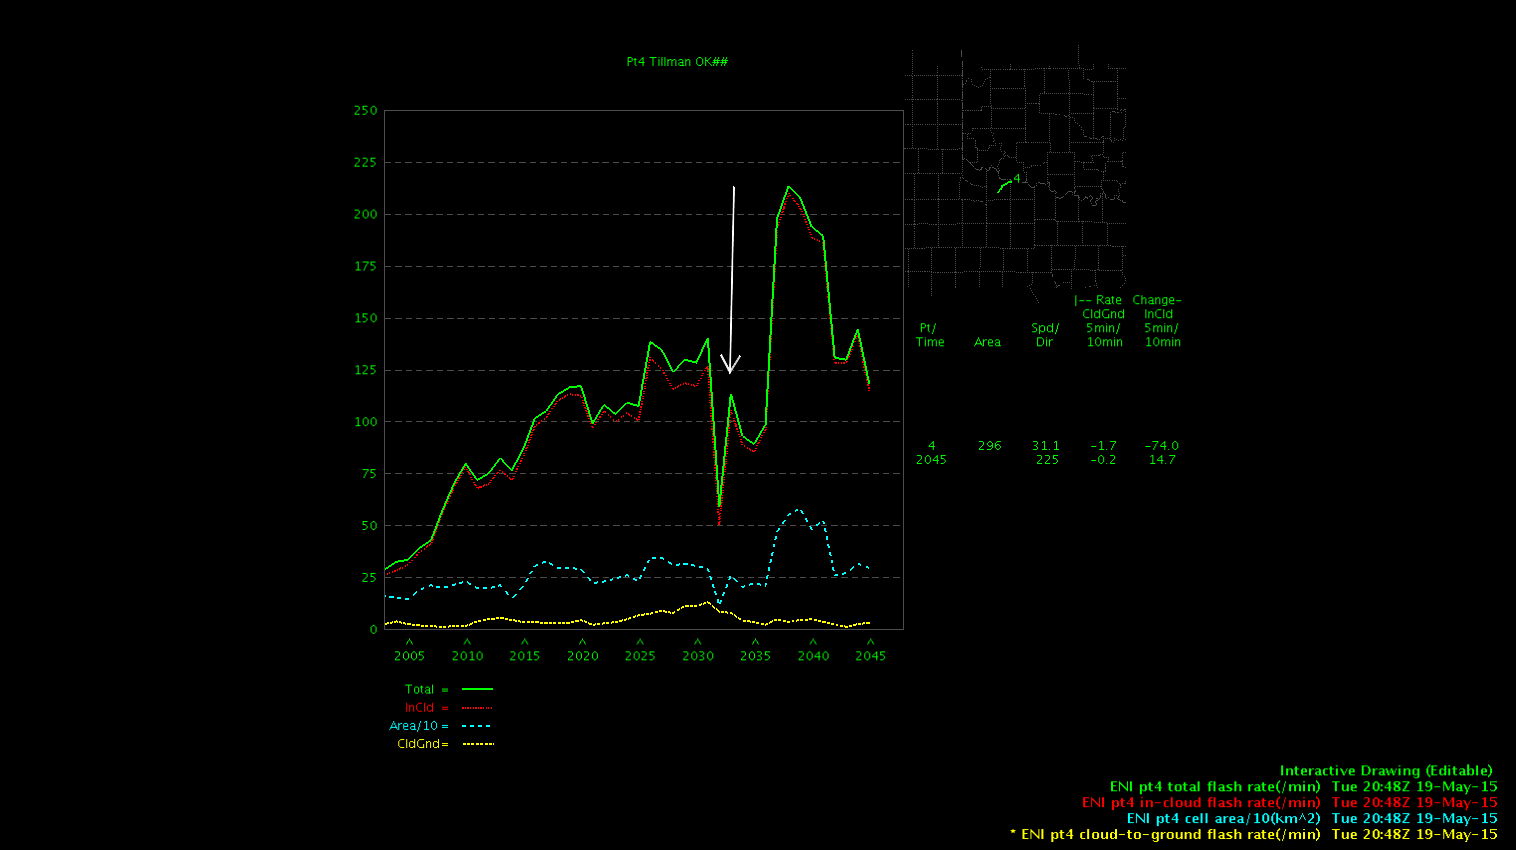
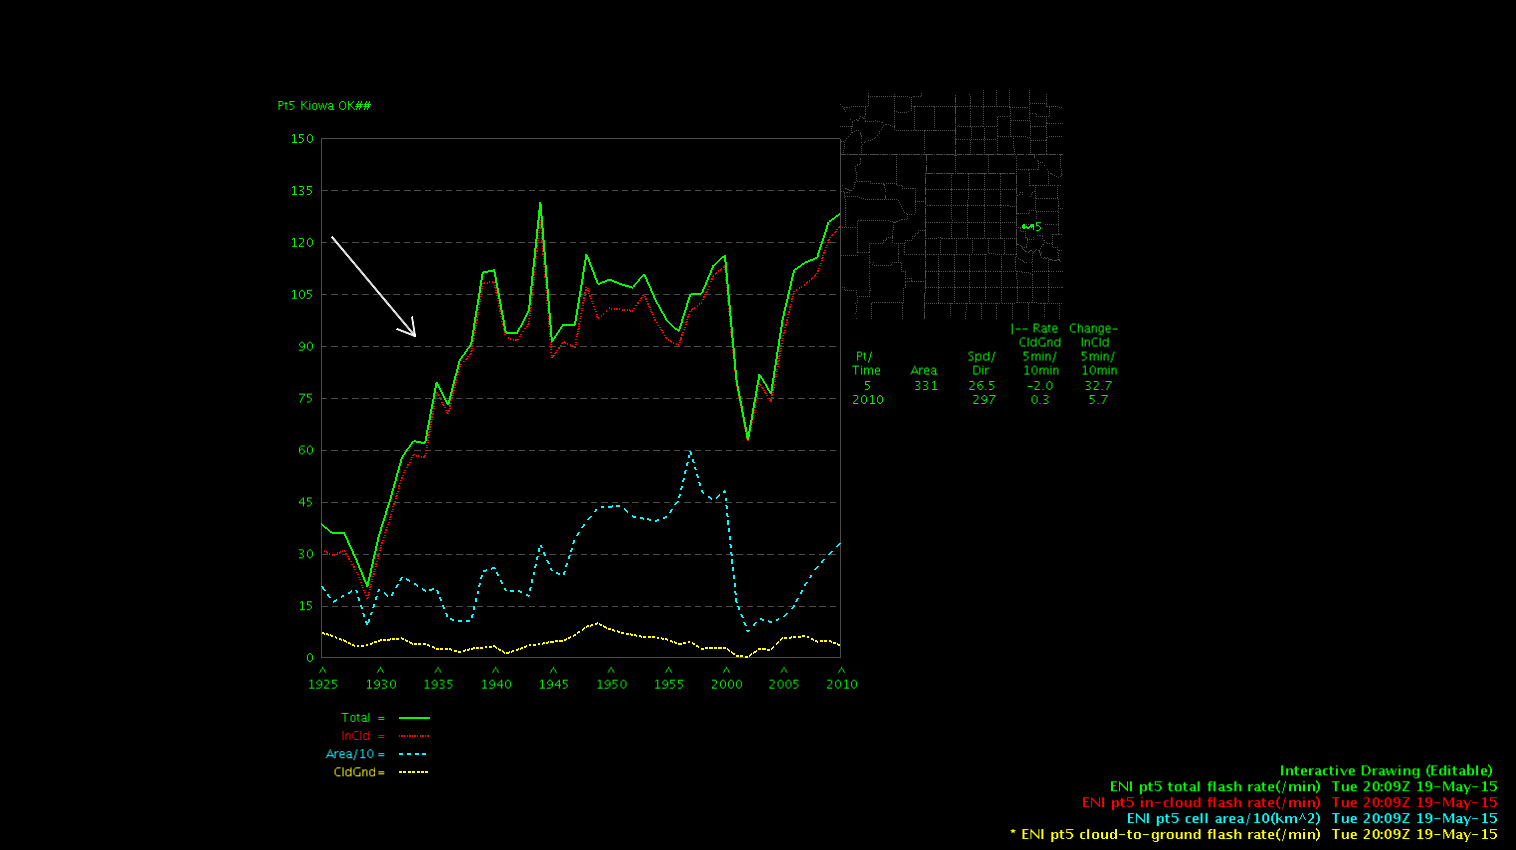
ENI flash rate trace below…showed a rapid doubling in lightning btwn 1940 and 1950z…indicating transition from an ordinary cell to a supercell. The tornado report was during the down trend in lightning. Previous studies have shown that this could be a possible time for tornado development as the storm weakens and rfd collapses.

lightning falsh rate ellis cty

So GOER R superscan, ENI lightning rate trace, and DTA could have been useful signals to warn on this marginally severe storm development. The ENI lightning trace could have pointed towards potential for tornadogenesis…based on conducive environment and possible weak boundary.

Pickles

Tags: None

ENI Lightning Dip With Tornado

Two tornado reports were received with a storm northeast of Electra, TX near the Red River and around the same time, a drop in the total lightning data was observed. Although the ENI polygons converted to two polygons for the storm at 2020Z, the total lightning drop looks appropriate.

Display: The lightning drop was best seen in the trend box time v height display.

2033Z_CellPoly_Rates 2033Z_TorReport_LightningTrend

Tags: None

ENI 300% Flash Increase, To Warn or Not To Warn?

As a warning forecaster, trying to weigh a large total flash rate increase with the near-storm environment and radar data can be a challenge. The lightning trend jumped from about 30 flashes to around 120 in 15 mins (see trend box graphic with cyan arrow) for a line segment along a stationary front and CAPE gradient.  From a warning perspective, the jump in lightning increased my SA for that storm cluster and I awaited for signs of increase in the radar signals. However, knowing the storm was in a modest CAPE pool and on the frontal/CAPE gradient, I did not have the confidence to warn on the lightning jump alone. The jump began at 1930Z, as of 2025Z there have been no reports or further severe indications in the radar data.

Display: I find the ENI Cell Polygon rate numeric plots (inside the black box) and polys most useful to draw me in, in concert with a trend box for the cell in another pane. I found myself looking beyond or over the alert polygons, not taking the information into my processing.

Data QC: The trend information box plots matched the plan view flash data well.

Images: Cyan arrow indicate the frontal boundary. The storm of interest was in northern Greer county.

capeGradientGreer CellFlashRates CellRateTrneds refl_ltg_plan

Tags: None

2000z FWD

GOES CI is picking up on CI across west central portions of the cwa…but interestingly enough not picking up on the circled likely severe cell and cell to its ne below. Prob severe of 80% and DTA detected at 1930z. (Fig2)Overshooting top detection has not picked up on this cell either. The GOES-R superscan (Fig 1) is very nicely showing the overshooting top on this and cell to the ne.overshooting top DFW 2010zCI 1945z

Pickles

Tags: None

Storm Pulsing Back Up Over OUN CWA

Using ProbSevere and the ENI lightning flash rate time series, I issued a new SVR warning. I like having both data side by side to add confidence when examining the raw radar data. This storm has pulsed up and down over the last hour or two, so the ProbSevere helps keep the SA up when it maxed out at 80% when I issued the warning.

lightningflashrate_timeseries_2008z probsevere_2008z

Tags: None

1930z FWD

Latest GOES R- LAP algorithm trends indicating increasing instability and moisture across the CWA to the south of a fairly stationary warm front across Oklahoma.

Highest instability/moisture exists across se portions of the CWA…tapering to moderate across nw portions of the region. (Fig 1&2)This matches fairly well with model progs. But this enviromnment is being advecting nw based on s/se flow low-level flow. Model analysis indicates strongest deep layer shear values will be across nw portions of the cwa (around 40kt)…with marginal values across se portions (25 kt). Combined shear/instability fields indicate highest potential for organized severe weather will be across NW half of the cwa this afternoon…with more isolated threat farther se. In general large hail and wind threat are supported by the high instability and adequate to strong shear. Tornado threat exists as well based on modest low-level helicity and shear values.

GOES LAP 18zGOES LAP LI 18z  Pickles

Tags: None

LAPS Data for Mesoanalysis

The LAPs data provided useful information for analyzing the current environment in the Lubbock CWA (and surrounding region) as well as trends in the data. Precipitable Water and CAPE are two great examples.

The PW image shows the approaching dryline from New Mexico with increasing PW out ahead of it. A loop of the data shows increasing values from MAF CWA north into very southern portion of  LUB. A similar trend is seen in the CAPE values with max values of 2500 to 3000 well to the south.   The 12Z KMAF Sounding (below) shows the low level moist airmass. When modified it indicates CAPE Values approaching 3800.

Expect the best chance of severe storms will be the Eastern portion of the LUB CWA as conditions continue to destabilize this afternoon and dry line progresses eastward.

-snowstrm

LAP_PWLAPS_CAPE KMAF12ZSounding

Tags: None