

So what was the purpose of this trip? I found myself asking that question up to the last minute before entering the office on the first day. Instruction as to what and how we’d be evaluating anything was rather lacking until we got there. But come to find out this seemed to be a little by design. It seemed the HWT crew wanted us evaluating things just a bit cold and out of our element to switch up our mindsets kick us out of our comfort zones. They kept us with just the vaguest idea of what we were getting into, in order to keep us on our toes. The thought was that this would then open our minds to new ideas of using the new stuff they had for us on Day 1 in a warning environment.
Ultimately, there were a few things that we did need to maintain focus for and evaluate. A few questions stood out. Where were these new techniques, algorithms, and products, which the presenters had for us in prearrival training, most useful in ours or someone else’s operations. Were there any immediately noticeable problems or could we find any circumstances where they break or have problems? Also, how well did they work for the aspects of the forecast/warning ops that each “test subject” was used to working in. And I do refer to us as “Test Subjects” as it seemed at times like we were also under as much scrutiny as the stuff we were evaluating.
Each morning the four forecasters(us) would huddle in a round table surrounded by a large group of about twenty masters and PHDs; each with their own axe to grind project to evaluate. We were quizzed over the previous day in what went right, what didn’t, and how these new items would affect or help operations. It was a lot like being stuck in a goldfish bowl at the front of a premier aquarium and being the first exhibit on display. Those people really want to see which way a person swims…. And you know me… I enjoy upside down, sideways, and at a diagonal.
As for the stuff we were evaluating. There were about ten or more items. I’ll start with simulated satellite technique.
#1 Simulated Satellite Imagery (Technique). The WRF has the ability to simulate satellite Imagery for both IR and WV. This technique allows a forecast to match up current WV or/and IR Satellite to what is in the models and compare the results. The idea being where the satellite matched the model at start is a place for high confidence to the forecaster. Areas where the model and satellite do not match means that the forecaster has low confidence in that area of the model and the forecaster should choose something else to use for the forecast.
The technique did just that. In many places where low stratus or cirrus was over or underrepresented when compared to reality the model solution was immediately put in question, while places where the model handled these features correctly brought high confidence to the immediate forecast for the next 6 hours. Personally, I would like to see this technique sent over to other models as well such as the NAM, HRRR, and GFS. A forecaster could then actually initiate a forecast by finding guidance which best matched the current reality.
WRF data including this simulated satellite in IR and WV is available for our GGW office right now. However we have to request this data from Western Region to get it.
#2. GOES-R Convective Initiation. This was a tool that is becoming part of a set of algorithms for the satellite “cradle to grave” concept of storm interpretation. This algorithm works during the cradle phase of a storms life cycle. The tool used initial growth rates to help pick out winners and losers for storms before their development. Once a storm initiates it is discarder allowing the forecaster to focus on the next storm. Unfortunately, this tool did not so much pick out winners and losers for initiation as it very quickly picked up on whole large areas for development. So, while missing its intended purpose, It did seem to find and equally welcome home for the mesoscale forecaster, warning coordinator, or SPC forecaster. One of the other problems here was that the tool had a hard time graphically pointing towards which storms were becoming active due to its rainbow colored chart at the top of the probability scale while doing a really good job of showing which one were not active… due to the monochromatic blue at the low end of the color chart. This was due to the color choice for the probability charts. If a dichromatic color chart such as Prob Severe’s (Blue, fade White, fade Red) was used, the CI algorithm would probably stand out a lot better for determining where large areas of storm development are expected which is the unintended purpose of this algorithm. This would draw the eye from areas of non-interest immediately to areas of interest.
#3. Overshooting Top Detection. This is another algorithm from the cradle to grave concept focused around the mature stage of the thunderstorm lifecycle. The algorithm would pick out where overshooting tops(OTs) were on storms and place a red dot directly over it, drawing the eye in. The point being that if an OT exists for a storm, then the storm is very likely to have severe weather. I could tell that right away warning operations for WFOs were probably not going to be the main focus of the this algorithm, as radar can tell long before a storm has an OT that it is severe. This tool will experience its main use in places where a radar is not the primary focus or does not exist… such as over oceans or the Great Lakes. This will probably be a helpful product for the AWC or CWSUs for helping in routing traffic. This algorithm also had some issues with identifying OTs. It missed about a third of the OTs and also had some incorrectly identified OTs were there weren’t any. This algorithms Hit/Miss/FAR scores will probably improve with the onset of 1 minute super rapid scan satellite era.
#4. GOES-14 One minute super rapid scan. What more is there really to say? Where a met used to only get 15 minute images to piece together between the constant radar updates, now there will be satellite data on a temporal frequency higher than the normal radar can keep up with. This will help for identifying boundary placement and evolution and storm initiation placement. When radar goes down this could quickly become a go-to product with plenty of potential for cradle to grave storm algorithm development.
#5. Near Cast System. This is an algorithm developed to allow for following areas of instability on satellite and extrapolating them into the future. It finds the theta-e near the surface and subtracts that from theta-e in the mid-level. Areas with the greatest difference were primed for some form of storm development. This algorithm also allowed to extrapolation of low level precipitable water fields/boundaries into the future which was useful as well. The big problem with the theta-e difference field was in determining exactly “what” it was that it was showing/saying. On some occasions a theta-e diff max would pass through an area and initiate storms but then exit the area leaving a monster cell behind it. Other times it seemed like a theta-e diff max would be feeding directly into a single storm. Still other times the storms seemed to simply ride along a moving boundary of high theta-e difference. While I have no doubt that it is important as an ingredient in storm development. Determining what its best used for in operations will be a subject of future debate, with many different methods of use likely cropping up from the operational and academic community involving mesoscale forecasting.
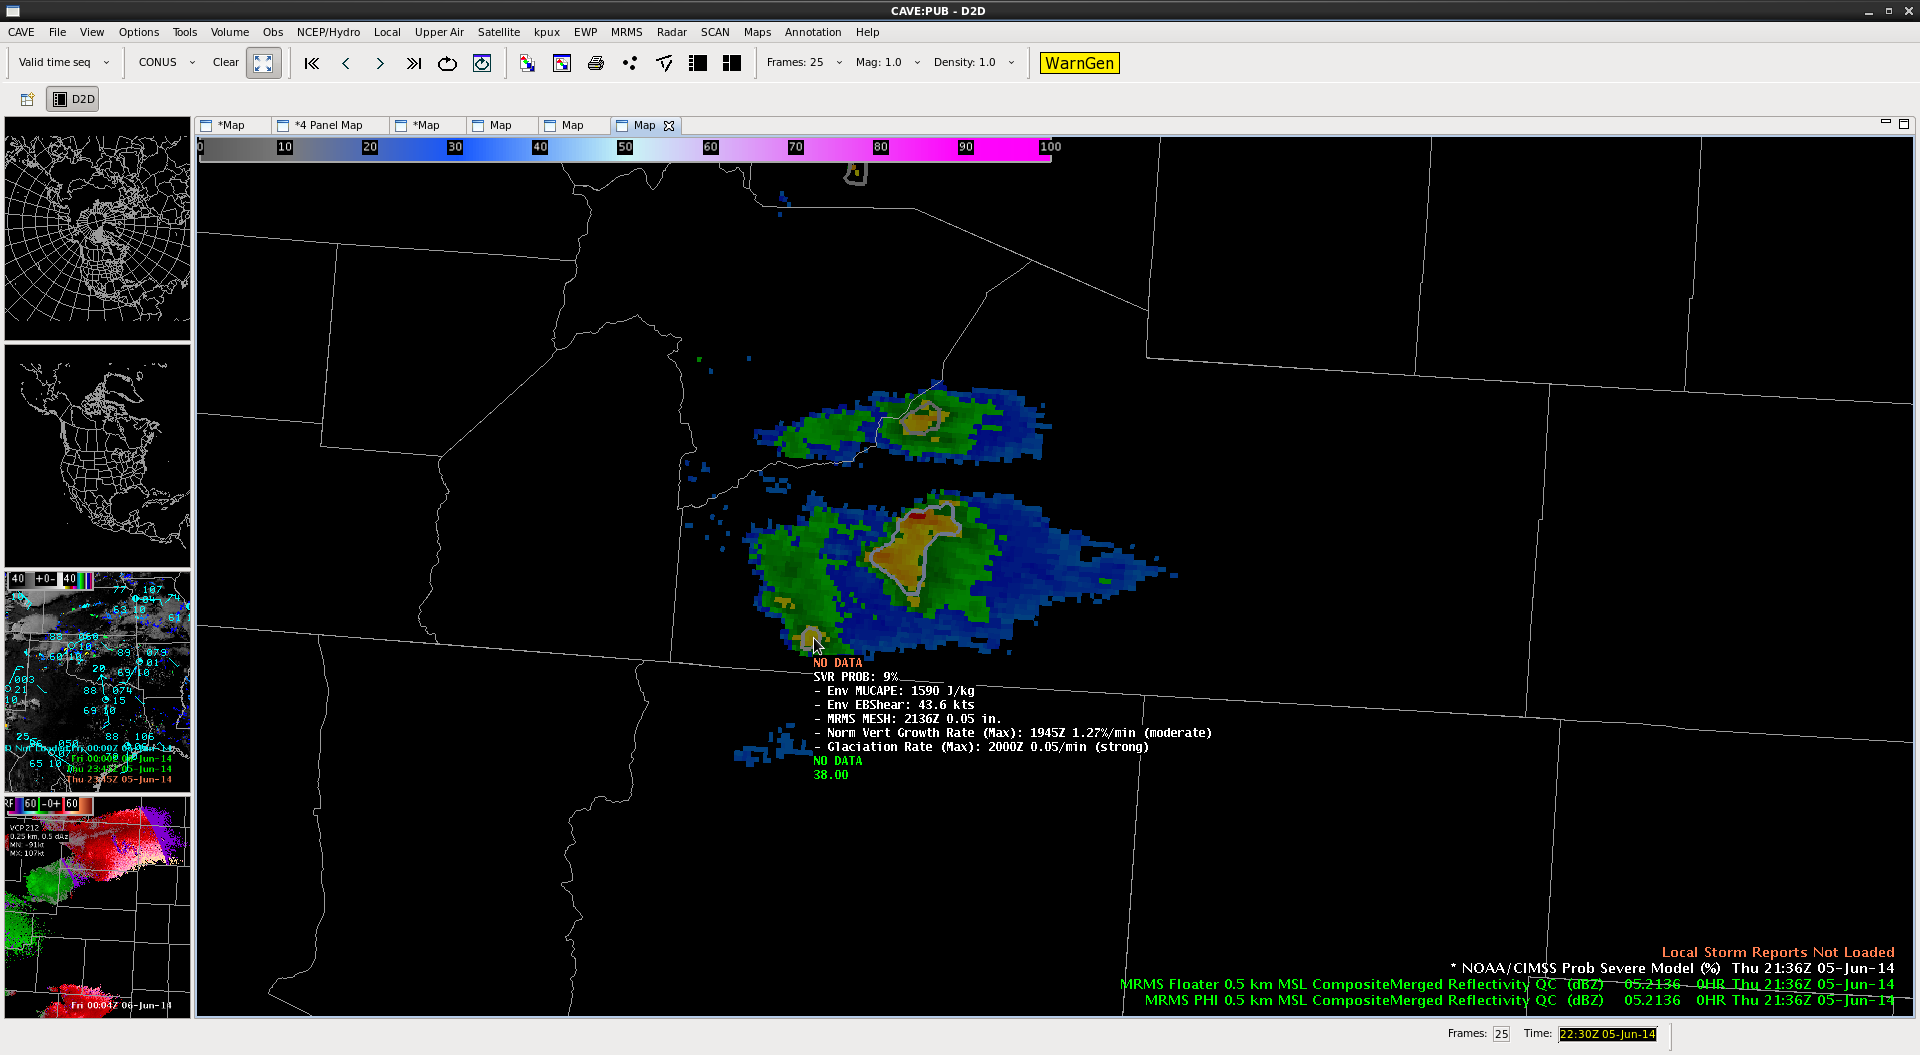
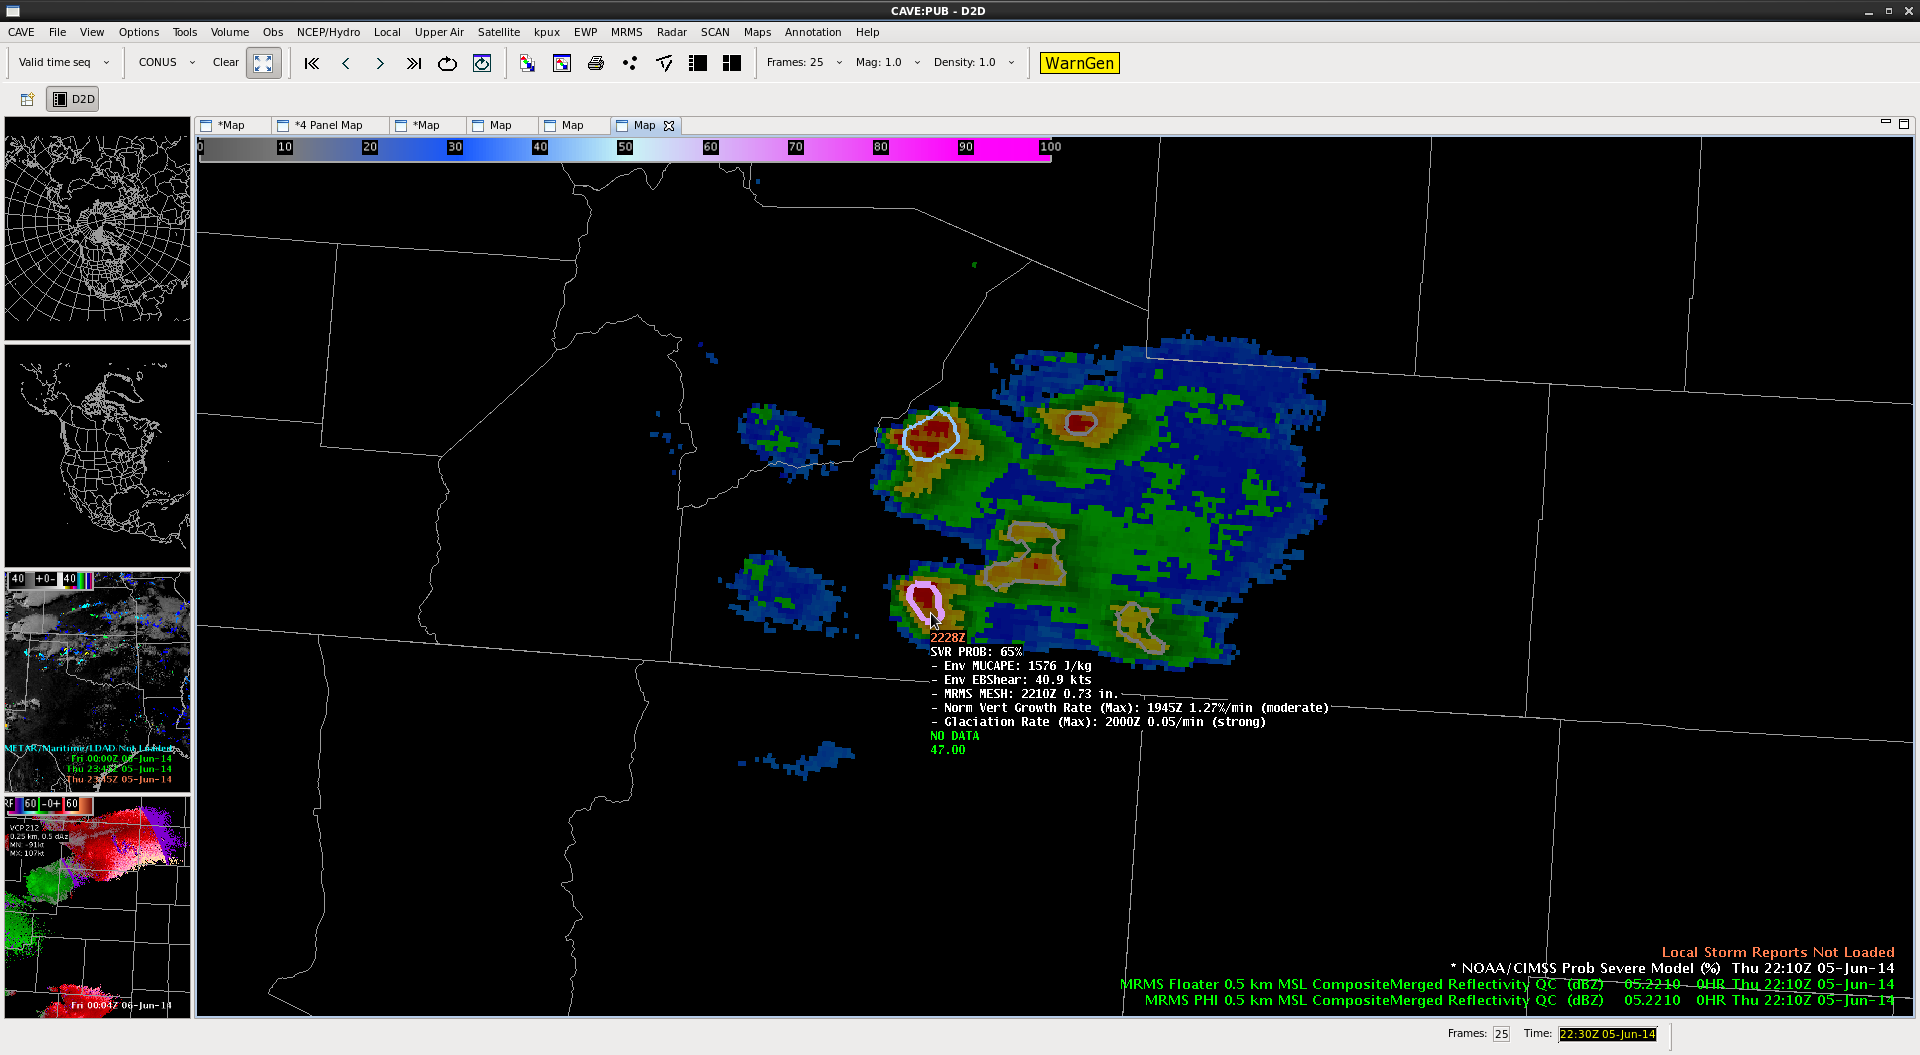
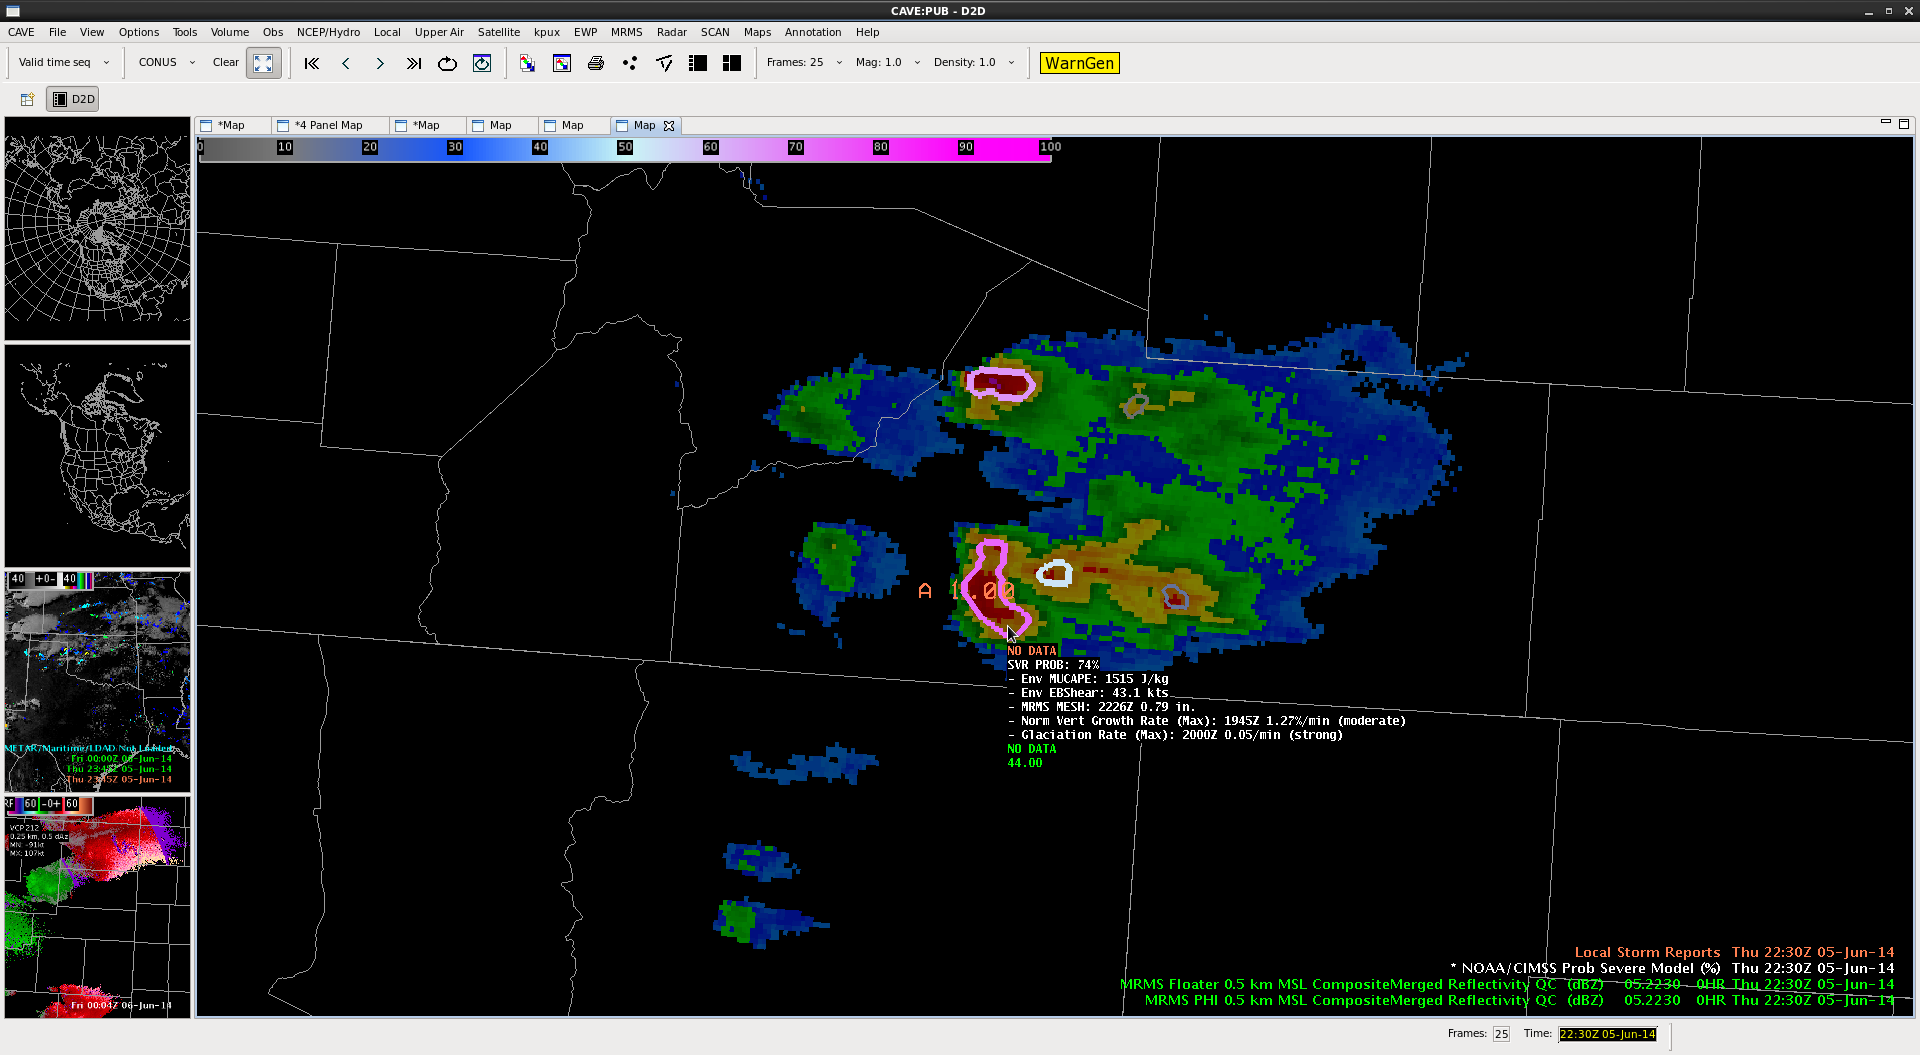
#5. Prob Severe Algorithm. This is an algorithm that pulls from many different and new sources to determine what the chance is that a storm has become severe and then label the storm with a changing color coded band when it is reaching a high probability of severe output. I think this algorithm was more highly calibrated for hail than for winds. Unfortunately, the time spent on wind evaluation was close to nil and I wish I had a couple more shots at this. However, the new hail size algorithm was far superior to the old one with totals far closer to the verified reports. The colored bands also help pull the warning operator’s eye onto the storms of focus on the map at any moment in time. In fact the color bands could quickly alert a met to focus on a storm that would otherwise normally get less attention…. such as a heavy hail producing left split, when the right split is typically more favored for hail and severe weather. This helps for quick prioritization when multiple cells are popping up. Monitoring the color trend on the bands also drew the eye into which storms are most likely to produce severe in the next few minutes, which storms are not, and which storms are slowly dying.
#6. Multiple Radar/Multiple Sensor (MRMS). What this did was grab all the scans from different surroundings radars and create a composite image. This included multiple WSR-88Ds, CASAs, Phased Array, and Canadian Radars. It has also allowed underlying algorithms to have access to more data/scans when determining the strength of a cell as they no long relied on only one radar worth of data. This is probably the main reason for the overall improvement of the hail size algorithm. With MRMS radar coming to AWIPS 2 this does mean that the GGW office will finally get Canadian radars in AWIPs which are sorely needed and arriving far later than they ever should have. This program could probably benefit from using the 3D viewer that exists in GR2 Analyst. The viewer allows for varying levels of transparency corresponding to dBz color charts. This means that a transparent outer ghost of a storm is present and showcasing off the inner movements. The movements can quickly show when a hail core has been cut off from its moisture supply/support and is about to collapse in a microburst or hail drop. If the GR2 3D view was combined with the multiple sources of MRMS then mets would have access to a truly complete 3D storm environment for interrogation.
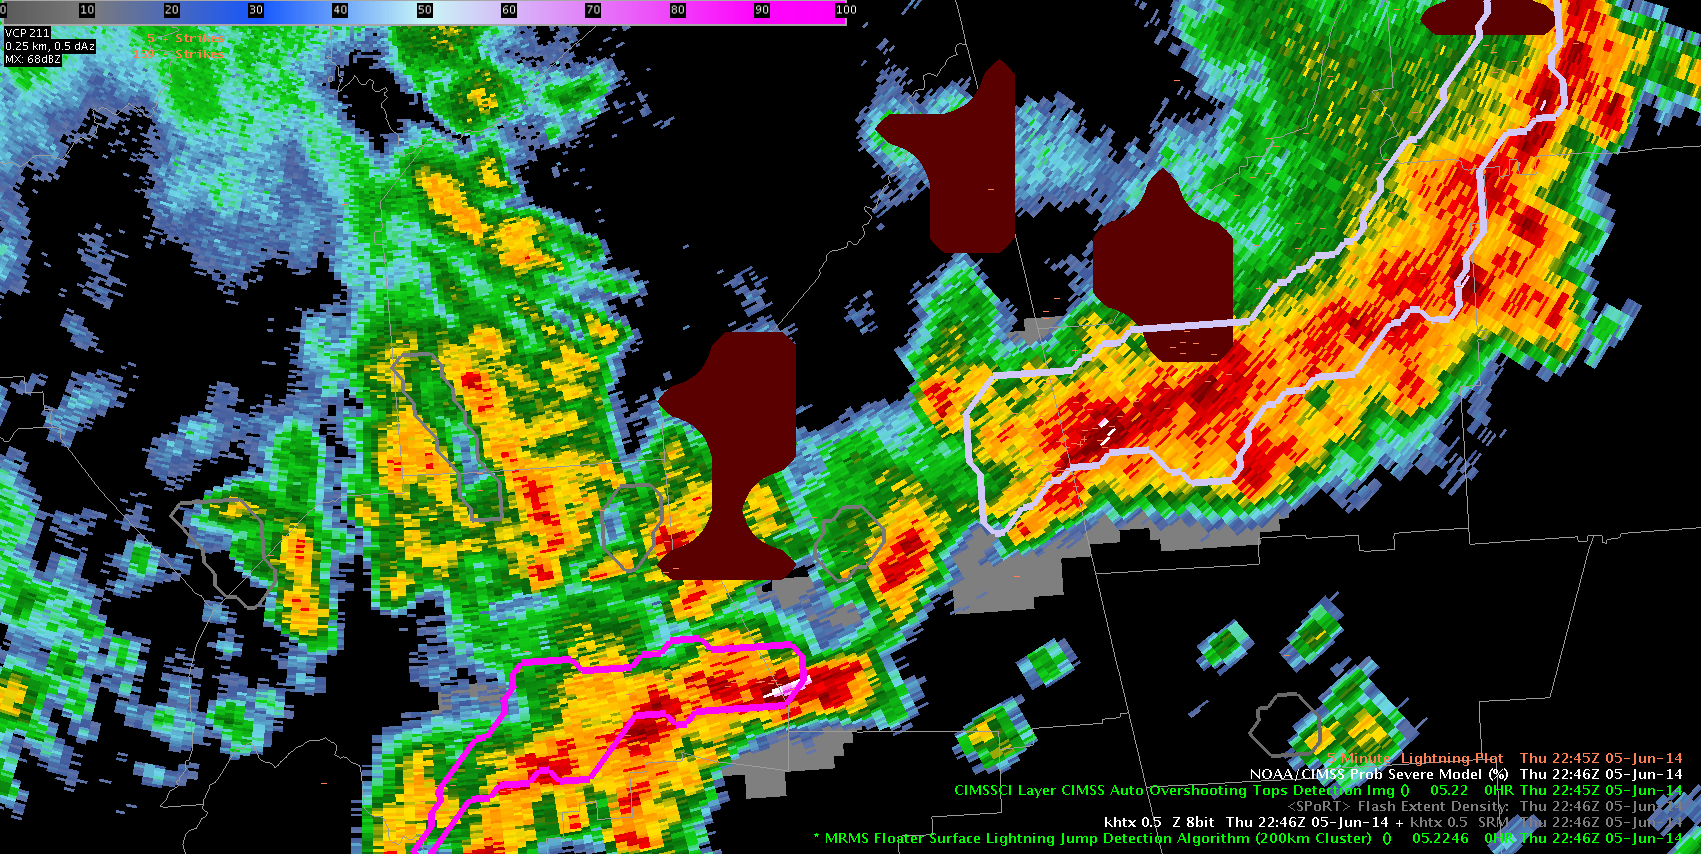
#7. PGLM Total Lightning. In the era of GOES-R the numbers of optical flashes corresponding to lightning are going to be recorded. A direct correlation to optical flashes with ground instruments has been found which allows for calculation of total lightning. This Includes finding density of initiation of strokes and density of extent of strokes produced in a coarse square pattern in addition to the normal CG data. The data on Satellite may not be exact to what we see now with the ground based instruments; but will be very close. One of the biggest advantages of this will be the ability to see a storm in a different way which could be completely devoid of radar. So, if radar goes down this will be a great thing to bring up.
#8. Lightning Jump Detection Algorithm. This is slightly different from the coarser square flash density algorithms above. This algorithm uses either radar or satellite to confine a higher resolution shaped band to lightning that is ongoing, similar to the Prob of Severe. The usefulness here is that the bands are then coded to correspond to how much change there is in lightning development which is then normalized and placed on a standard deviations chart. It turns out that when total lightning spikes and standard deviations rise above 3, the chances for severe weather spike right along with it… and there is typically a 15 to 20 minute delay before this weather impacts the ground. This is a sweet spot of information to the warning meteorologist and really makes this the star algorithm of the HWP show. It was demonstrated on shift that this algorithm with satellite can still allow a meteorologist to warn without radar and have a lead time. It also allows a met another method for picking out winners and losers in convective initiation mode for the first severe storms of a developing cluster. Low resolutions of this algorithm could be tricked into thinking there was a jump of 3 or more standard deviations when two storms were very close together; but when a higher resolution was overlaid it could immediately point out this false alarm.
#9. Tracking tool. Right up front, this tool is still in development, and should be given some more time before a final judgment is rendered. Rather than have an algorithm following a cell and placing data in a SCAN meteogram. They have provided the meteorologist the ability to define the placement of the cell himself and determine where the cell came from and how large the cell is. This algorithm has usefulness if there is one storm of importance where the met can take the time to do all the adjustments. However, there are many more negatives at the moment. Some of which simply come from the fact that the algorithm still needs work to run. Currently this tracking tool has a tendency to crash AWIPS2 Cave or hang it up for long periods of time. I also worry that under large storm outbreaks where a radar met cannot focus on one storm this tool will quickly become useless along with the normal subtleties that typically disappear under these situations. This tool may end up being useful for things other than warning ops such as tracking, timing, and trending strength of a non-linear wave in WV satellite imagery. As for the meteograms generated from the tool, these may be more useful if they can be popped out of the D2D display as a separate window to be manipulated or moved around the screen similar to SCAN’s method.
#10. vLAPs. Taking the traditional LAPs analysis and extrapolating this about 2 hours into the future. How exactly this was done I’m not totally sure. What I can say for this product is that the CAPE fields were particularly impressive and show all kinds of detail from afternoon non-thunderstorm convective cells, changes due to lakes and rivers, and outflow boundaries from collapsing storms. The level of detail and user visualization for CAPE has yet to be seen by this forecaster in any other model and seems on par if not above the HRRR capability itself. I wish I had a few more hours to play with the many other output parameters that were at the edge of normal convective mode use. Alas… by the time I realized they existed and began formulating methods for testing them the vLAPs either began having bad times due to internal run problems or was operating on a domain divorced from the field office I was shadowing.
For the program as a whole I would like to make the recommendation that schedule hours be moved up about an hour, maybe two. This would allow the mets to have time to play with some toys in a pre-storm environment for evaluation. Almost half the tools up for evaluation were needed to be run prior to warning mode to catch their effectiveness and almost every time we started loading up ops in a CWA the storms were firing or had already fired. I also have to say that being part of the Experimental Forecast Programs briefing each morning before beginning our own ops was very enlightening.
The program overall was an amazing blast to be part of and I did genuinely enjoy helping to make the future tech better with what little input I was able to offer. I look forward to doing it again, but hope to wait a couple years to allow the current tech to cycle through other opinions and a fresh wave tech and ideas to overwhelm me yet again if I’m ever allowed back.
Grant Hicks
General Forecaster
Glasgow, MT NWS
P.S.
For those that stayed with me this far there are Powerpoints with the weeks in review called “Tales from the testbed” available here.
http://hwt.nssl.noaa.gov/ewp/internal/2014/
GGW for the represent during Week 3, W00t W00t!
http://hwt.nssl.noaa.gov/spring_experiment/tales/2014-wk3/


