
EWP2013 PROJECT OVERVIEW:
The National Oceanic and Atmospheric Administration (NOAA) Hazardous Weather Testbed (HWT) in Norman, Oklahoma, is a joint project of the National Weather Service (NWS) and the National Severe Storms Laboratory (NSSL). The HWT provides a conceptual framework and a physical space to foster collaboration between research and operations to test and evaluate emerging technologies and science for NWS operations. The Experimental Warning Program (EWP) at the HWT is hosting the 2013 Spring Program (EWP2013). This is the sixth year for EWP activities in the testbed. EWP2013 takes place across three weeks (Monday – Friday), from 6 May through 24 May.
EWP2013 is designed to test and evaluate new applications, techniques, and products to support Weather Forecast Office (WFO) severe convective weather warning operations. There will be three primary projects geared toward WFO applications this spring, 1) evaluation of multiple CONUS GOES-R convective applications, including pseudo-geostationary lightning mapper products when operations are expected within the Lightning Mapping Array domains (OK/west-TX, AL, DC, FL), 2) evaluation of model performance and forecast utility of the OUN WRF when operations are expected in the Southern Plains, and 3) evaluation of model performance and forecast utility of the 1-km and 3-km WRF initialized with LAPS.
PARTICIPANTS:
Our participants included Michael Scotten (WFO, Norman, OK), Joey Picca (WFO, New York, NY), Ernie Ostuno (WFO, Grand Rapids, MI), Becca Mazur (WFO, Cheyenne, WY), and Chris Leonardi (WFO, Charleston, WV). The GOES-R program office, the NOAA Global Systems Divisions (GSD), and NWS WFO Huntsville’s Applications Integration Meteorologist (AIM) Program have generously provided travel stipends for our participants from NWS forecast offices nationwide.
Other visitors included Jordan Gerth (Univ. Wisconsin), Wayne Feltz (Univ. Wisconsin), Hongli Jiang (NOAA/GSD), Amanda Terberg (NWS Air Weather Center GOES-R Liaison), and Helge Tuschy (Deutscher Wetterdienst (DWD; Leipzig, Germany).
Kristin Calhoun was the weekly coordinator. Clark Payne (WDTB) was the “Tales from the Testbed” Webinar facilitator. Our support team also included Darrel Kingfield, Gabe Garfield, Travis Smith, Chris Karstens, Greg Stumpf, Kiel Ortega, Karen Cooper, Lans Rothfusz, Aaron Anderson, and David Andra.
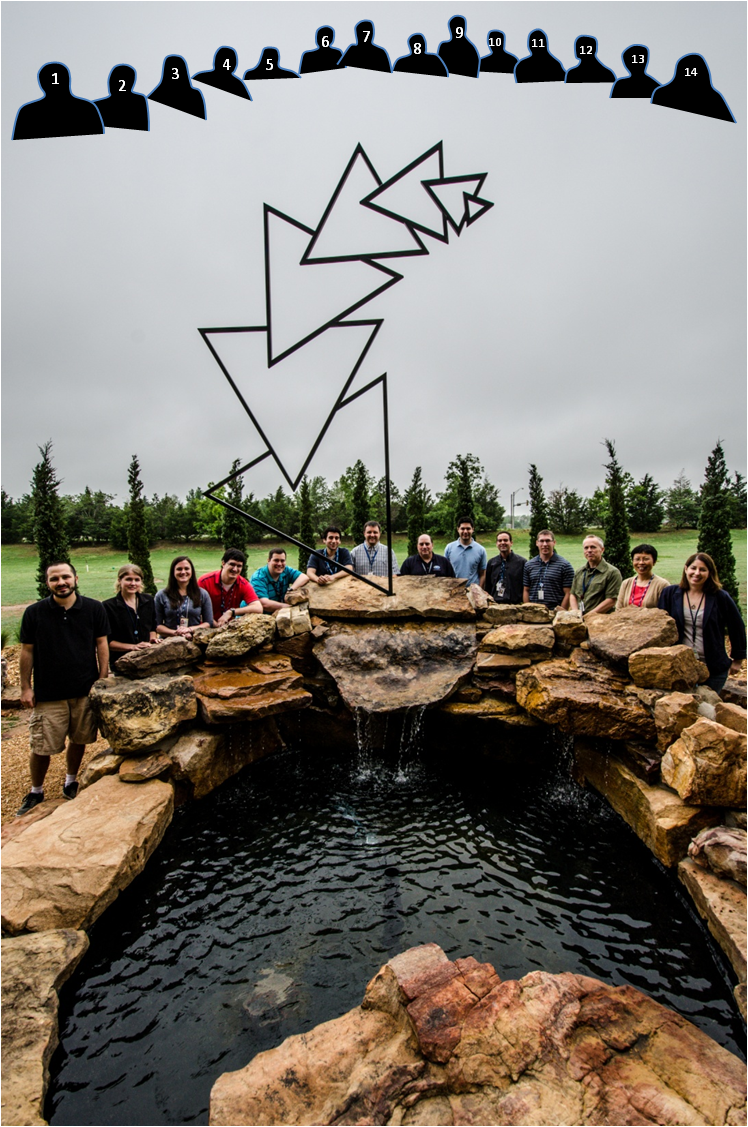
The Experimental Warning Program week #2 group photo: 1) Kiel Ortega (CIMMS/NSSL), 2) Amanda Terborg (UW/CIMSS), 3) Becca Mazur (NWS Cheyenne, WY), 4) Jordan Gerth (UW/CIMSS), 5) Chris Leonardi (NWS Charleston, WV), 6) Joey Picca (NWS New York, NY), 7) Helge Tuschy (DWD, Leipzig, Germany), 8 ) Ernie Ostuno (NWS Cheyenne, WY), 9) Gabe Garfield (CIMMS/NWS Norman, OK), 10) Michael Scotten (NWS Norman, OK), 11) Chris Karstens (CIMMS/NSSL), 12) Jim LaDue (NWS/WDTB), 13) Hongli Jiang (NOAA/GSD), and 14) Kristin Calhoun (CIMMS/NSSL).
REAL-TIME EVENT OVERVIEW:
13 May: Missoula, MT (MSD) and Great Falls, MT (TFX): marginally severe storms w/downbursts and hail as primary risk.
14 May: San Angelo, TX (SJT) and Midland, TX (MAF): Pulse and multi-cellular strong to severe storms in area of dry line circulation. // Des Moines, IA (DMX) mesoscale evaluation surrounding frontal boundary across western Great Lakes – primary threat of high winds.
15 May: Norman, OK (OUN) and Dallas-Ft. Worth (FWD): This was the primary severe weather event of the week. Embedded severe convection in OUN, isolated tornadic supercells in FWD.
16 May: Boulder, CO (BOU), Goodland, KS (GLD) and North Platte, NE (LBF): Marginally severe short-lived storms.
FEEDBACK ON EXPERIMENTAL PRODUCTS:
HSDA:
- Algorithm performed the best during the supercell event in the FWD domain where there were large swaths of giant hail associated with storms in TX.
- More confidence and better verification when region of hail is greater than 1-2 pixels. Forecasters suggest using an area or volume approach to algorithm evaluation.
- HSDA tended to over-predict Giant Hail throughout the week.
- Trend products would be useful.
- HSDA is not level II resolution. It’s also “cleaned up” in AWIPS2.
MRMS:
- Rotation tracks were commonly utilized by the warning forecasters. Particularly useful in determining polygon orientation (size / shape) — this reduced FAR area.
- Rotation tracks and AzShear products were time savers, particularly for situational awareness (calling attention to storms /locations).
- Tornado debris algorithm did not have region of low CC/ZDR co-located with SRM couplet and tornado on 15 May (possible error in algorithm).
- MESH and HSDA provided a useful combination in hail size estimation and confidence.
- A product that shows how many radars are being used to estimate the data in each grid point would be useful.
- MRMS hail indicators would be variable in the mountains – terrain may affect calculations (AGL versus MSL?) or beam blockage causing some radars to not go into the estimates all the time.
- The MRMS “thickness” products saved much time versus trying to estimate these using all-tilts and sampling.
- Normally get height from sounding, and apply to entire domain. MRMS takes a lot of the guessing and legwork out, instant answer. NSE updates hourly versus 12-hourly
- Still good at very little radar coverage at edges of network (e.g., Big Bend) since reflectivity it aloft anyway.
- Really useful when you get rapid developments and descent of elevated cores for pulse storms
- MRMS MESH better on low end days, HSDA better on high end days.
OUN WRF:
- Model reflectivity time ensemble (“d prog dt”) would be helpful.
- Improved from last year, especially with convection timing.
- Note that this year, the OUN WRF was changed from an hourly run to two hourly runs. Cycling radar data, and changed microphysics scheme and PBL scheme.
Variational LAPS:
- The instability field was quite useful when combined with a radar mosaic. Particularly early on in the FWD domain, this field provided clues to when storms would decrease or increase in intensity with time.
- The 22 UTC 1-km forecast was incredibly accurate 2 hrs out (on 15 May). The updraft helicity product was useful in visualizing the location/strength of the activity.
- A 0-6 km shear product is recommended.
- Would be nice to produce similar fields as OUN WRF to compare side by side
- Recommend adding a CIN product.
- Recommend adding more 1km floaters outside the OUN WRF domain.
- Useful for return moisture flow for subsequent convection episodes.
- The stormscale and temporal scale of variational laps is far superior to what’s available at the WFOs right now.
GOES-R Simulated Satellite:
- Comparisons of simulated IR with actual IR provided a quick understanding of where and how model (NSSL-WRF) may be handling convection: e.g., low-cloud cover in simulated IR > enhanced heating > convection initiated too early / too widespread.
- The models were still slightly faster than the synthetic imagery.
- Doesn’t handle anvils very well, but that could be a good thing. Can see where storms are developing without the anvils covering it up.
- There are plans to add a sky cover grid, to apply to other models.
GOES-R UAH SatCast/UW Cloud-Top Cooling:
- Both products need to be combined with environmental knowledge. Storms / regions cycled through multiple signals in CTC.
- CI had poor verification in mountainous terrain (60-70% + FAR) due to snow contamination.
- Cirrus contamination continues to be a problem.
- False CI detections on leading edges of anvils for fast moving storms are a problem at times.
- A threshold cutoff of display filter for the UAH CI is recommended. Anything above 70-80% seems to work best.
GOES-R NEARCAST:
- Interesting to compare CAPE field with LAPS and OUN-WRF modeled field for examining different scenarios and likely outcomes. Overlap on 15 May with LAPS was good and helped inspire confidence.
- Low precipitable water values were useful in determining that storms were unlikely to grow in strength or coverage.
- ThetaE difference helped pull focus onto anticipated area of initiation.
- The Nearcast will be running at the European Severe Storms Laboratory convective weather testbed as well.
- Prefer that the color table is “flipped” to use warm colors for high moisture
- The GOES-E and –W images were not seamless.
GOES-R PLGM and Lightning Trend Tool:
- Peak flash extent densities were useful in picking out which storms deserved more attention and providing additional lead time for severe weather at the ground.
- MESH and lightning flash rates had comparable trends in the OK region, with the flash rates typically preceding MESH by ~1-2 min and reports on the ground by ~15 min.
- Prefer a “less-harsh” color table (grays for lower flash rates better than bright colors). The choice of color (dark green) for the key threshold 30 flash per minute rate doesn’t stand out well. In addition, the yellow-to-green transition is not easy for threshold determination.
- Data dropouts from LMA station failures were difficult to recognize and separate from actual decreases in storm flash rate. Recommend adding a “number of sources” product to identify data dropouts.
- Lightning trend tool (“moving trace”) is useful for pinpointing developing cores quickly using lightning rate increases.
- All forecasters found that manually adjusting each frame in the trend tool tended to be tedious and needed an “apply to all” frames type option for size and spacing.
- Forecasters found trend tool to be too difficult and time-consuming to use in realtime difficult to use, but a good tool for post event evaluation.
- Would like to see similar graphical display from other data or algorithms (e.g., MESH, VIL) on same trend graph.
- Recommend that the default output format for the trend tool to be uninterpolated.
- Need an “Apply to all” feature in the trend tool.
OVERALL COMMENTS:
- Forecasters suggested that researchers may want to limit experimental product evaluation to one or two products for each team at a time.
- Perhaps assign different teams to different products.
- Comparisons between model (LAPS and OUN-WRF) reflectivity fields and observed reflectivity were often used to quickly gather which solution is trending in a better direction.
CONTRIBUTORS:
Kristin Calhoun, EWP2013 Week #2 Weekly Coordinator
Greg Stumpf, EWP2013 Operations Coordinator