As finally promised as an “aside” in this blog entry, I will cover the issue of how using point observations can lead to a misrepresentation of the lead time of a warning.
Consider that one warning is issued, and a single severe weather report is received for that warning. We have a POD = 1 (one report is warning, zero are unwarned), and an FAR = 0 (one warning is verified, zero warnings are false). Nice!
How do we compute the lead time for this warning? Presently, this is done by simply subtracting the warning issuance time from the time of the first report on the storm. From this earlier blog post:
twarningBegins = time that the warning begins
twarningEnds= time that the warning ends
tobsBegins = time that the observation begins
tobsEnds= time that the observation ends
LEAD TIME (lt): tobsBegins – twarningBegins [HIT events only]
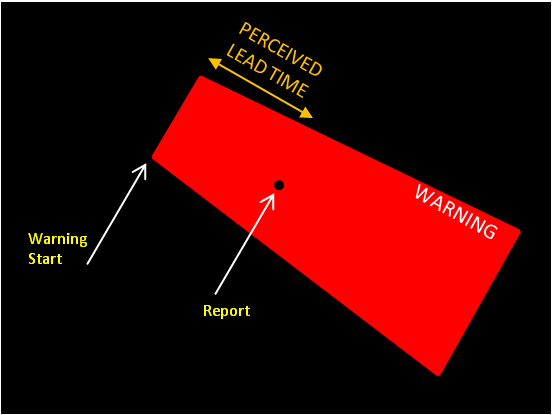
Let’s look at our scenario from the previous blog post:
For ease of illustration, I’m using the spatial scale to represent the time scale. The warning begins at some time twarningBegins, and the report is at a later time tobsBegins. The lead time is shown spatially in the figure, and in this case, it appears that the warning was issued with some appreciable lead time before the event at the reporting location occurs.
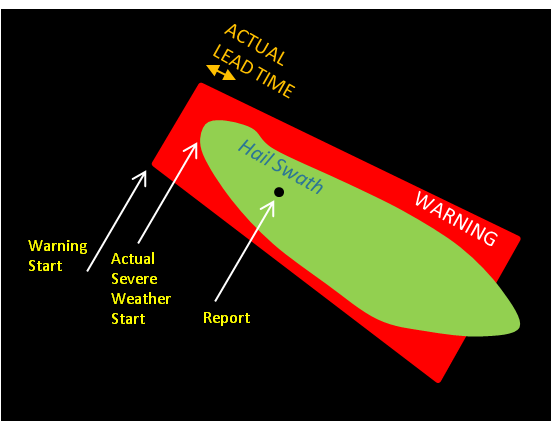
However, as we explained in the previous blog post, reports only represent a single sample of the severe weather event in space in time. How can we be certain that the report above represents the location and time of the very first instance that the storm became severe? In all but probably rare cases, it does not, and the storm became severe at some time prior to the time of that report. This tells us that for pretty much every warning (hail and wind events at least), the computed lead times are erroneously too large! Reality looks more like this:
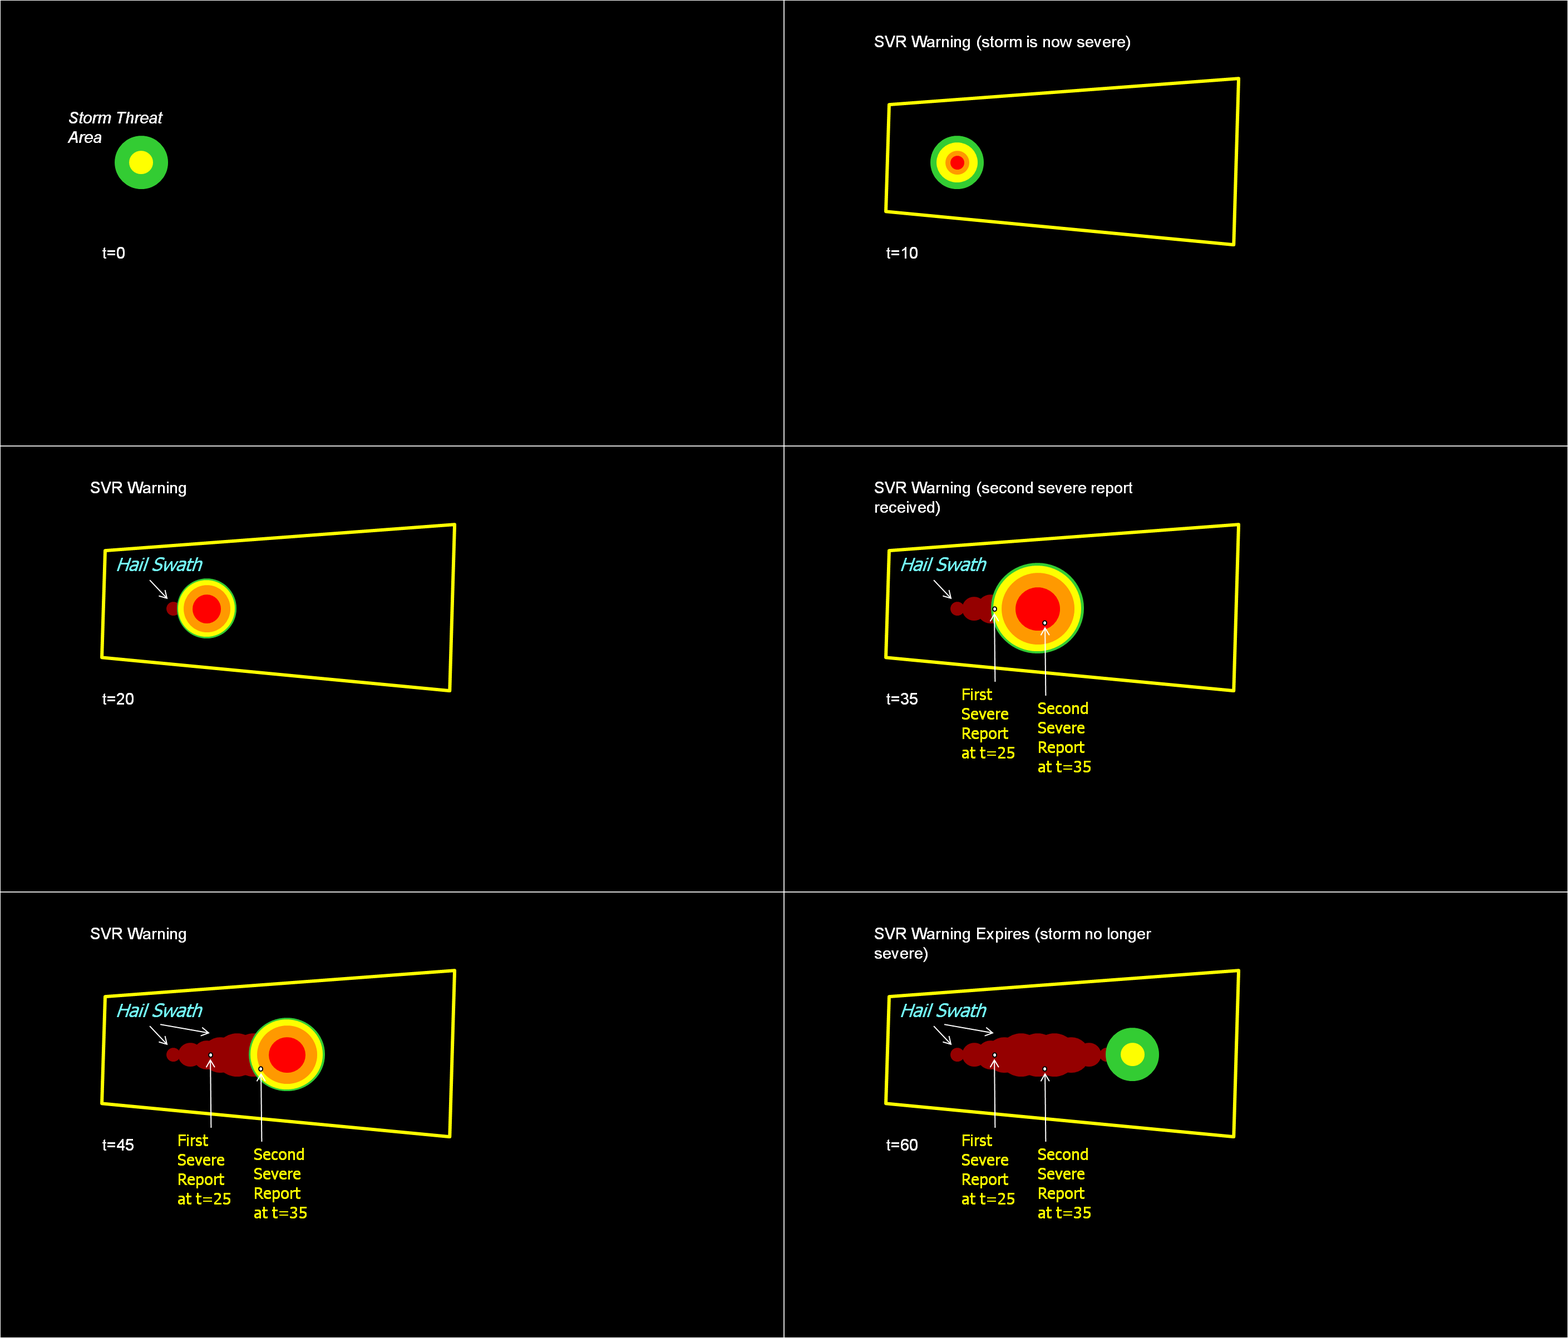
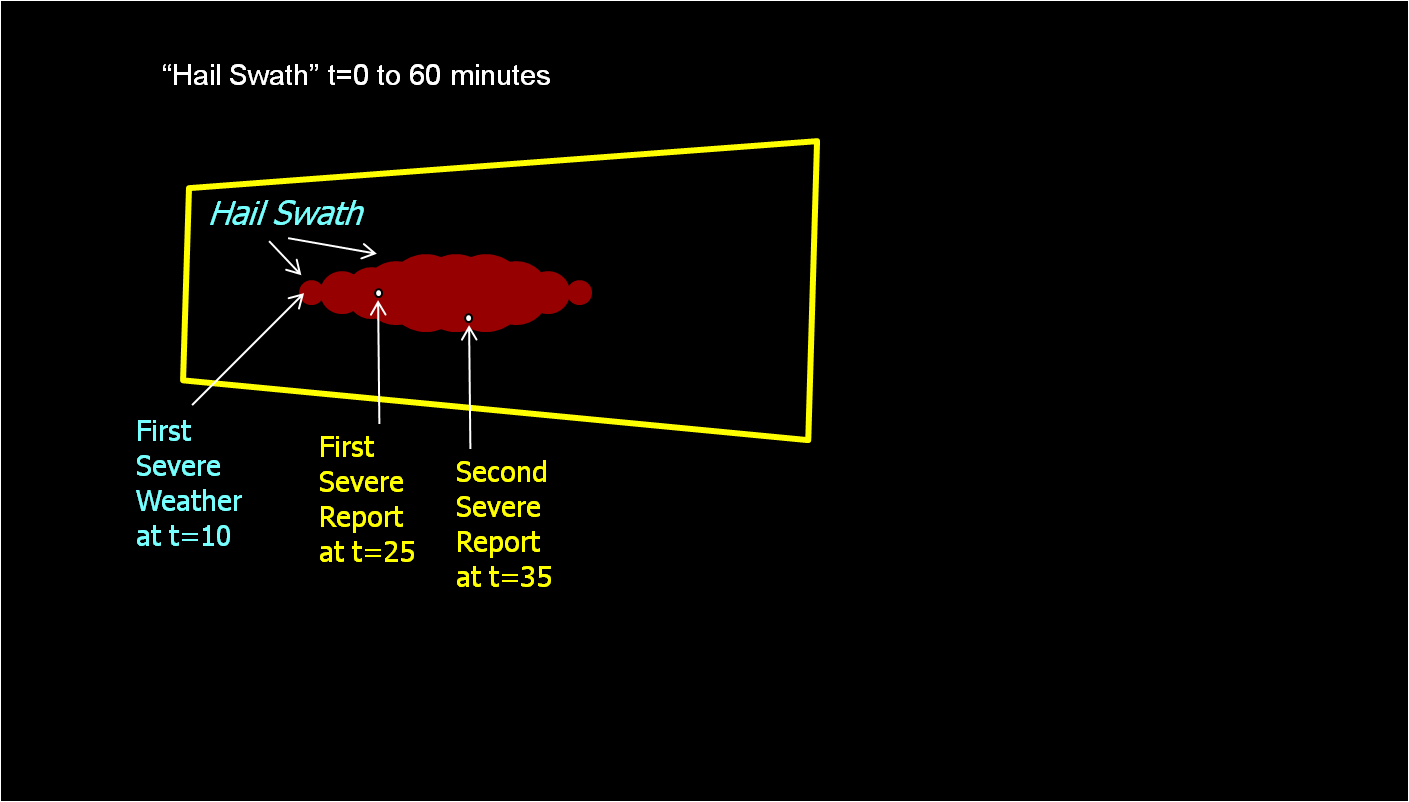
ADDENDUM (1/10/2013): Here is another way to view this so that the timeline of events is better illustrated. In this next example, a warning is issued at t=0 minutes on a storm that is not yet severe, but expected to become severe in the next 10-20 minutes, hence hopefully providing that amount of lead time. Let’s assume that the red contour in the storm indicates the area over which hail >1″ is falling, and when red appears, the storm is officially severe. As the storm moves east, I’ve “accumulated” the severe hail locations into a hail swath (much like the NSSL Hail Swath algorithm works using multiple-radar/multiple-sensor data). Only two storm reports were received on this storm, one at t=25 minutes after the warning was issued, and another at t=35 minutes. That means this warning verified (was not a false alarm), and both reports were warned (two hits, no misses). The lead times for each report were 25 and 35 minutes respectively, but official warning verification uses lead time to the first report known as the initial lead time. Therefore, the lead time recorded for this warning would be 25 minutes, which is very respectable. However, in this case, the storm was actually severe starting at t=10 minutes. The lead time between the start of the warning and the start of severe weather was 15 minutes shorter than that officially recorded.
How can we be more certain of the actual lead times of our warnings? By either gathering more reports on the storm (which isn’t always entirely feasible, although that may be improving with new weather crowdsourcing apps like mPING), or using proxy verification based on a combination of remotely-sensed data (like radar data) and actual reports. Again, more on this later…
Greg Stumpf, CIMMS and NWS/MDL


The hazard associated with each area is subject to change. In fact, there are two components associated with the hazard information. First probability of the hazard and second the corresponding consequences (e.g., Intensity of tornado). I am wondering what is the envision of warn-on-forecast to provide a good framework to capture the hazard information. Uncertainty associated with hazard information is also another issue needs to be addressed.
I haven\’t even touched the subject of probabilistic hazard information (PHI) on the blog yet, and there is a lot to talk about. Yes, there are uncertainties associated with whether or not the phenomenon exists, its location, its intensity, its movement, etc., which would all have to be combined. We\’re in the process of coalescing the vision for PHI and Warn-On-Forecast into FACETs, or Forecasting A Continuum of Environmental Threats. At some point in the near future, I will post about how confidence levels in a threat area can be used to create different warning thresholds for users with different risks. How would the verification scores be impacted by the varying thresholds? And how improvements in modeling and forecast skill in the future would lead to improvements in hazard forecast confidence and thus the proverbial \”improvements in lead time\”, and what that really means.