I’m back after a too-lengthy absence from this blog. I’ve been thinking about some experimental warning issues again lately, and have a few things to add to the blog regarding some more pitfalls of our current warning verification methodology. I hinted on these in past posts, but would like to expand upon them.
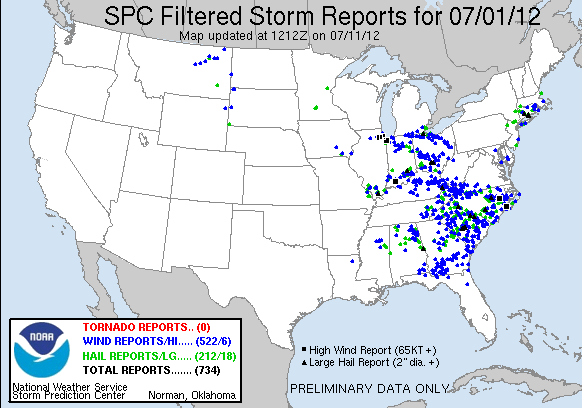
Have you ever been amazed that some especially noteworthy severe weather days can produce record numbers of storm reports? Let’s take this day for example, 1 July 2012:
Wow! A whopping 522 wind reports and 212 hail reports. That must have been an exceptionally-bad severe weather day. (It actually was the day of the big Ohio Valley to East Coast derecho from last July, a very impactful event).
But what makes a storm report? Somebody calls in, or uses some kind of software (e.g., Spotter Network), to report that the winds were X mph or the hail was Y inches in diameter from some location and at some time from within the severe thunderstorm. But the severe weather event is actually impacting an area surrounding the location from which the report was generated, and has been and will occur over the time interval representing the lifetime of the storm. It is highly unlikely that a hail report represented only a single stone falling at that location, or that the wind report represented a single wind gust local to that single location, and there were no other severe wind gusts anywhere else nor at any other time during the storm. Each of these reports represent only a single sample of an event that covers a two-dimensional space over a time period.
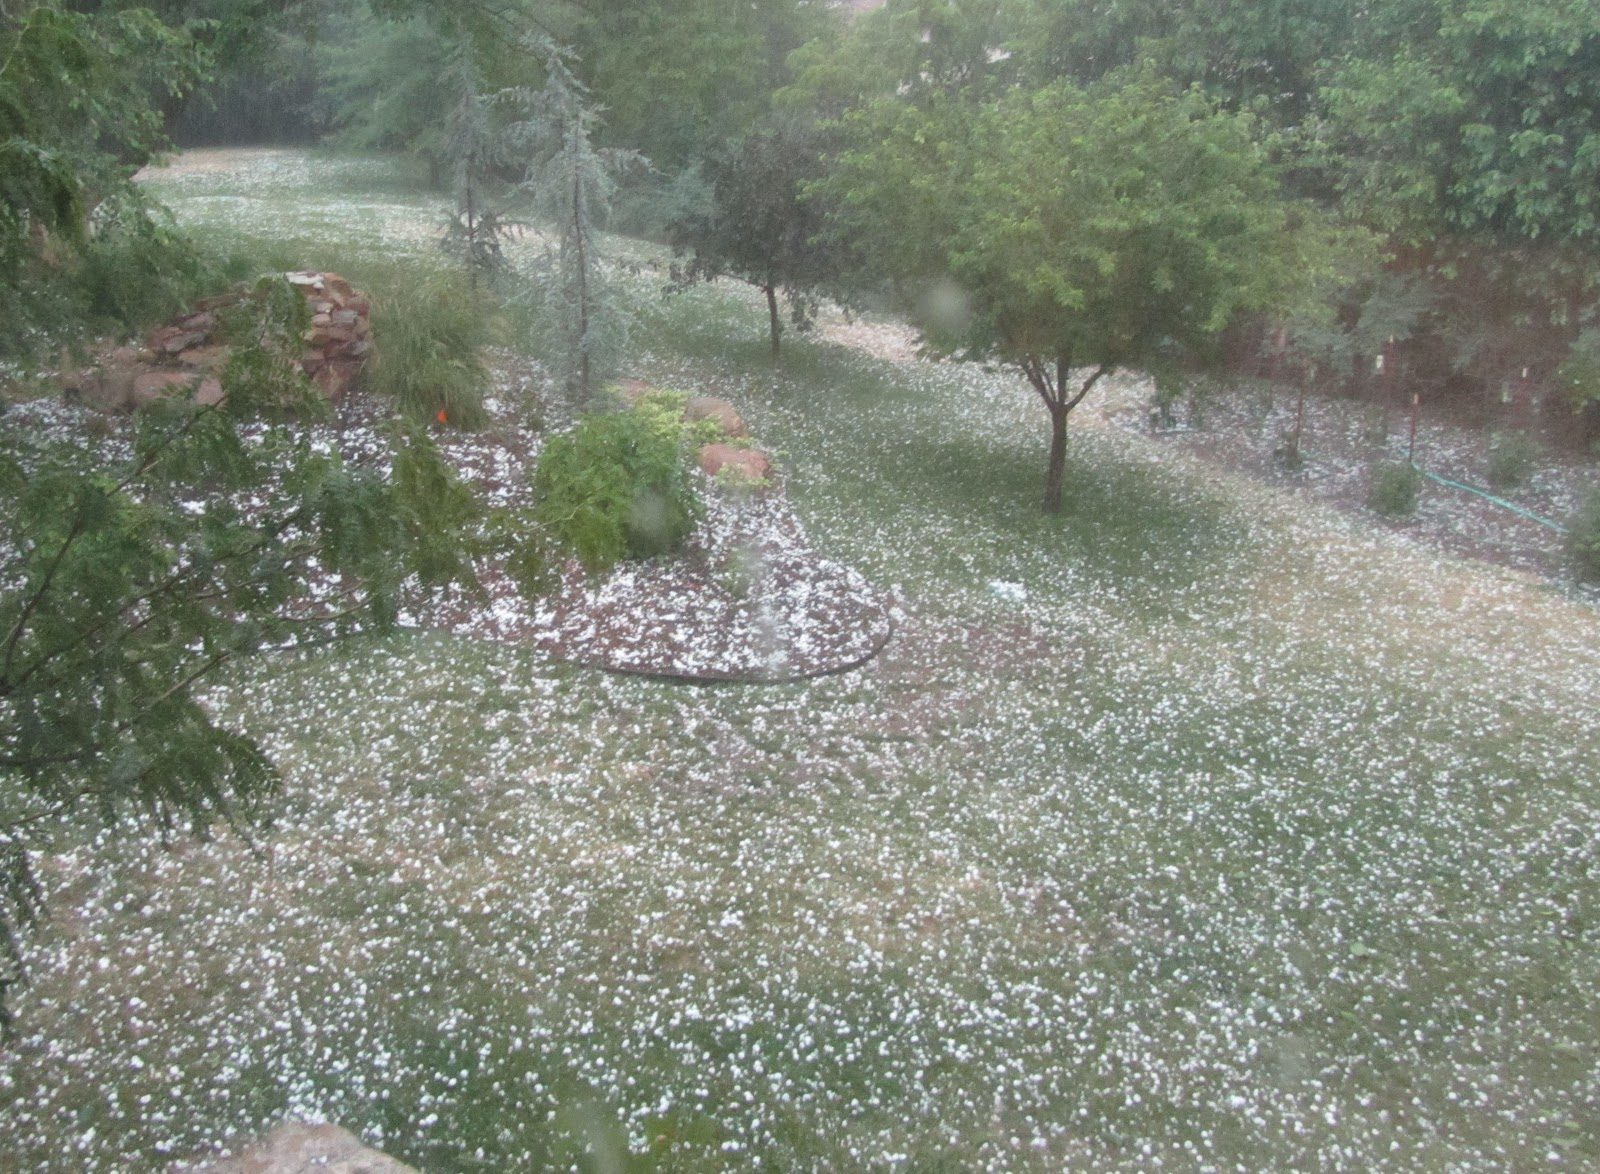
If you recall from this blog entry, the official Probability Of Detection (POD) is computed to be the number of reports that were within warning polygons over the total number of reports (inside and outside polygons). It’s easy to see that to effectively improve a office’s overall POD for a time period (e.g., one year), they only need to increase the number of reports that are covered by the warning polygons issued by that office during that time period. One way to do this is to cast a wide net, and issue larger and longer-duration warning polygons. But another way to artificially improve POD is to simply increase the number of reports within storms via aggressive report gathering. Let’s consider a severe weather event like this one:
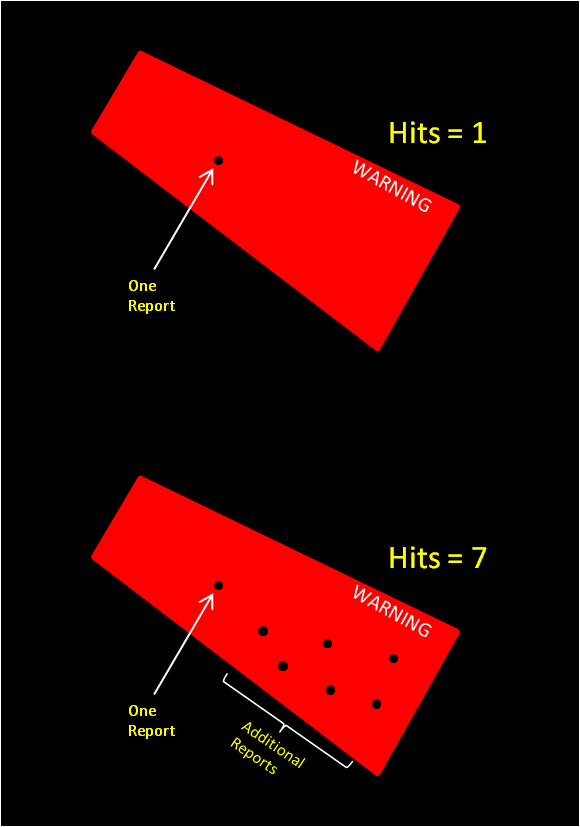
Look at all those (presumably) severe-sized hail stones. We can make a report on each one, at each time they fell. After about an hour of counting and collecting (before they all melted), this observer found 5,462 hail stones that were greater than 1″ in diameter. Beautiful – the Probability Of Detection is going to go way up! We can also count all the damaged trees as well to add hundreds of wind reports. Do you see the problem here? Are you getting tired of my extrapolations to infinity? Yes, there are literally an infinite number of severe weather reports that can be gleaned from this event (technically, there is a finite number of severe-size hail stones fell in this storm, but who’s really counting that gigantic number?). But let’s scale this back. Here’s a scenario in which a particular warning is verified two different ways:
Each warning polygon verifies, so no false alarms. For the scenario on the top, there is one hit added to all reports for the time period (maybe a year’s worth of warning), but for the bottom scenario, there are seven hits added to the statistics.
But wait, doesn’t the NWS Verification Branch filter storm reports that are in close proximity in space and time when computing warning statistics? Wouldn’t those seven hits be reduced to a smaller amount? They use a filter of 10 miles and 15 minutes to avoid my hypothetical over-reporting scenario. But that really doesn’t address the issue entirely. One can still try to fill every 10 mile and 15 minute window with a hail or wind report in order to maximize their POD. But if you think about it, that’s not really a bad idea. In essence, you are filling a grid with a 10 mile and 15 minute resolution with as much information known about the storm as possible. But this works only if you also call into every 10-miles/15-minute grid point inside and outside every storm. Forecasters rarely do this (and realistically can’t), because of workload issues, and because only one report within a warning polygon is all that is needed to avoid that warning from being labelled a false alarm (again, cast the wide net so that one can increase their chance of getting a report within the warning).
CORRECTION (1/10/2013): I just learned that the 10 mile / 15 minute filtering was only done in the era of county-based warning verification, and is not done for storm-based verification. Therefore, my arguments against the current verification methodology where hit rates and POD can be stacked by gathering more storm reports is further bolstered. More information is in the NWS Directive on forecast and warning verification.
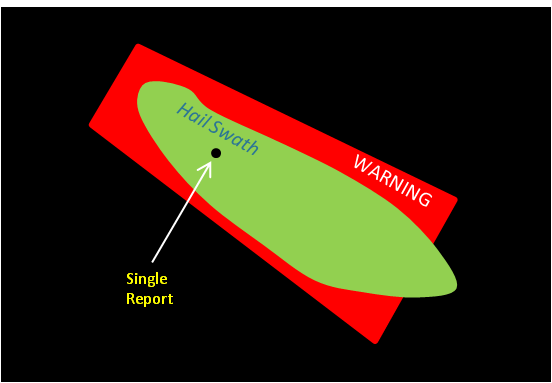
If we knew exactly what was happening within the storm at all times and locations at every grid point (in our case, every 1 km and 1 minute), we’d have a very robust verification grid to use for the geospatial warning verification methodology. But we really don’t know exactly what’s is happening everywhere all the time because it is nearly impossible to collect all those data points. The Severe Hazards Analysis and Verification Experiment (SHAVE) is attempting to improve on the report density in time and space. But their resources are also finite, and they don’t have the staffing to call into every thunderstorm. Their high-resolution data set is very useful, but limited to only the storms they’ve called. What could we do to broaden the report database so that we have a better idea of the full scope of the impact of every storm? One concept is proxy verification, in which some other remotely-sensed method is used to make a reasonable approximation of the coverage of severe weather within a storm, like so:
This set of verification data will have a degree of uncertainty associated with it, but the probability of the event isn’t zero, and is thus, useful. It is also very amenable to the geospatial verification methodology already introduced in this blog series. More on this later…
Greg Stumpf, CIMMS and NWS/MDL


