Takeaways from ICT Today

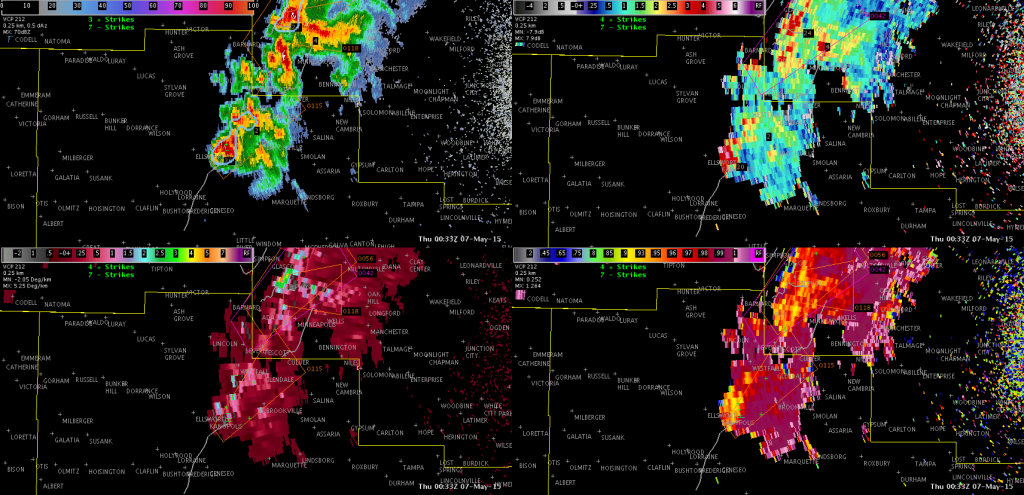
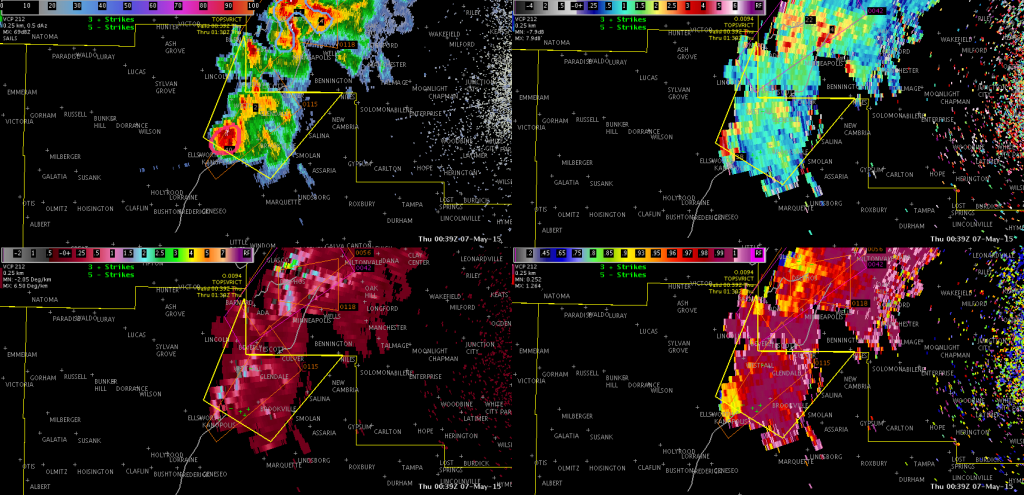
After a busy day at ICT, we have come to the conclusion that radar base data is still our #1 when it comes to warning operations, while the other tools are “confidence boosters”. With many (if not all) of the warnings we issued today, there was little doubt that the storms were likely to produce severe weather. The radar base data told us what we needed to know to go ahead and issue the warnings, with things like lightning jumps and prob severe being more of a reassurance. In a lot of cases, the prob severe did not substantially increase until we we already in the process of writing up or had already issued a warning. Take this storm in Ellsworth County, KS for example.

KICT_ellsworth_pre

When we decided to issue a SVR for this storm, the prob severe was only 13%. Meanwhile, the base data was pointing towards severe hail.

As the warning was being typed up, the next volume scan came in and the prob severe jumped to 85%. Trends in lightning were also more of an afterthought/confidence booster with regards to subsequent storm intensification.

KICT_ellsworth_post

In cases like today, the supplemental tools did not necessarily add any lead time. We do think tools like prob severe and changes in flash rates would be a bigger help with the warning decision making process in marginal severe environments or pulse storms.

Jack Bauer/V. Darkbloom

Tags: None

Lightning Observations at HWT

Total lightning has a large role in the Experimental Warning Program this year.  We are on day 1 of the first week and everyone is familiarizing themselves with the various products.  I have shown an quick comparison of some of the products that we will be evaluating throughout the week.

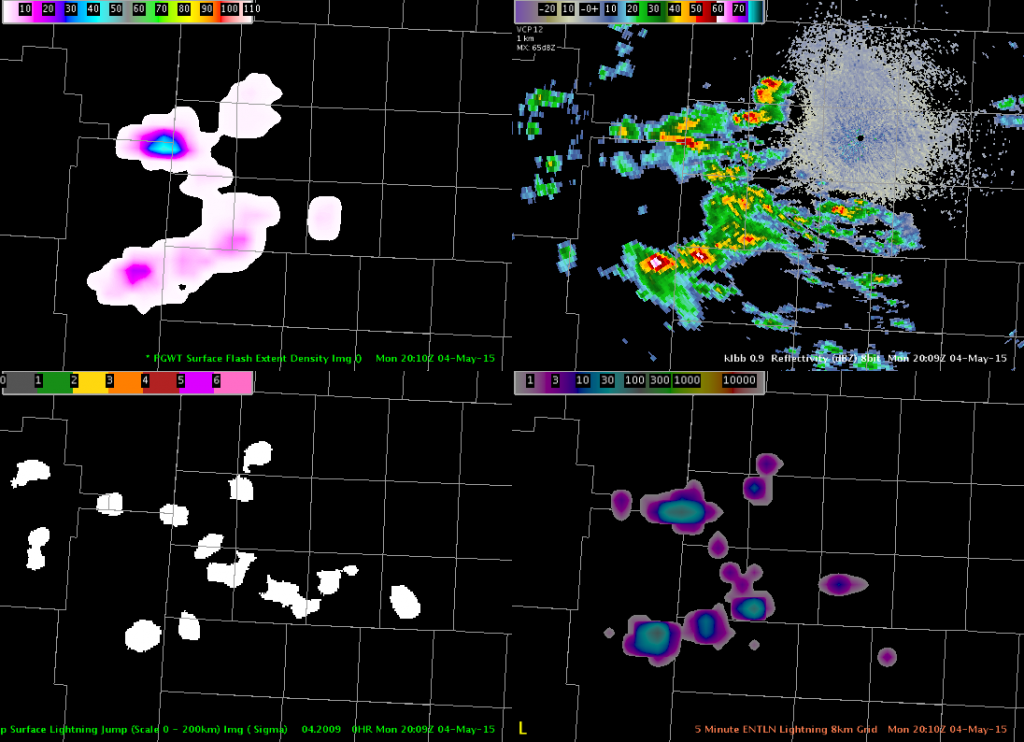
The storms cooperated by moving into the West Texas LMA domain (Lubbock county warning area) allowing for the first views of the NASA SPoRT pseud-geostationary lightning mapper (PGLM) this year.  The image shows the PGLM (upper left), radar reflectivity (upper right), the lightning jump showing the sigma level change using Earth Networks data (lower left), and the Earth Networks total lightning over a 5 min summation and put on an 8 km grid.

The PGLM is showing a maximum value of 41 flashes over a 2 min window with the Earth Networks showing ~40 flashes over a 5 min window.  The lightning jump indicated the storm in the north as having a 1-sigma change, which is not enough to indicate severe weather is imminent.  The PGLM gives another view of spatial extent of the lightning, which is particularly evident in the northernmost section.  The main advantage of Earth Networks is the coverage, unlike the small domains from the lightning mapping arrays that are used to derive the PGLM.

Lightning observations from the 2 min PGLM (upper left), radar reflectivity (upper right), lightning jump algorithm (lower left), and Earth Networks 5 min data on an 8 km grid.
Tags: None