Day 3 observations

LightningCast/MesoAnywhere for DSS Event

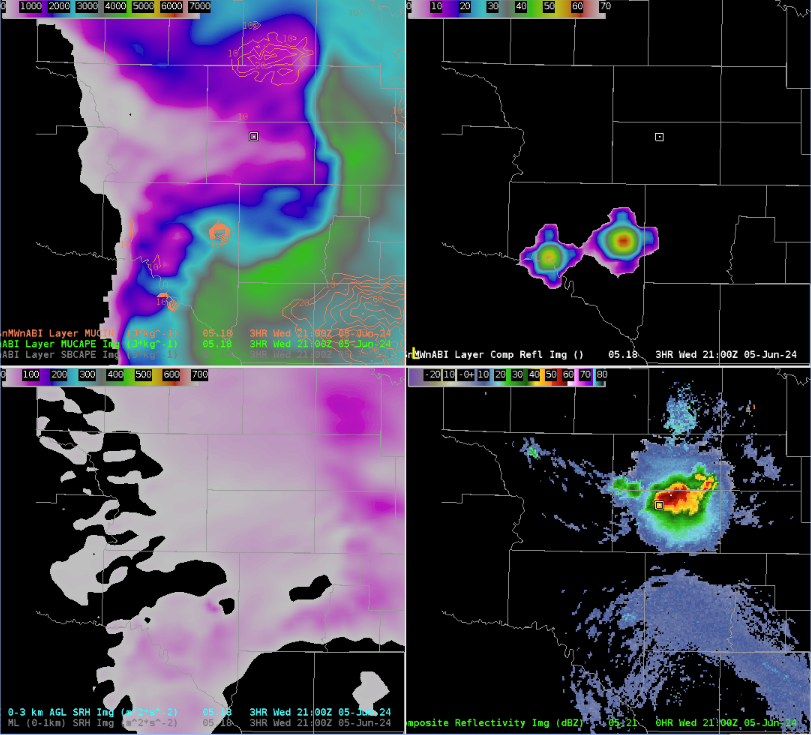
We were operating as NWS JAX on 5/7/25. There was not a huge severe threat, but there were cells that produced a lot of lightning. Our DSS event was the Cabbage, Potato, and Bacon Festival in Hastings, FL (labeled as “home” in AWIPS). As soon as the   day started, there were cells within the range of the festival, with our primary focus on lightning cessation. One of the first things I noticed was that for the cells to the north of the cells, LightningCast v1 had a wider spatial extent of the probabilities than v2 for areas of decaying convection. I assumed this was because of the MRMS data as there were lower MRMS -10C reflectivities in the northern edges of the convection where the lower v2 probabilities were.  I was curious how that would impact the probabilities for the event as the convection began to decay there and how it related to notifying the event of an “all clear”.

Image 1: LightningCast data v1 vs v2 from 19:50Z to 20:11Z.

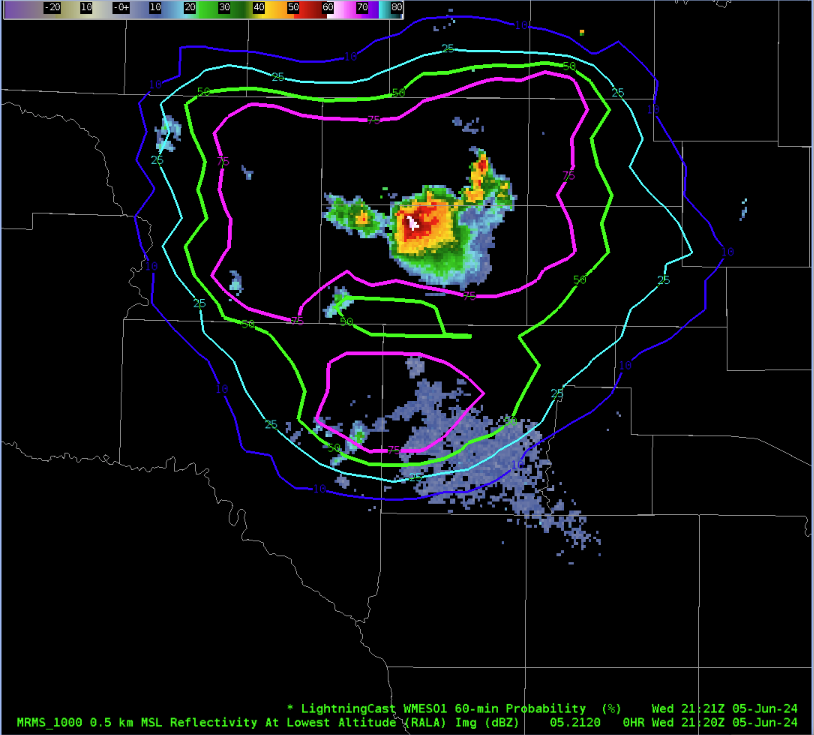
With respect to the event itself, using the lightning dashboard (image 2) was helpful. Probabilities both in v1 and v2 were high for the beginning of the day in the middle of all the convection. Probabilities started to decline around 20:15Z. Initially, v1 was declining faster, but by 20:30Z, v2 was declining at a faster rate than v1. There was still lightning within the 10 mile radius during these declines, but v2 it seems that v2 caught on to the decay a bit faster. This is also shown in the LightningCast loop from AWIPS (image 3) where v1 had a larger spatial extent to the higher probabilities for longer. I used LightningCast probabilities in my DSS messaging. When the probabilities were going down, I used a number in between each version for the probability I used in the message. I also utilized MesoAnywhere 1 minute Channel 13 data once it became available for us to monitor the potential for new convection behind the main cluster of cells. There was not much being shown, which made me more comfortable noting the event of an all clear.  Probabilities eventually did start to go back up after 21:15Z because there was a lot of convection to the north and south of the event.

Image 2: LightningCast Dashboard for the Cabbage, Potato, and Bacon Festival in Hastings, FL.

Image 3: Lightning Cast comparison loop from 20:43Z to 21:32Z.
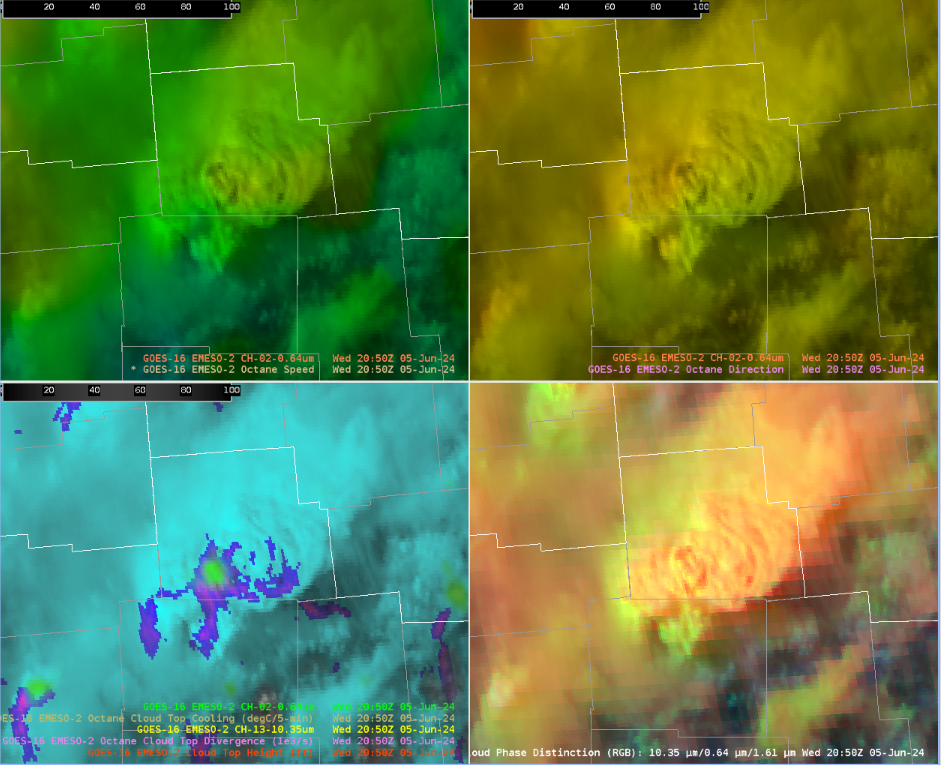
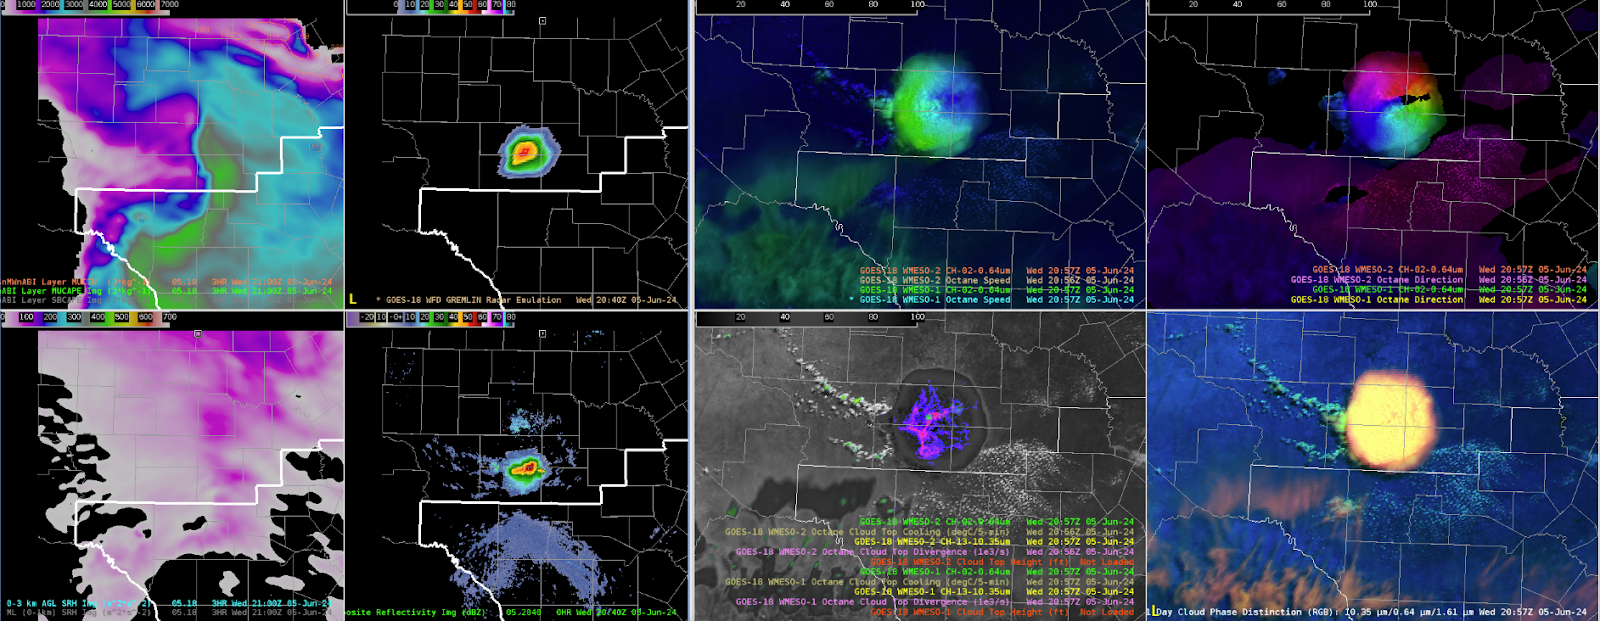
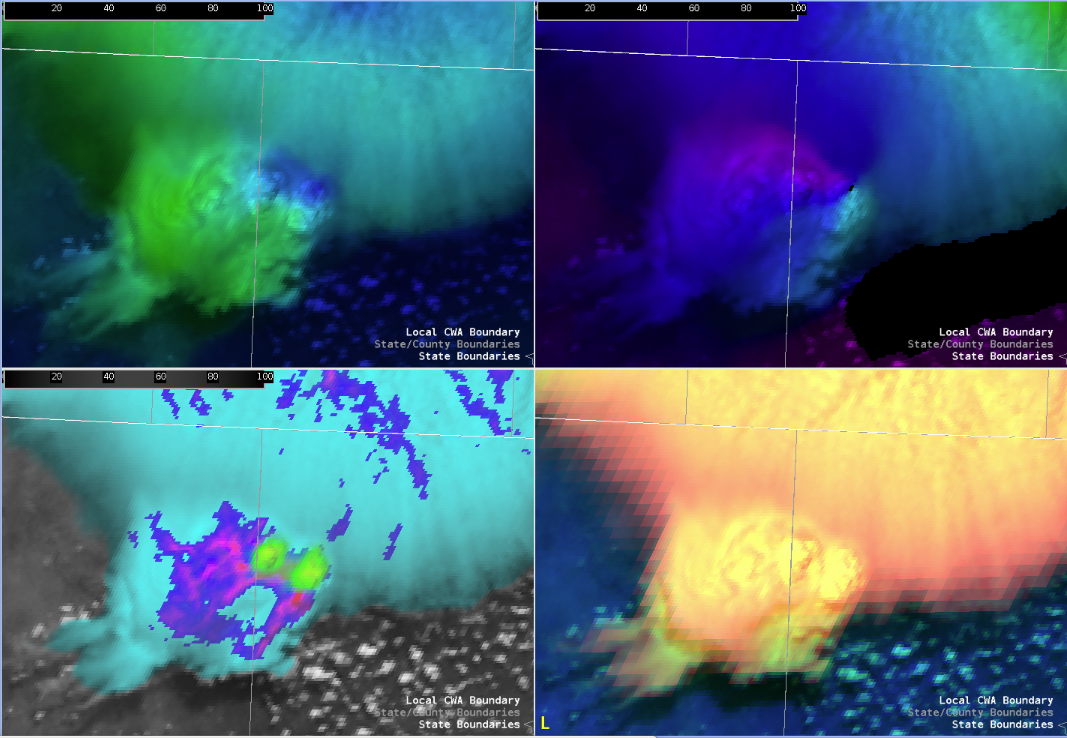
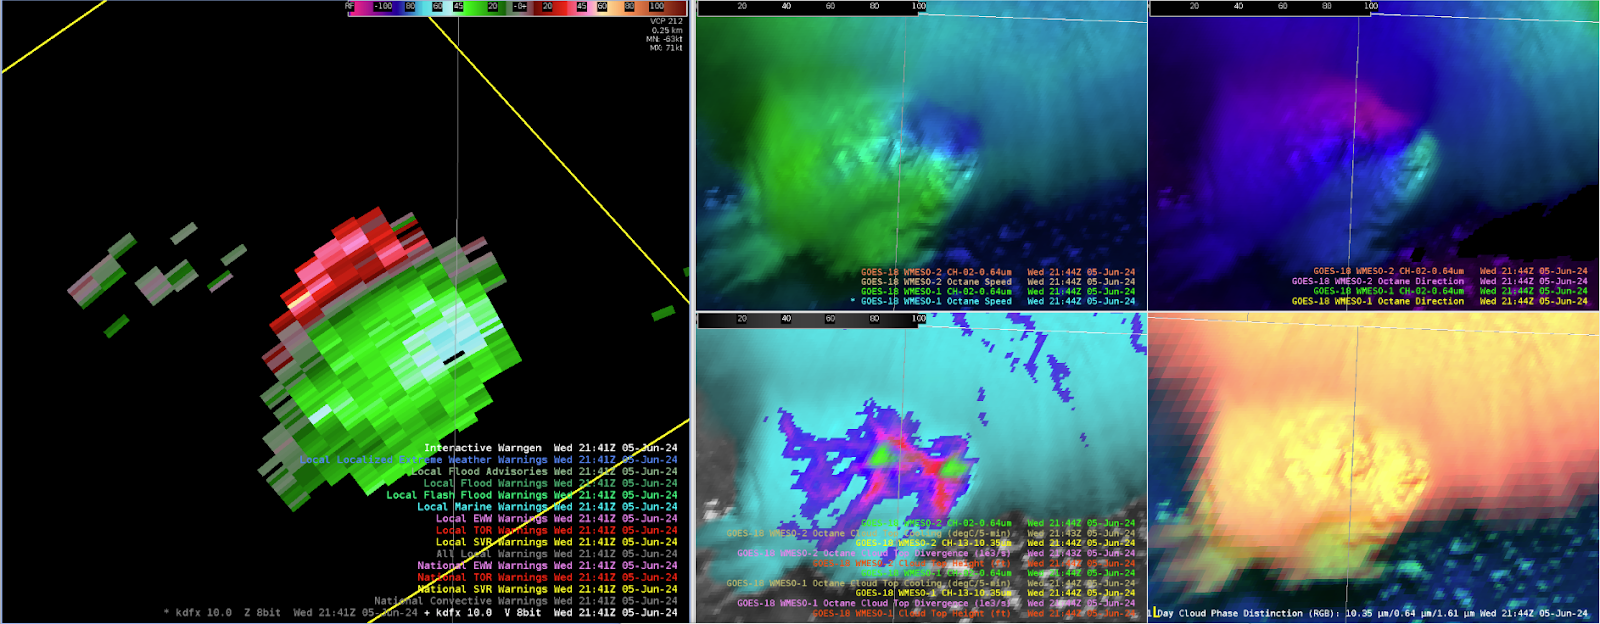
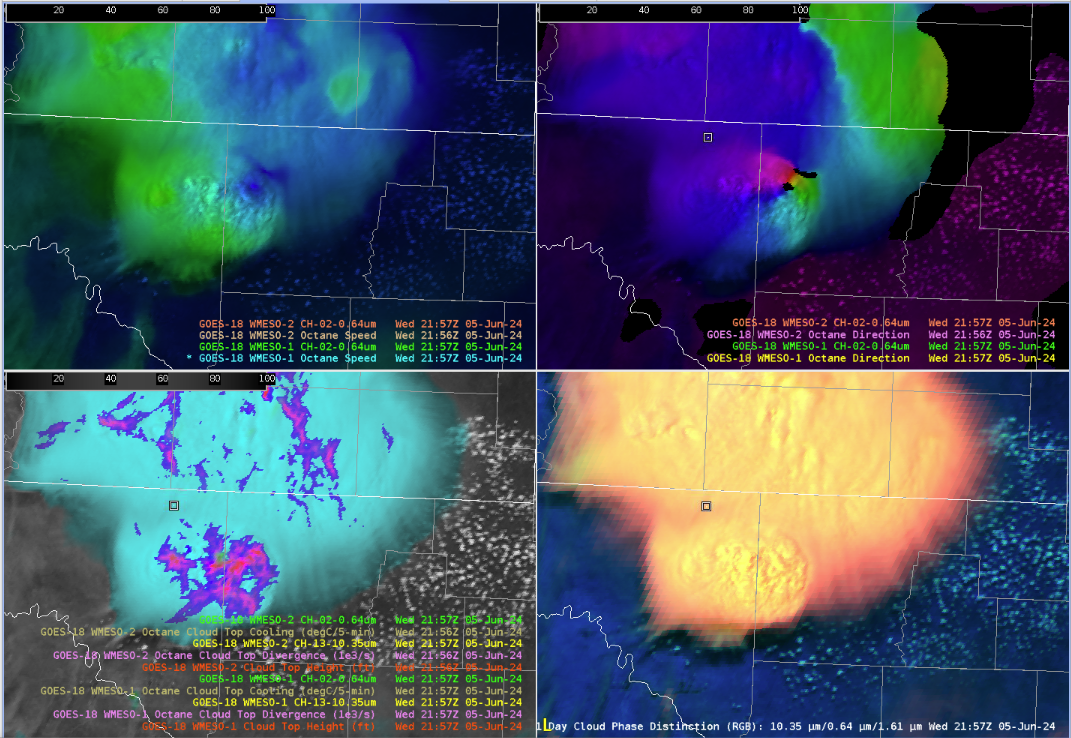
Octane and Gremlin

Today was the first day that I used Octane. After getting some training on it from Jason, my first impression of it is that it would be a valuable resource for situational awareness for developing convection and alerting you to where stronger thunderstorms are. This could alert a forecaster to a cell that they may need to interrogate a little more. During warning operations, if radar data is available, I do not think that a warning operator would have enough time to use this in their data analysis, but the warning coordinator or mesoanalysis person would probably find this tool helpful. We went through a thought exercise about how we would use this tool when radar data is unavailable. During times like that, the radar operator would probably find this tool helpful because the storm top divergence and the speed sandwich offers information that radar operators look in radar when assessing thunderstorm strength. With respect to the individual options, I found myself using the speed sandwich more initially because I was able to infer the storm top divergence in a unit that I am used to. However, the more I get comfortable with the actual CTD units and colors, having it paired with the storm top cooling would provide me more information overall than the speed sandwich during warning operations. If I only had satellite data, I would probably be pretty liberal with my warning issuance. There was a cell near Juniper Springs around 22Z, where the speed sandwich and CTD tools were showing relatively “stronger” signals (stronger is relative since there were not many strong signals today). Looking at radar data (MRMS MESH, VII, dual-pol data) and knowing the environment, I did not think the cell was producing severe weather. I am not very comfortable just yet with the thresholds in these Octane products, but given the environment was supportive of marginal severe weather, I may have issued a warning in this instance. Both the SpeedSandwich and the CTD displays were indicating the storm was weakening though, so I also might not have either. As others have noted the last couple of days, the MedSmooth CTD was the one I preferred.
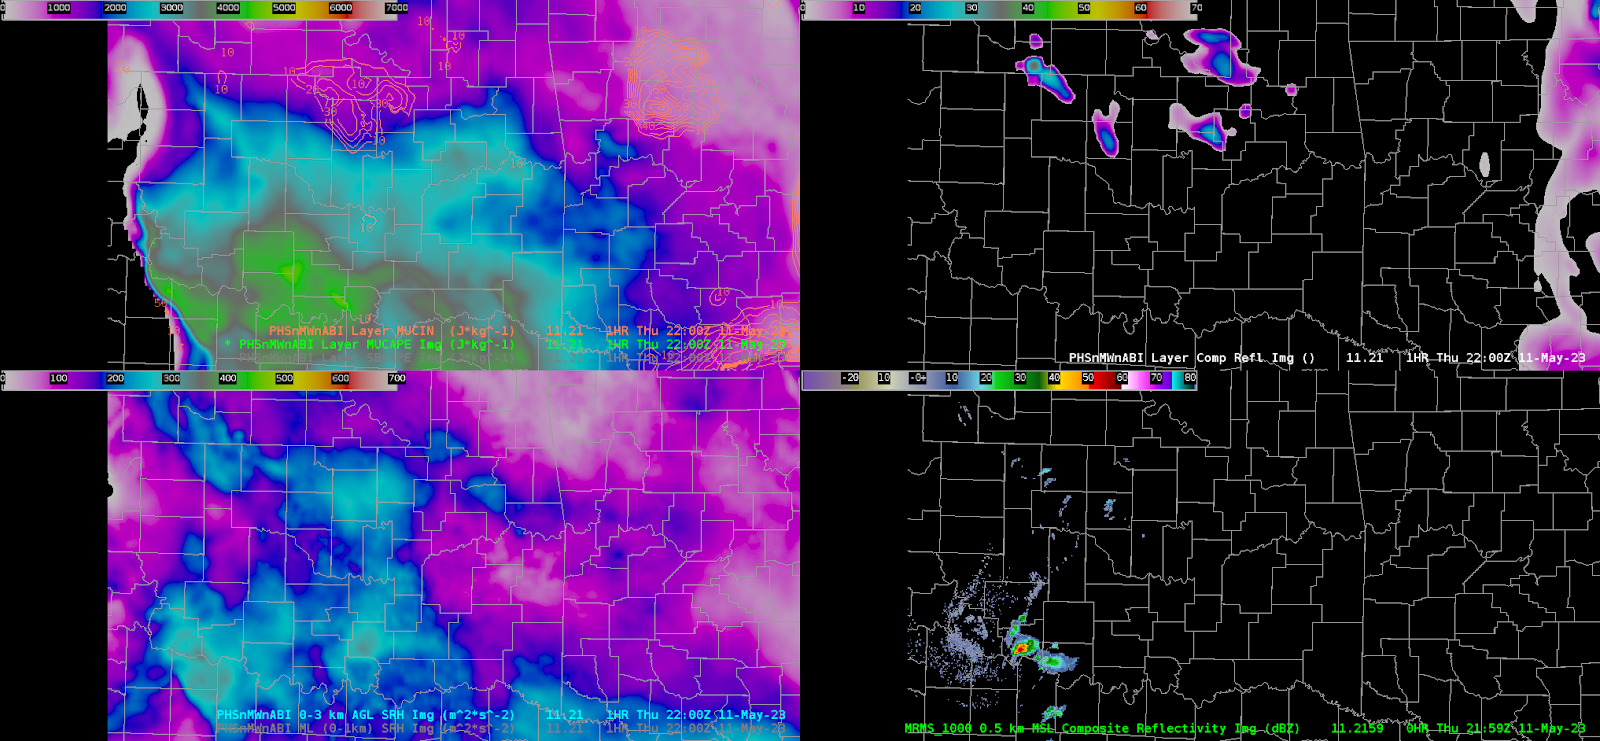
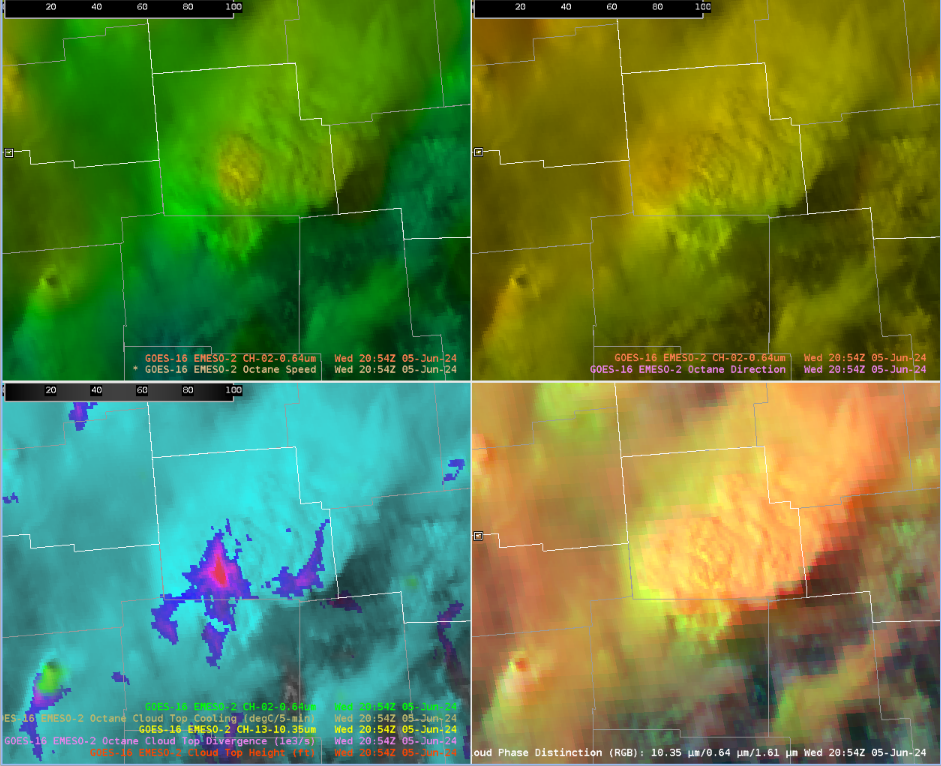
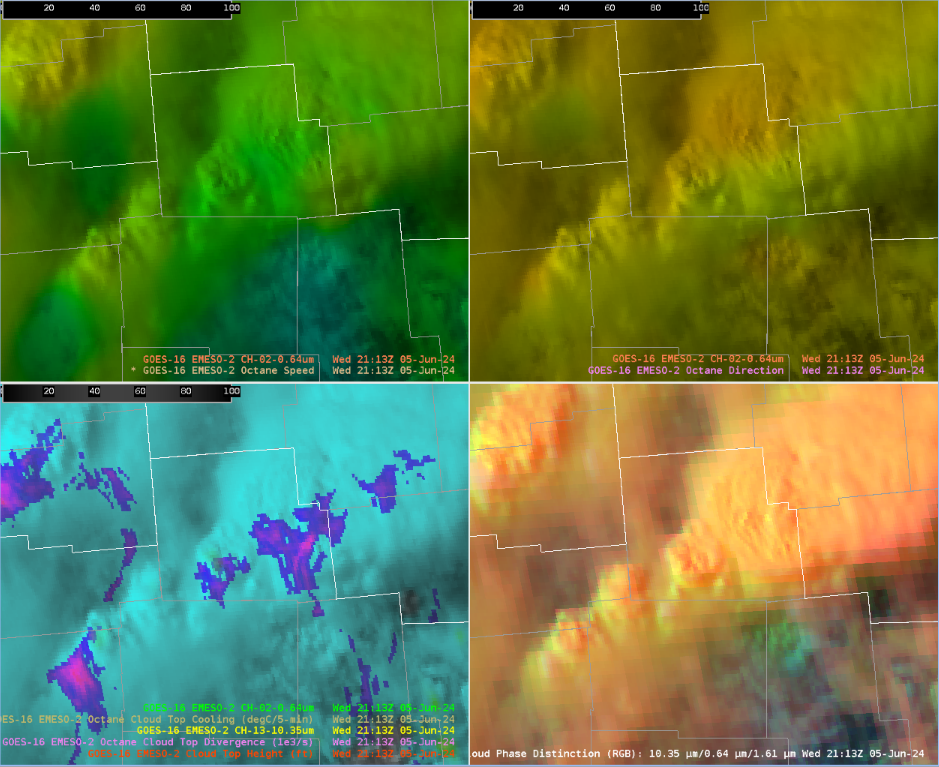
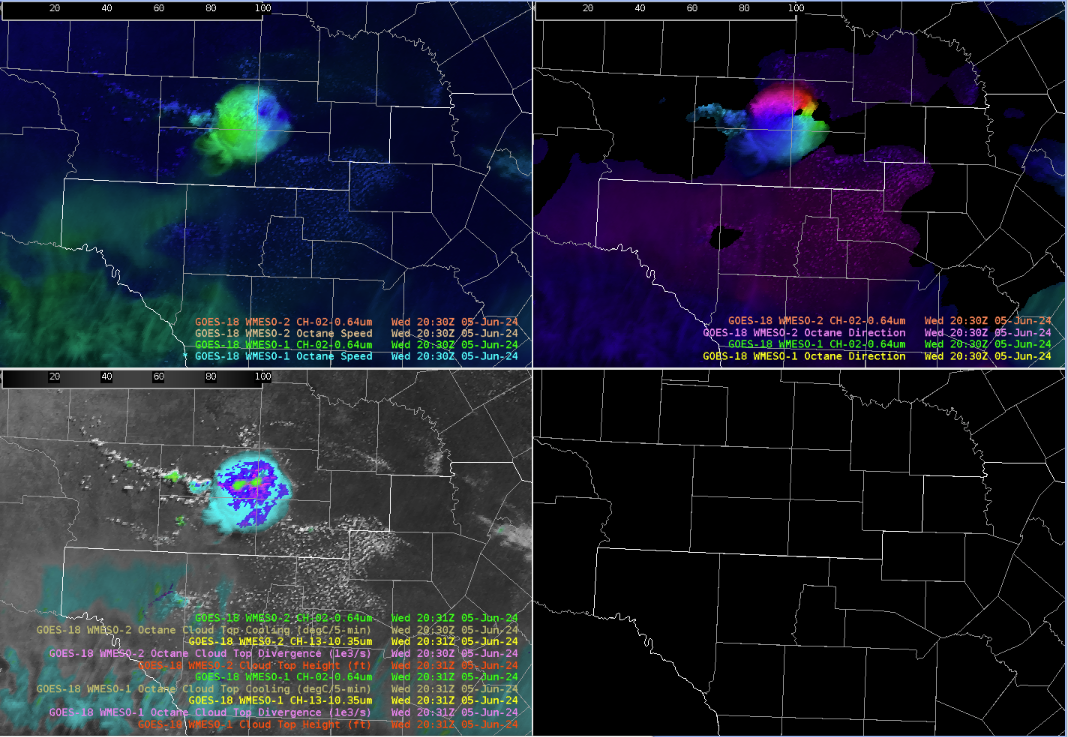
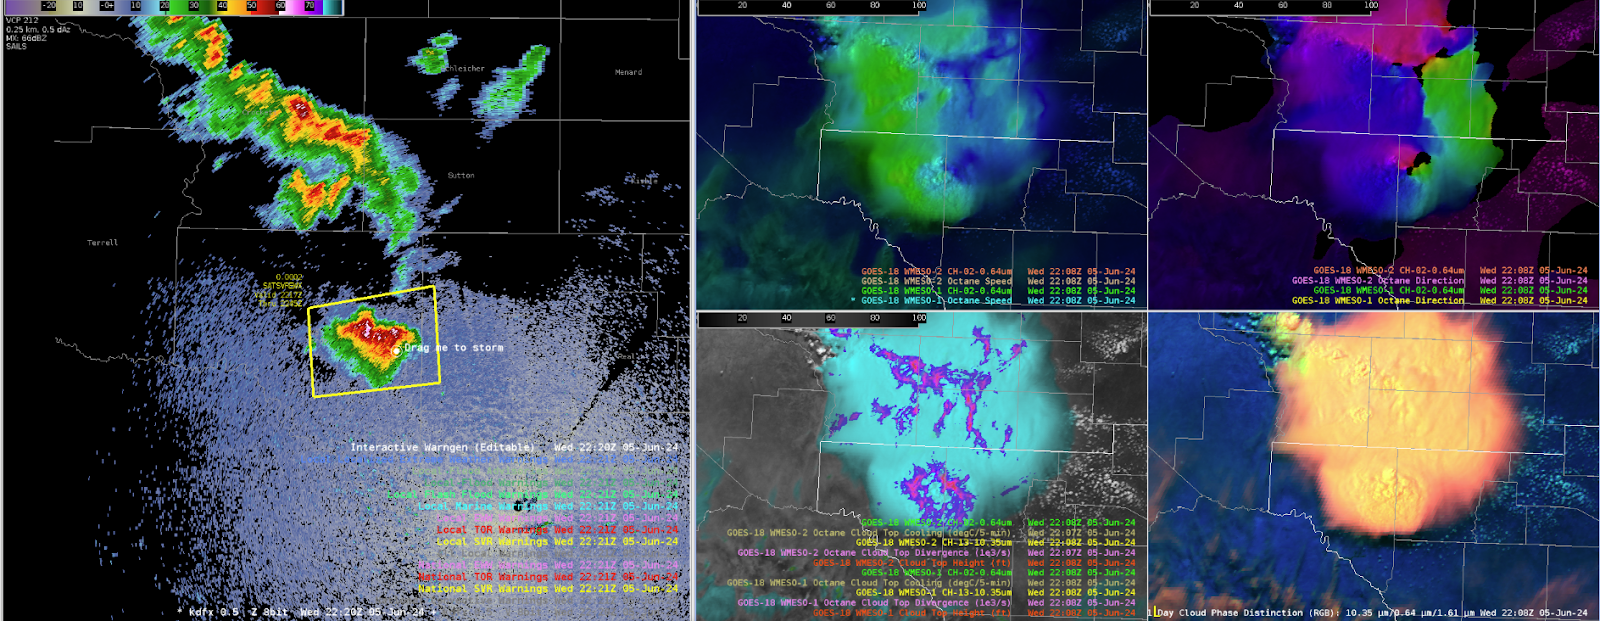
Image 4: Octane Speed Sandwich and Cloud Top Divergence and Cooling from 21:54-22:21Z=
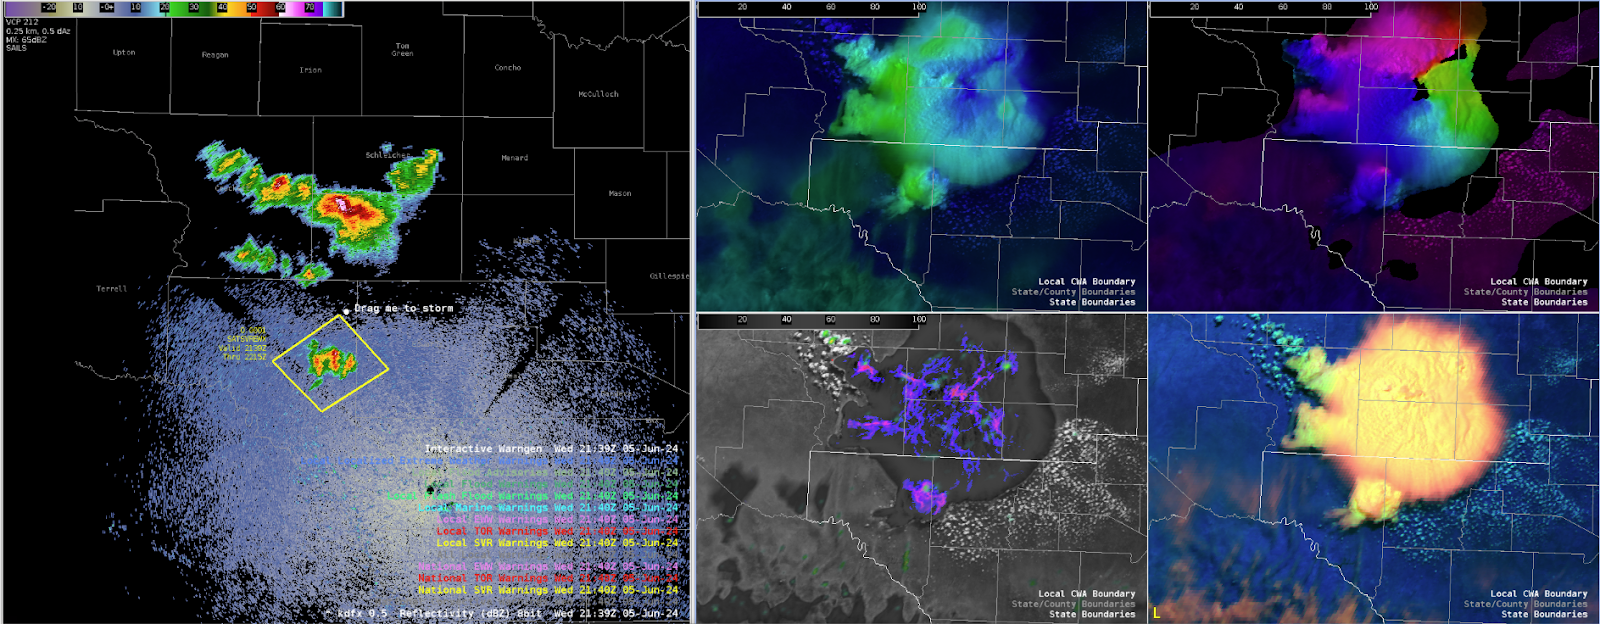
Looking at GREMLIN for the same storm, it seemed to have picked up on the stronger signals of the specific cell and would be useful for pinpointing the storm with the highest “potential” in this instance since it was the one with the higher reflectivity values. I don’t know if I would make a warning decision specifically off of this product, but if I had it available in addition to other satellite data, I may be more inclined to issue a warning or an SPS if the environment is supportive of it.
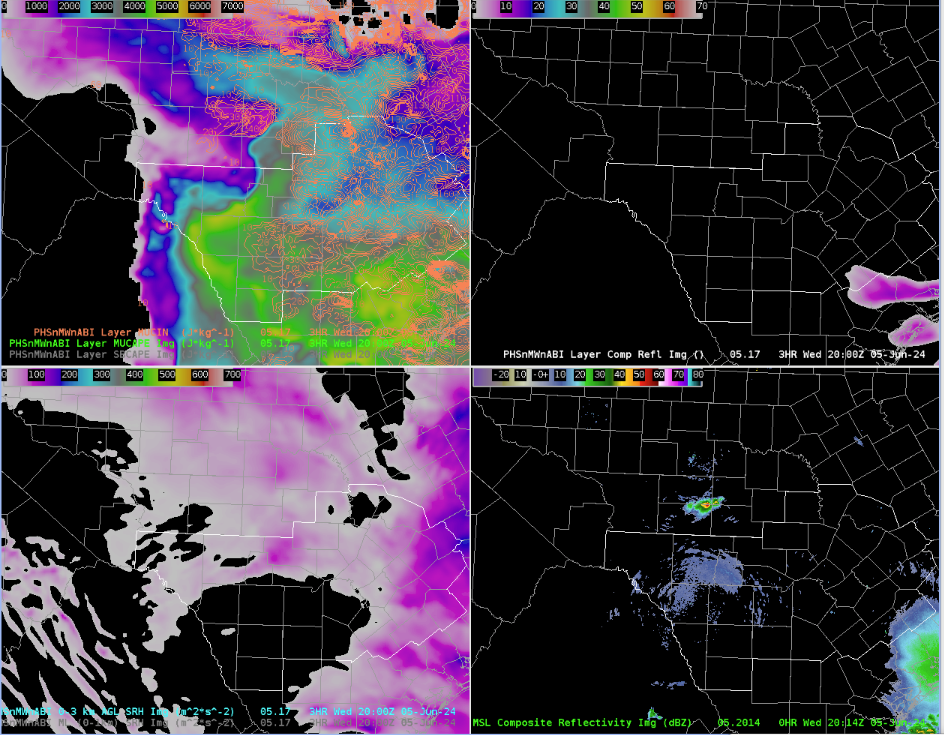
Image 4: GREMLIN 20:31Z to 22:21Z
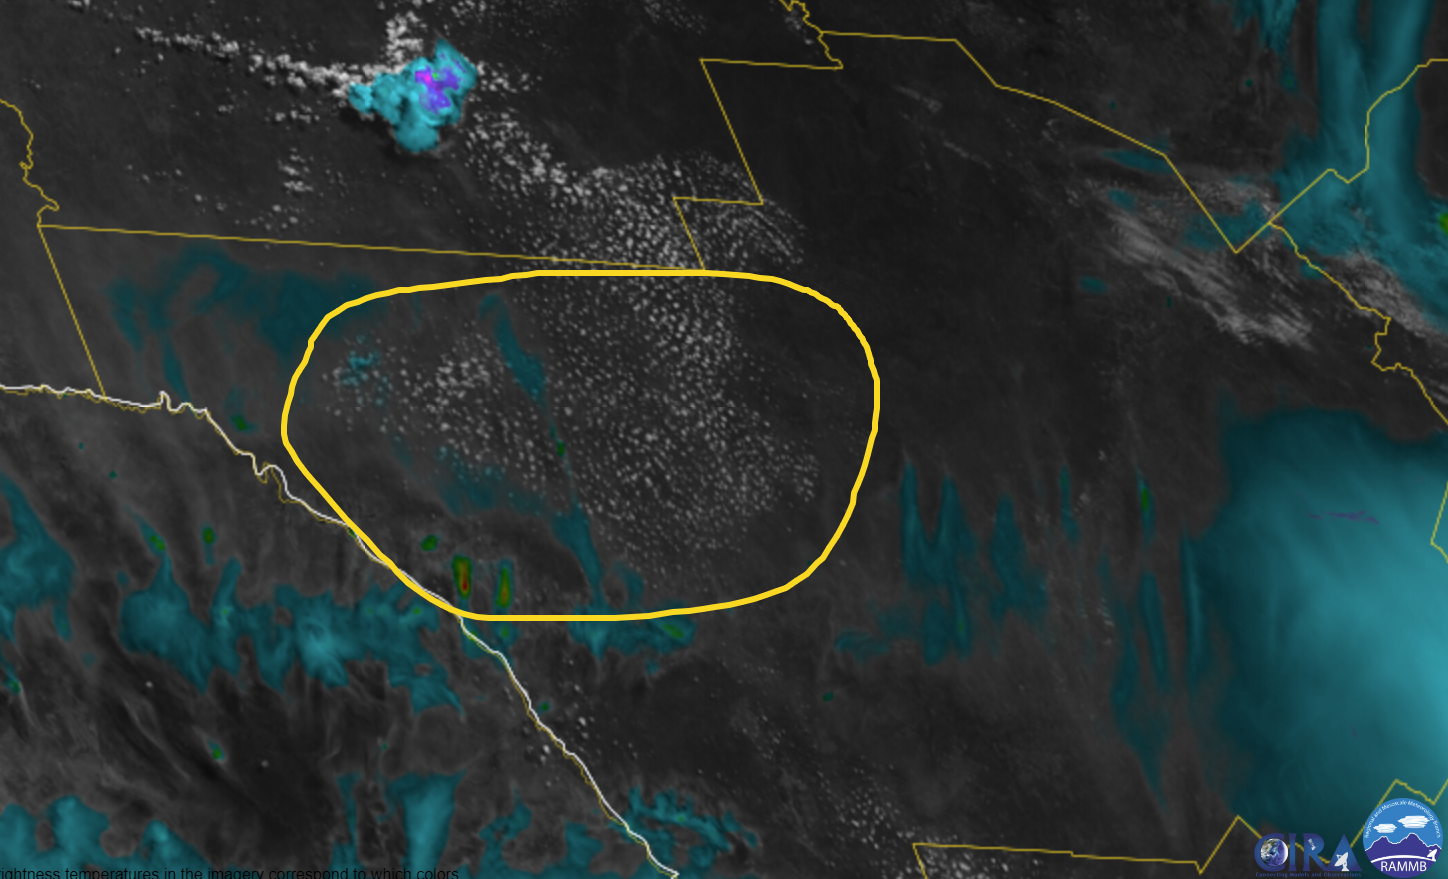
Unrelated to the previous storm, this was another snapshot I took of GREMLIN. There was an outflow boundary (not visible in this image) that was traveling southward and sparking new convection as it interacted with the sea breeze. A small cell that was relatively strong quickly developed to the southeast of the Jacksonville Airport. While reflectivities were picking up on MRMS, satellite didn’t pick up on it as quickly. GREMLIN did not catch this initiation.
Image 5: GREMLIN at 20:01Z.
There was a cell that developed along a outflow boundary very close to the radar. Satellite data was not really picking up on it with little cooling cloud tops so GERMLIN completely missed it.
-goldenretreiverlover
Tags: None

Basic OCTANE Cloud Top Divergence Comparison

This is a basic comparison between three options for the OCTANE. The top animation is No Smooth, the middle is Medium Smooth, and the bottom is High Smooth.  For starters, I do like the looks with the smoothing, it is easier on the eyes and rids of any excess noise.  I feel this helps to recognize trends easier and remain focused on those trends through the animation.  In this loop, following the regenerating updrafts west of College Station and Snook, TX, was somewhat easier to follow on either the medium or high smooth.  Smoothing out the excess noise around the updraft helped remain focused on the primary portion of the storm.  The warning issued was based on radar data, but could imagine the Cloud Top Divergence being a helpful tool in warning decisions if radar data wasn’t available. It certainly is a “confidence booster” or a nudger if you’re on the fence for a warning or not. It would be interesting to correlate the CTP (to hail size, wind, and/or if a tornado was produced. Obviously this would take some extensive research.

-Podium

Tags: None

Lake Charles May 6th event

GREMLIN was helpful early in the event to quickly identify most intense thunderstorms developing across SE Texas, but as more convection developed it became less useful. A severe thunderstorm warning was issued for the cell highlighted in blue on the top right panel of Figure 2 which shows MRMS. GREMLIN data hardly shows much lower reflectivities for the severe cell as more frequent lightning producers to the northwest are likely causing it to struggle.

88D radar data showed a tall and strong Z core. Strong STD and lower ZDR/CC values were also noted aloft though were not shown here.

This was right at the end of the day so didn’t have time to issue more warnings, but storm to the NW is likely severe by this point just given supercell characteristics.

OCTANE STD showed the severe cell with cooling cloud tops and then showing a STD signal as the storm quickly grew taller than an anvil from an upstream thunderstorm. The STD signal was rather weak though and was even weaker than some sub-severe storms which developed across East Texas. This could have been due to disrupted flow from upstream convection. The product did still help me quickly realize there was new convection developing over SW LA and led to me eventually issuing a warning after doing further analysis on 88D radar data.

Didn’t see too many significant differences between LC V1 and V2 overall. I did find this image interesting as convection developed across SW Louisiana LC V1 had higher probs over a larger area before V2. Further north across central Louisiana, there was additional convection developing under thicker cirrus where V2 did a better job showing higher probabilities of lightning. LC V1 only had low or moderate probs at most while there were a few lightning strikes already occurring. I forgot to save an image from that example.

– Ricky Bobby

Tags: None

Houston CWA May 6th event

 Started out issuing a warning for parts of northwest Houston’s area based on info from the Flash density product.

3:06 PM. Using Octane, noticing a cluster of convection that is developing and becoming more interesting for warning purposes.

3:38 PM Severe Tstorm with tornado warning out. Special feature noted on Octane Speed Product where the updraft was reisting ambient wind flow as the storm intensified noted by cyan colors on LA/TX state line near Shreveport.

-Jolly Rogers

Tags: None

OCTANE Cloud Top Divergence Comparison

This is a comparison between three options for the OCTANE Cloud Top Divergence. The top animation is No Smooth, the middle is Medium Smooth, and the bottom is High Smooth.  For starters, I do like the looks of the smoothing option, it is easier on the eyes and rids of any excess noise.  I feel this helps to recognize trends easier and remain focused on those trends through the animation resulting in being particularly helpful in real-time operations since the warning meteorologist eyes are constantly moving from screen-to-screen.

In this loop, following the regenerating updrafts west of College Station and Snook, TX, was somewhat easier to follow on either the medium or high smooth.  Smoothing out the excess noise around the updraft helped remain focused on the primary portion of the storm.  The warning issued was based on radar data, but I could imagine the Cloud Top Divergence being a helpful tool in warning decisions if radar data wasn’t available. It certainly is a “confidence booster” or a nudger if you’re on the fence for a warning or not. It would be interesting to correlate the CTD (to hail size and possibly wind and/or if a tornado were produced) if given certain thresholds such as the multitude of hail research that has been conducted from radar in recent years.

Below are the three CTD options at 20:29z on May 6, 2025.   There were a pair of updrafts near College Station and were clearly evident on the cloud top divergence.  However, some subtle differences showed up between the smooth and the no smooth options.  In the yellow box, the High Smooth seemed to smooth too much compared to the No Smooth and Medium. Similarly in the black box and next to the black arrow, it seemed to be overly smooth and completely get rid of some features that might evolve into something notable later.

There are very subtle differences, especially between the two smoothed loops, and if given the choice, I’d lean slightly towards the Medium Smooth based on the High Smooth potentially smoothing out some important features and the No Smooth being too harsh on my old eyes.

– Podium

Tags: None

Comparison of GREMLIN, OCTANE, and Radar Products For Two Storms near KMAF

Something interesting was noted when looking at two nearby storms on 05/06 between 2146Z through about 2205Z. When looking at two thunderstorms which quickly fired up near the MAF radar, OCTANE STD data suggested the storm to the left had stronger divergence aloft. The OCTANE Speed Sandwich also showed these storms were relatively similar in strength with the right storm having slightly stronger shear, but decided to look at GREMLIN and dual-pol radar data for further analysis. It is worth noting that OCTANE data stopped coming in around 2146Z due to a power outage at CIRA. GREMLIN data clearly showed the left storm was weaker depicting much lower reflectivity. This overall aligned with MRMS data, but the GREMLIN data did smooth out higher Z values as expected. 88D radar data was then used to help investigate the two storms after seeing both OCTANE STD and GREMLIN data differ on which storm was more intense. When looking at radar data it became clear that the storm on the right was more intense with a BWER, higher cloud tops, more intense reflectivity core aloft, and stronger STD (wasn’t able to sample true STD because the storm was too close to the radar).

It was very odd to see the left storm had stronger divergence aloft in the OCTANE STD procedure yet all other data suggested the storm on the right was much more organized. There are no loops in this blog, but the weaker left storm was a left mover while the stronger thunderstorm was more of a right mover. Could this have played a role in the OCTANE STD data suggesting the left storm was more organized?

A severe thunderstorm warning was issued on the right storm before these comparisons were made as it was evident a supercell was developing. OCTANE/GREMLIN aided in quickly seeing where CI was occurring and which storms were intensifying quickly. However, using the satellite products alone to issue warnings would have been difficult. This could be due to not being familiar with what thresholds forecasters need to be looking for in OCTANE or GREMLIN in order to issue a warning. If I were in a forecast office with radar holes or beam blockage, these new satellite products would still be very helpful to interrogate storms. OCTANE/GREMLIN provided better confidence on what storms to focus on and paired well with 88D radar data for warning operations. It would be fascinating to see how this works in a location where there is beam blockage or radar holes.  

When looking at this 4 panel OCTANE STD suggests the cell on the left has stronger divergence aloft. The speed sandwich (top left) suggests the storms are relatively similar in intensity though slightly stronger shear was evident for the right storm.

The two storms on the right are the ones of interest. Ignore the far left storm. GREMLIN data clearly shows that of the storms in question, the one on the right is more intense as reflectivity values are much higher. OCTANE data went out at 2146Z so timing between products is off slightly. GREMLIN data compare to MRMS data as both showed the storm on left being less organized. MRMS was a lot easier to read though due to less smoothing.

88D Radar data clearly shows the storm on the right is more organized with a BWER, higher cloud tops, much stronger reflectivity core aloft, and stronger STD (true STD could not be sampled as the storm was very close to the radar).

– Ricky Bobby

Tags: None

Storm-Scale Environmental Analysis of Early Convective Development

This case at WFO OUN brought forth a challenging situation monitoring developing severe weather with no available radar data, and only relying on satellite products for storm interrogation and convective warning decisions. This analysis will primarily focus on the evolution of early convective development and how satellite products/PSH data helped gain a better understanding of the environment.

My role in the team monitoring/analyzing the environment was focused on issuing warnings and having the Mesoanalyst(s) relay satellite, PSH and GREMLIN information to support warning decisions. To prepare and gather a greater situational awareness of the environment and what satellite was observing, I loaded in RAP13 Right/Left Bunkers vectors which would aid me in effective polygon design. Given the orientation of the hodograph per observed soundings earlier, storms would support the potential for left/right splitters meaning proper storm motion/polygon flare is very important.

Convective initiation began around 21-22Z with noticeable towering Cu across Cotton County, OK, prompting the first issuance of a SVR at 21:56Z given cooling cloud tops/increasing storm top divergence.

Towards the end of the loop above, observation was made that the overshooting tops were turning more ENE biasing closer to the bunkers right, implying the likelihood of the storm developing a mesocyclone. Not shown here, but a useful trick of enhancing the contrast of the Day Cloud Phase RGB became extremely useful in tracking overshooting top motion and intensity, along with other satellite products diagnosing an intense updraft in progress.

The pre-storm environment was analyzed using PHS data, highlight ample MUCAPE on the order of 3500-4500J/kg around the area of CI,  and large-scale 0-3km SRH ranging around 250-350m2/s2, bringing support for stronger/severe storms to attain rotation in a volatile, highly unstable/moderately sheared environment.

WIth the storm obtaining a developing/intensifying left splitting  updraft (later in the first loop), confidence of a strengthening mid-level mesocyclone increased leading to a transition to a base TOR warning, with polygon design mainly following the bunkers right motion vector to imply near-term motion to continue ENE.

Modifying the OCTANE speed product by decreasing the max observed values downward and min values upwards helped diagnose a more eye turning signature to storm top divergence. Additionally, modifying the direction scale, albeit took some work, came out with a product that illustrates (in red) backed sfc winds <`180 degrees which existed well ahead of it, inferring the likelihood of larger curved hodographs and greater attendant estimated low-level SRH.

However, one item that was not noticed until after the TOR warning was the winds being ingested into the storm (shown in green) averaged around 210-230. This appeared very accurate looking at feeder cumulus ingesting into the inflow region of the cell just to the SSW. Less backing of the surface winds yields much less available streamwise vorticity (in fact is mainly crosswise) leading to the likely reason the storms rotation did not strengthen, and ultimately collapsed 30 minutes after the image above and the left-turning supercell became the dominant storm.

Overall, OCTANE exhibited great, practical uses to understanding not just the storm intensity/trends but the environment explaining why the storm was behaving the way it did.

– RED11248

Tags: None

OCTANE in a Pulse Environment

The environment across the ILN CWA this afternoon was one which favored pulse convection as deep layer shear was fairly weak. At around 4:45, we began watching a storm in the northern portion of the CWA that seemed to be strengthening quickly. Unfortunately, the OCTANE data was coming in around 30 minutes late at this point, so we had to rely on traditional methods to assess storm strength. We decided to put out a Severe Thunderstorm Warning on the storm as radar indicated that it was capable of producing 1” hail. Luckily, the OCTANE data caught up not long after and I was able to analyze it as well.

This first image is from around the time that the warning was issued. Looking at the speed and direction products, we see that the gradients are rather diffuse. This is indicative of the weak deep layer shear. However, looking at the cloud top cooling, we see cooling of around 3°C which implies that the updraft was strengthening at the time the warning was issued.

This next image is from 4 minutes later. The speed and direction products still show a diffuse gradient, but the cloud top divergence product really stands out. This lines up with when the storm appeared strongest on radar.

This final image is from around the time that the warning expired. The cloud top divergence is considerably weaker than it had been and radar also indicated that the storm was weaker. We were comfortable with letting the warning expire.

This storm made me think about the utility of OCTANE products in a pulse severe environment. It seems that the cloud top cooling and cloud top divergence products would be significantly more useful than the speed and direction products as you can use them to quickly infer changes in the severity of the storm based on updraft strength.

-EI2018

Tags: None

San Antonio Waiting Game

San Antonio: broad cu field is still fighting substantial dry aloft despite extreme instability in the Great Bend region. No notable cooling or anything of note in the OCTANE data. Residual outflow boundary from earlier MCS is acting as a mechanism for a lone strong-severe thunderstorm just north of our CWA. Strong OCTANE divergence and cooling seen along the nose of PHS instability gradient with 3500+ CAPE; shear is essentially zero across this region. PHS composite reflectivity clearly did not forecast this outflow and thus the convection.

2100z: Strong-severe lone thunderstorm with very clear and strong divergence signal in both divergence field and speed fields. Rainbow signal seen in the direction field due to the very limited shear.

Orphaning anvils in the cooling OCTANE fields to the west of the primary convection suggest the PSH fields for instability are just displaced to the east at 2100z.

Nice depiction of the PHS being wrong but right at the same time. Clearly slightly displaced with instability gradient to the east, but accurately showed the single cell or two behavior that we have seen.

Impressive single cell continues as of 2130z, and some notable cloud top cooling and divergence is now seen in the cell to the southeast. Instability axis is clearly ~50 miles to the north of the PHS.


Lightningcast is bullish on both the southeast and south newly developing convection. Very broad contours however, possibly too much false alarm area here (?).

Broad persistent divergence in OCTANE fields in the southern cell. DHX radar shows 50 dbZ core over 30k feet within an extreme instability zone of 4000+ j/kg. Issued a severe

Large jump in cooling seen above the divergence field in OCTANE, expecting further intensification shortly in the next.

DHX Radar Divergence maxing out around ~90-100 knots as of 2150z. OCTANE cloud top divergence is generally sitting between 25-40 knots.

Double Rainbow!

Deep persistent OCTANE divergence in speed and direction, core weakening slightly based on DHX radar but still likely warranted a second warning. No signs of real weakening in any of the satellite products, but radar not quite as tall with 50 dbZ core.

-Hellothere

Tags: None