Lightning Jump in GLM Products

GLM flash extent density product did a good job showing a jump in lightning activity over north central Kansas Tuesday afternoon. The flash extent density (upper right) increased some 10-15 minutes before the strongest reflectivity (upper left) was seen at the surface, showing that the lightning jump could have been used to get a lead time on potential hazards such as hail, etc. Also of note, there is no easily discernible change in the total optical energy (bottom right) product despite the detected increase in lightning activity. The average flash area product (bottom left) also exhibited little change.

Dave Grohl

Azimuthal Shear in SGF CWA

The mid level azimuthal shear product is doing a good job pinpointing the strongest updrafts along the line in southern Missouri, while the low level azimuthal shear product shows a lot of elongated shear zones, which one would expect. One issue i noticed is the low level azimuthal shear product seems to leave certain features in place over a period of several minutes while at the same time propagating these features downstream, thus resulting in the same feature being plotted twice in two different places. See the loop at the bottom for an example

-64BoggsLites

Increase in lightning activity across SGF CWA

GLM flash extent density (top left) and flash event density (top right) have shown increasing trends over the last 20-30 minutes across southern Missouri, within the broken line approaching the LSX CWA. Both of these products help to identify locations within a linear feature where updrafts are maximized. Additionally, the total optical energy product seems to be matching up well with respect to trends when compared to the ENTLN cloud flashes and CG strikes.

-64BoggsLites

Allsky, TPW, and NUCAPS Moisture and Instability Profiles

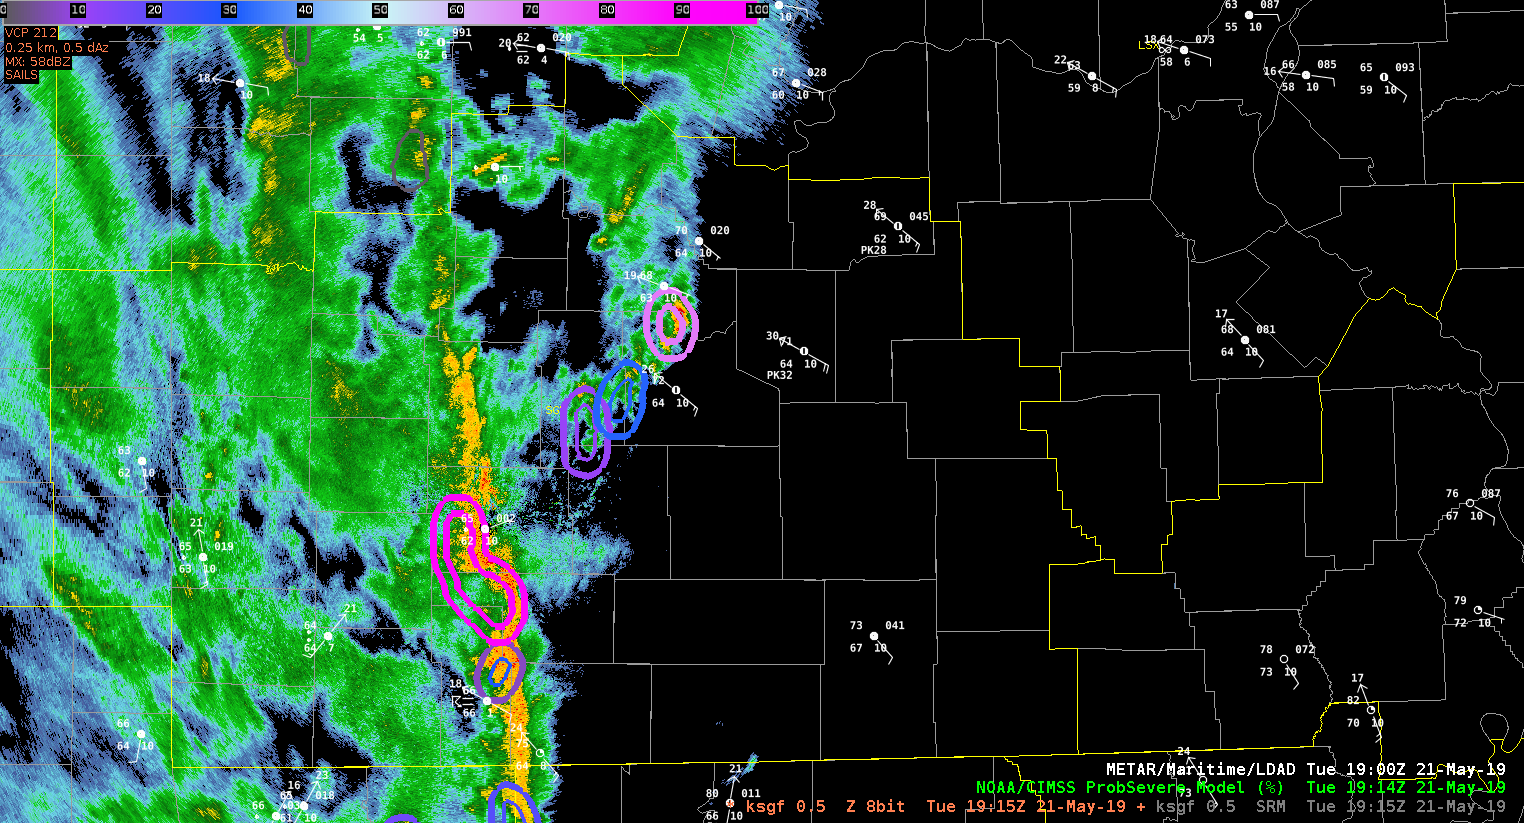
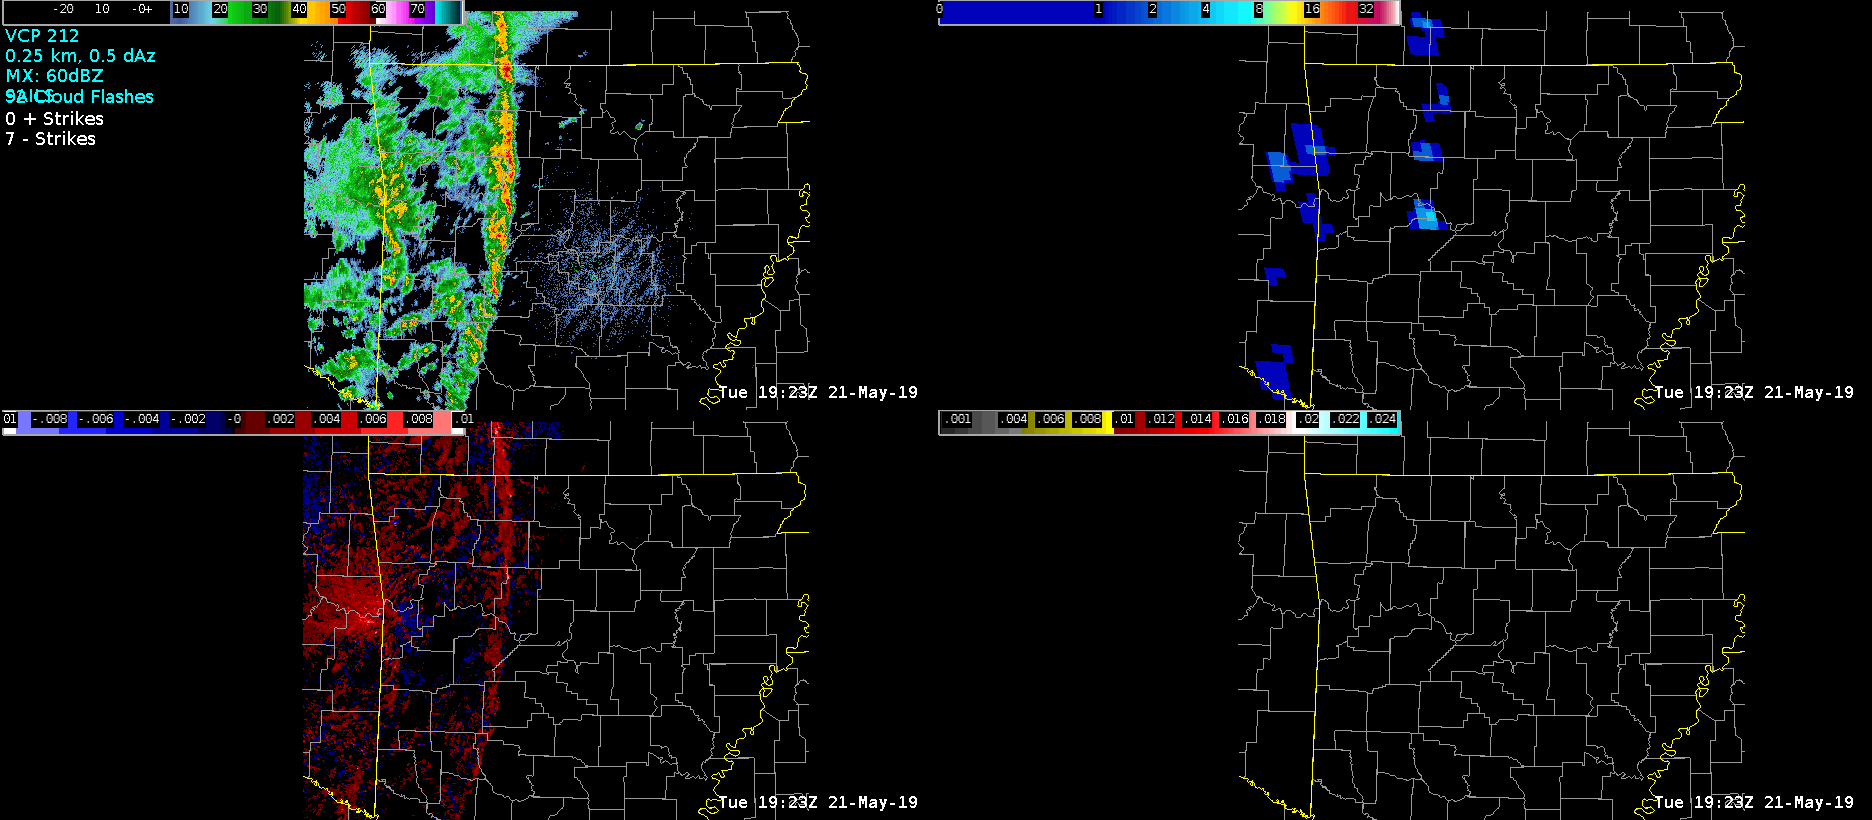
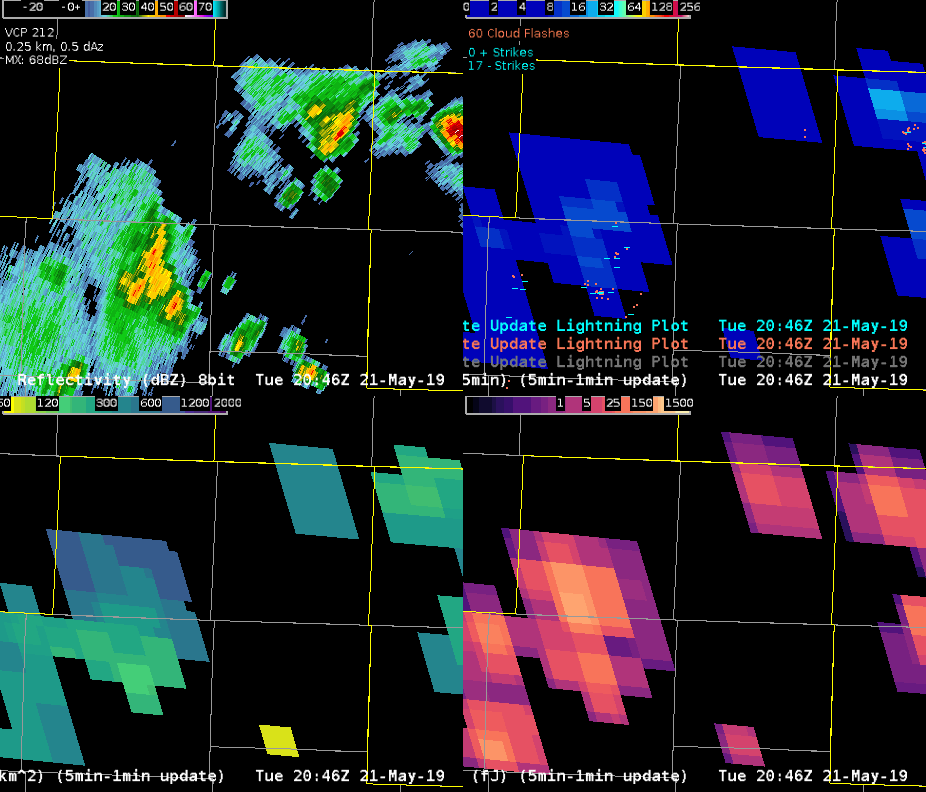
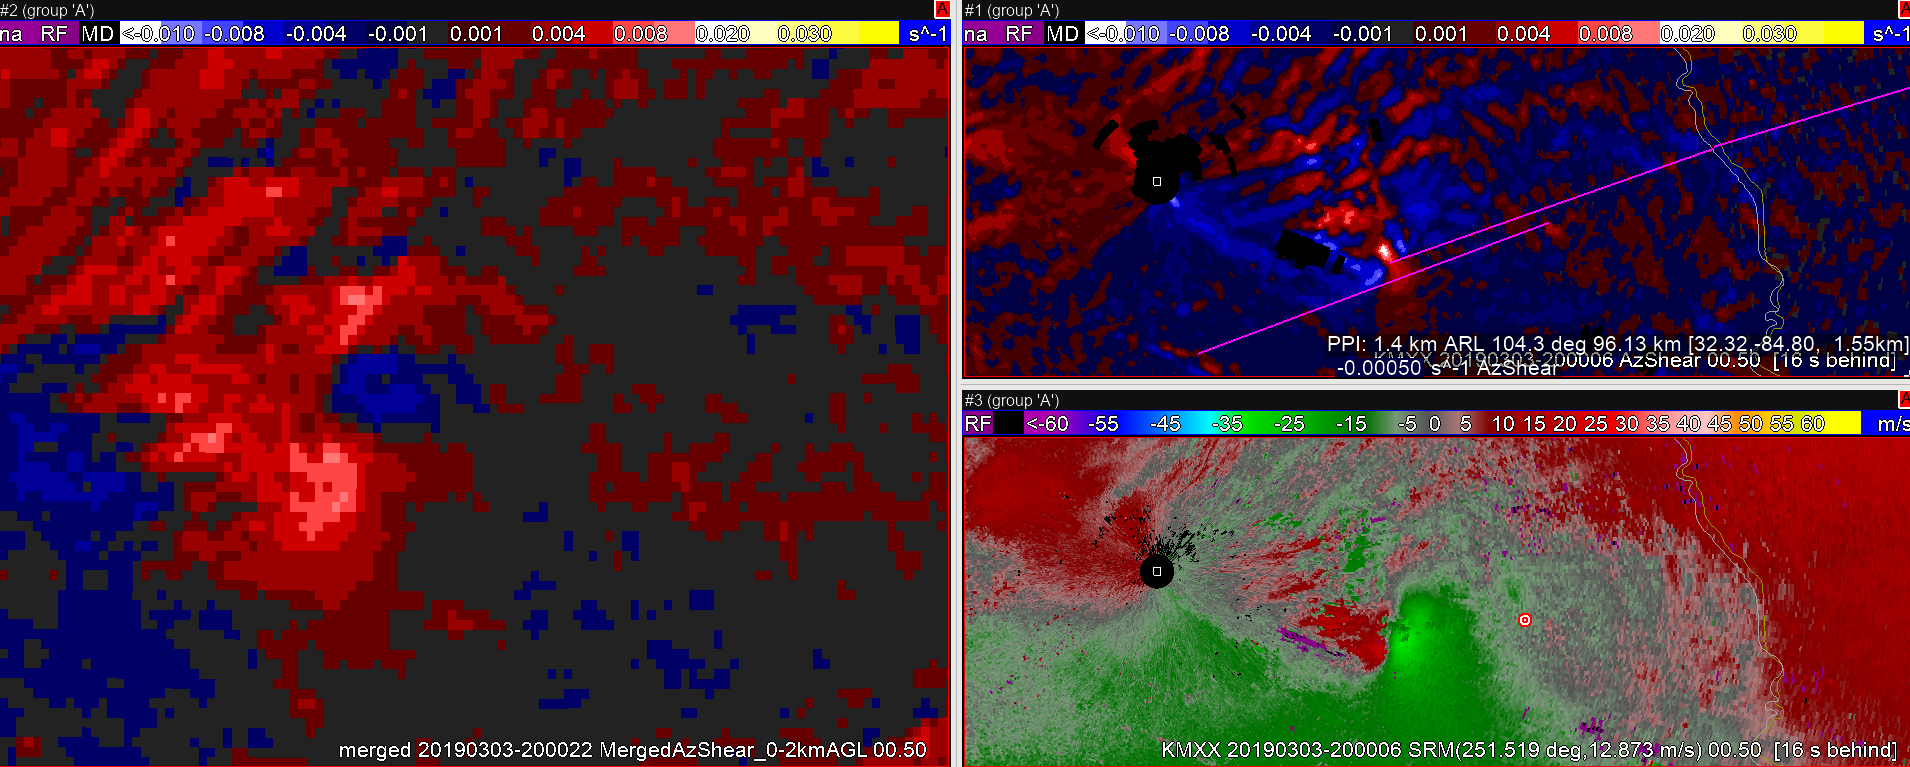
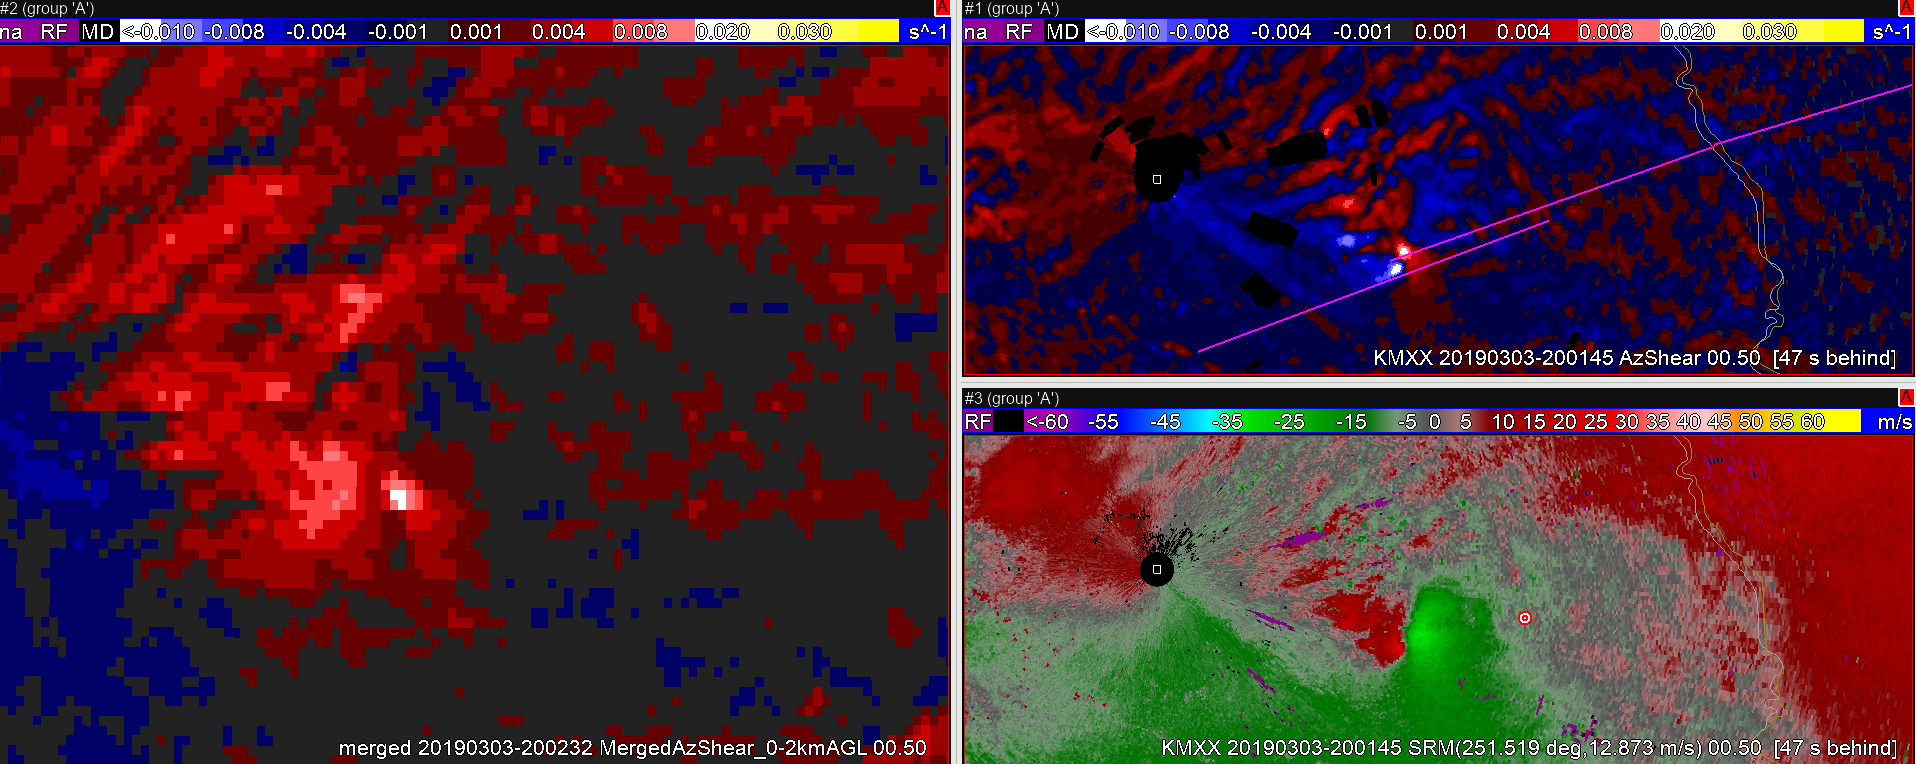
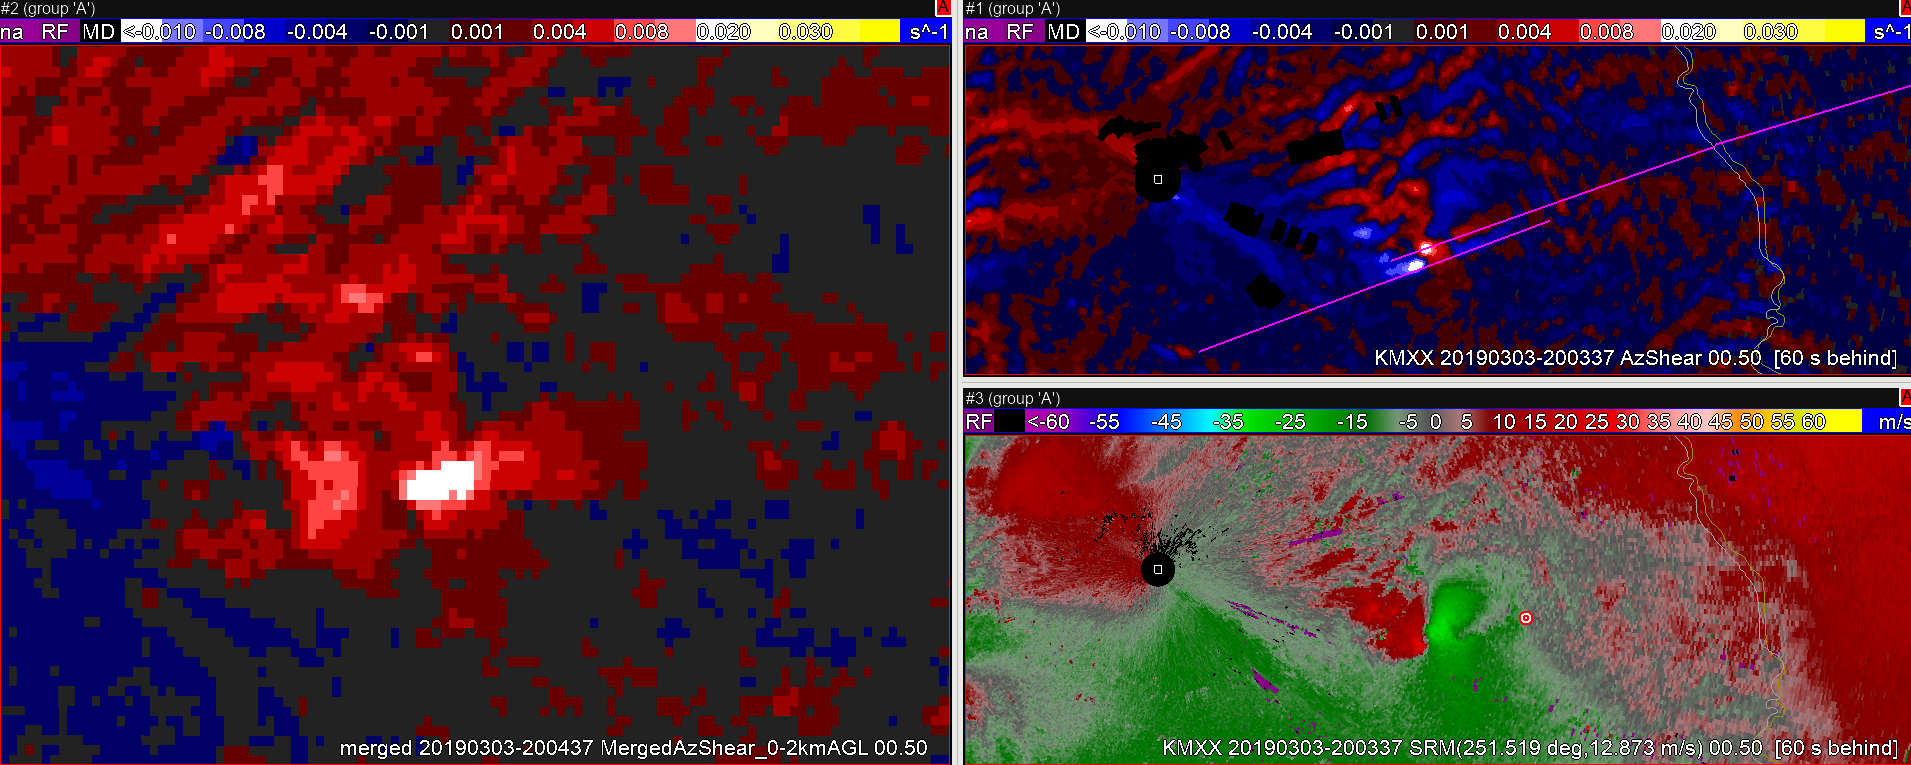
Radar image of a severe QLCS in NW Arkansas at 1923Z.  This line has been producing wind damage and a few spin up tornadoes. Next I’m going to diagnose column moisture and instability downstream, across north-central Arkansas using satellite and satellite-model merged products.

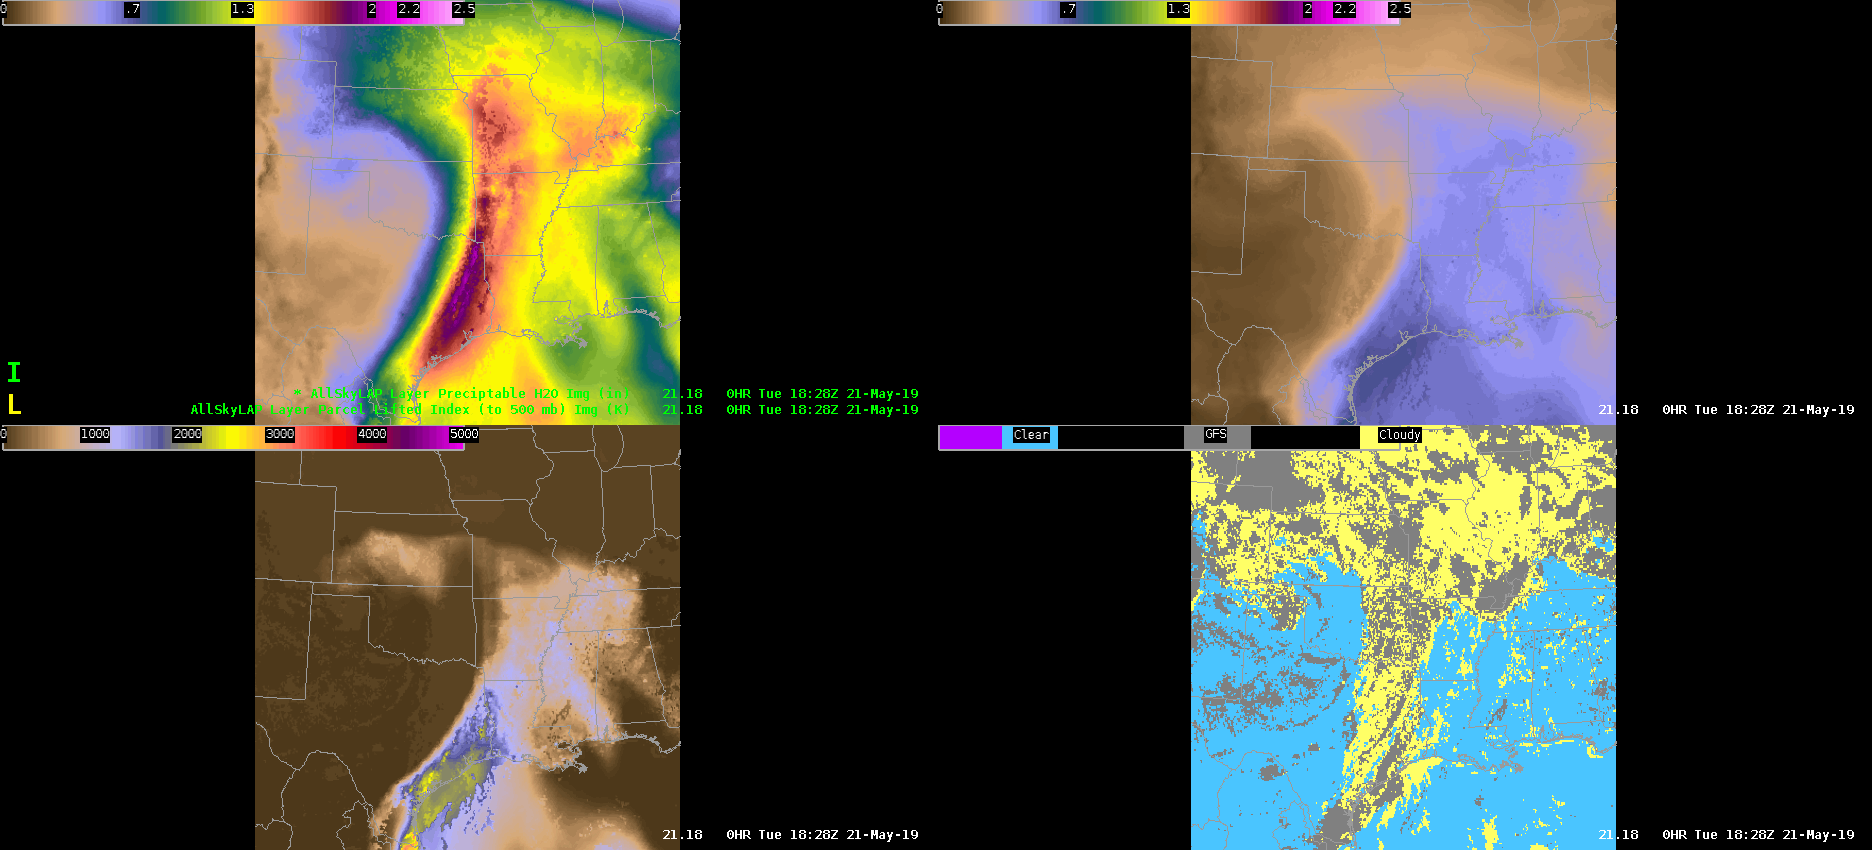
The GOES-16 AllskyLAP showed a deep plume of moisture extending from the Gulf of Mexico northward into Arkansas and Missouri.  Specifically, in north-central Arkansas, sampled PWATs were around 1.60 inches and MUCAPE was near 700-800 J/kg. Skies were mainly clear in this area, which resulted in a relatively smooth appearance in the PWAT and CAPE plots. Interestingly, and not plotted here, the 700-300mb AllskyLAP PWAT had lower values or drier conditions to the east of the approaching QLCS. This presence of mid-level dry air may be conducive for severe weather over north-central and northeast Arkansas over the next 1-3 hours — especially for damaging winds.

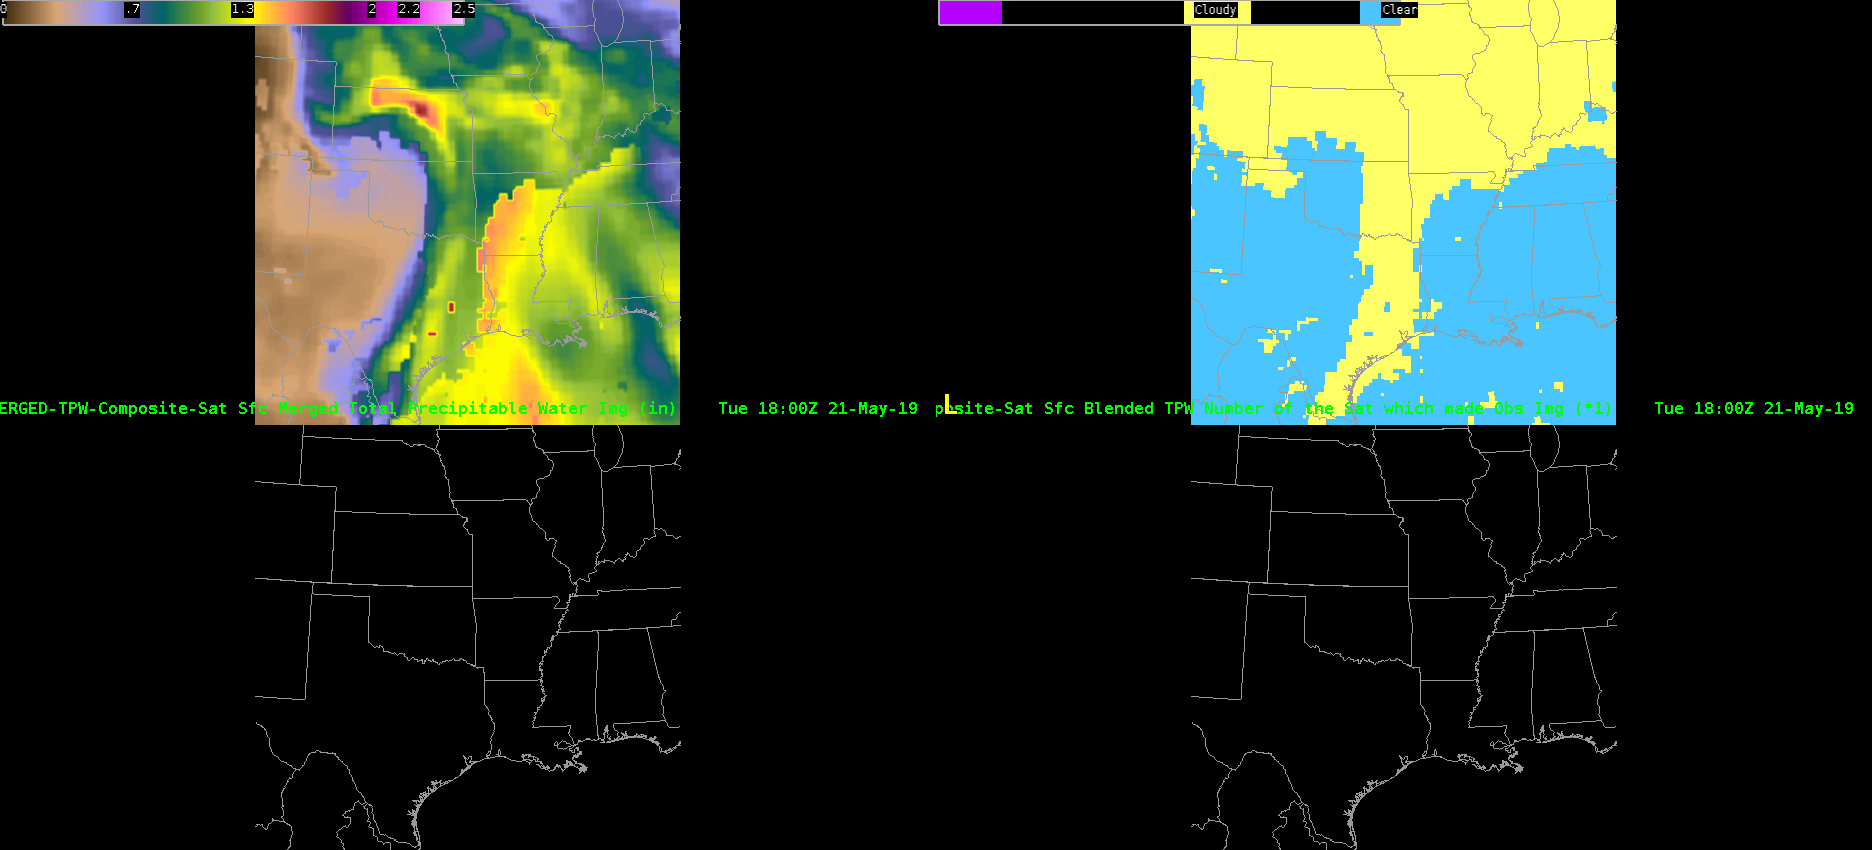
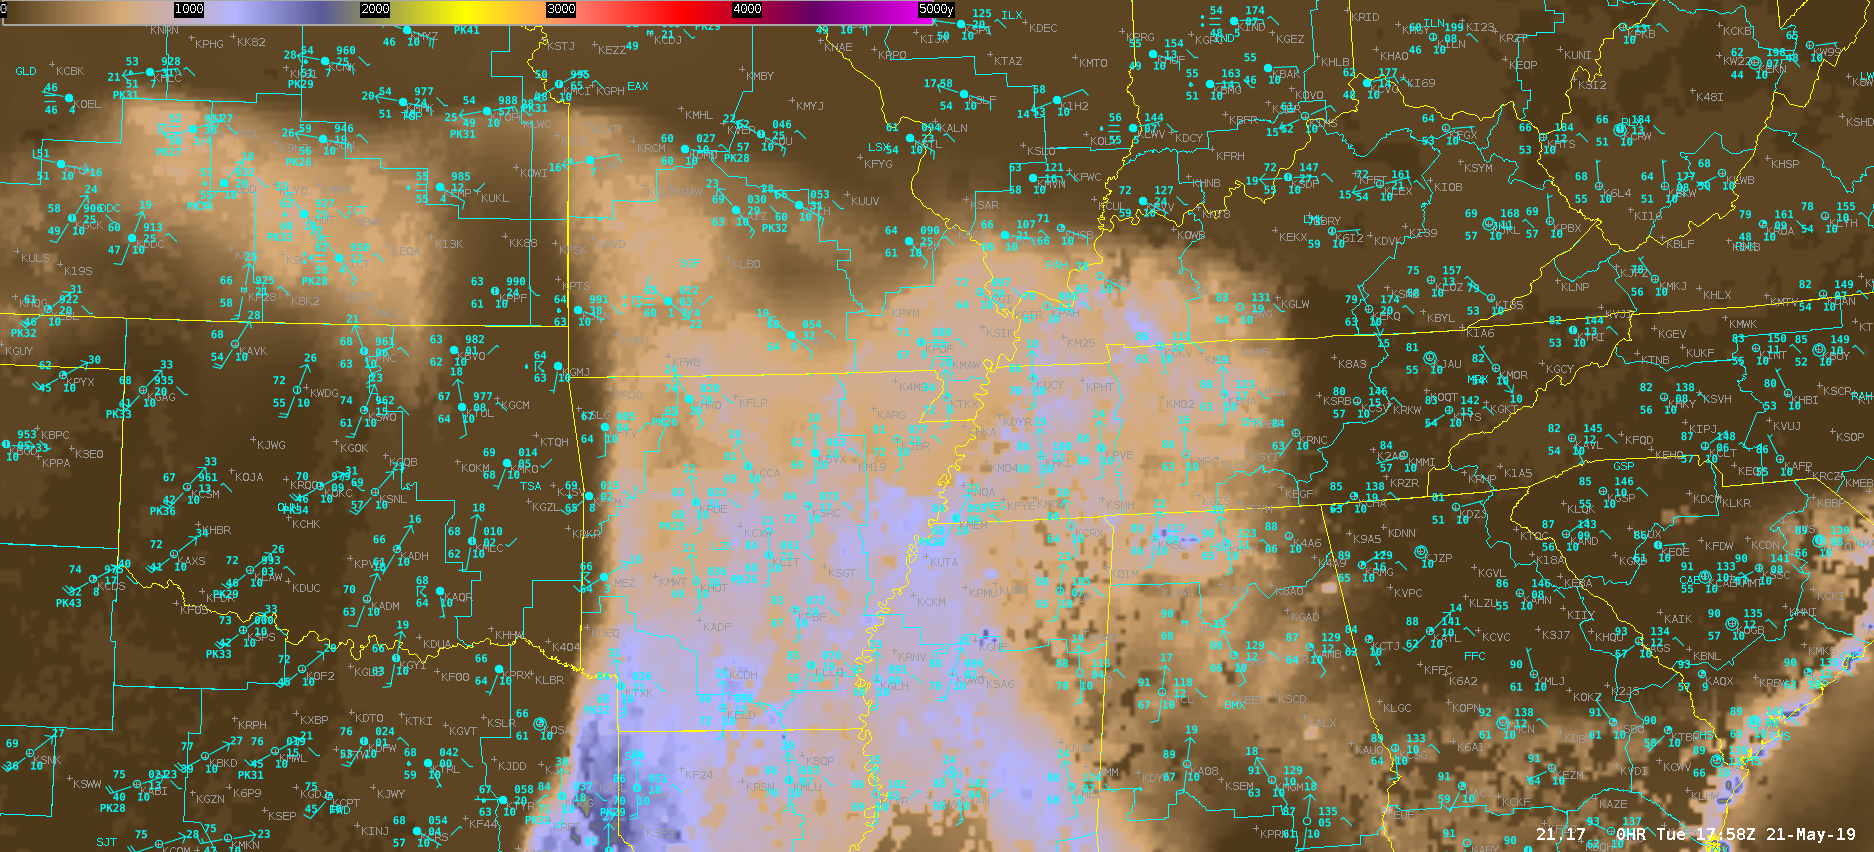
Merged TPW data at 19Z estimated PWATs near 1.50 inches into north-central Arkansas. However, there was a sharp discontinuity from 1.50 to 1.00 into the northwest part of the state where widespread cloud cover was present and the data originated from polar orbiting satellites (some of which could have been advected in). The SPC mesoanalysis did not display a sharp gradient in PWATs in this area, but rather had a gradual decrease to 1.30 inches.

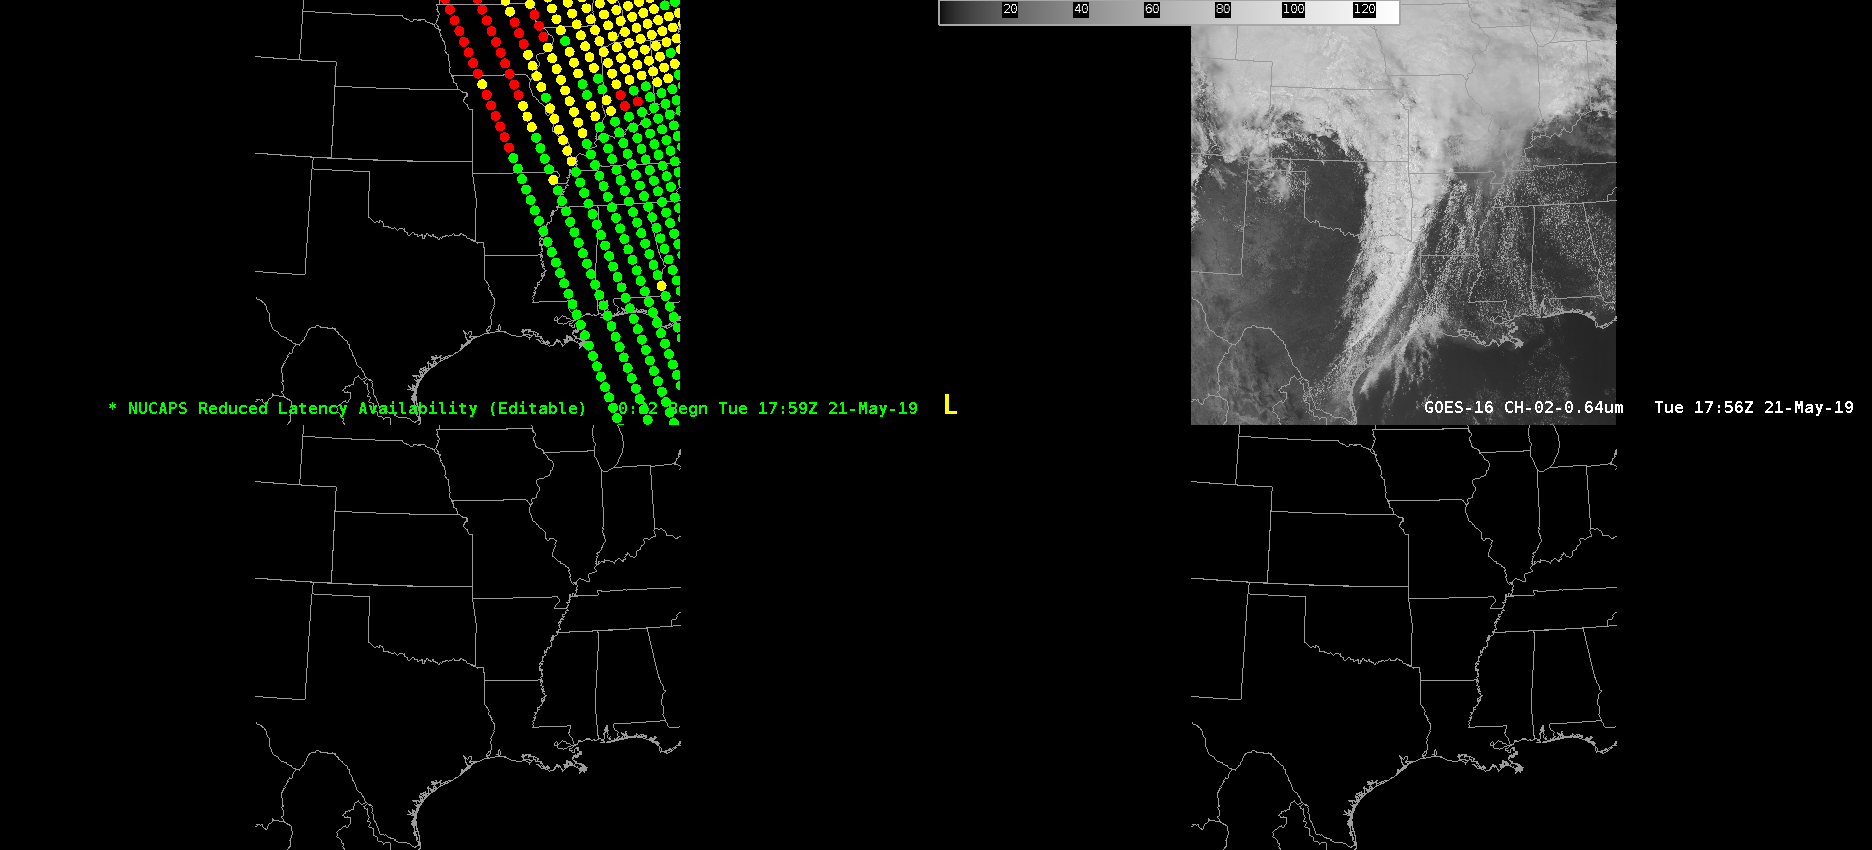
Not the best satellite pass with my area of concern on the far western fringe of the NUCAPS data. Surprisingly, the sounding data on the edge in northern Arkansas was nearly identical to the SPC mesoanalysis data with values near 1200 J/kg! It likely helped that skies were mainly clear at the time of the pass. The GOES-16 AllskyLAP data was underdone in comparison.  As mentioned, only up to 700-800 J/kg.

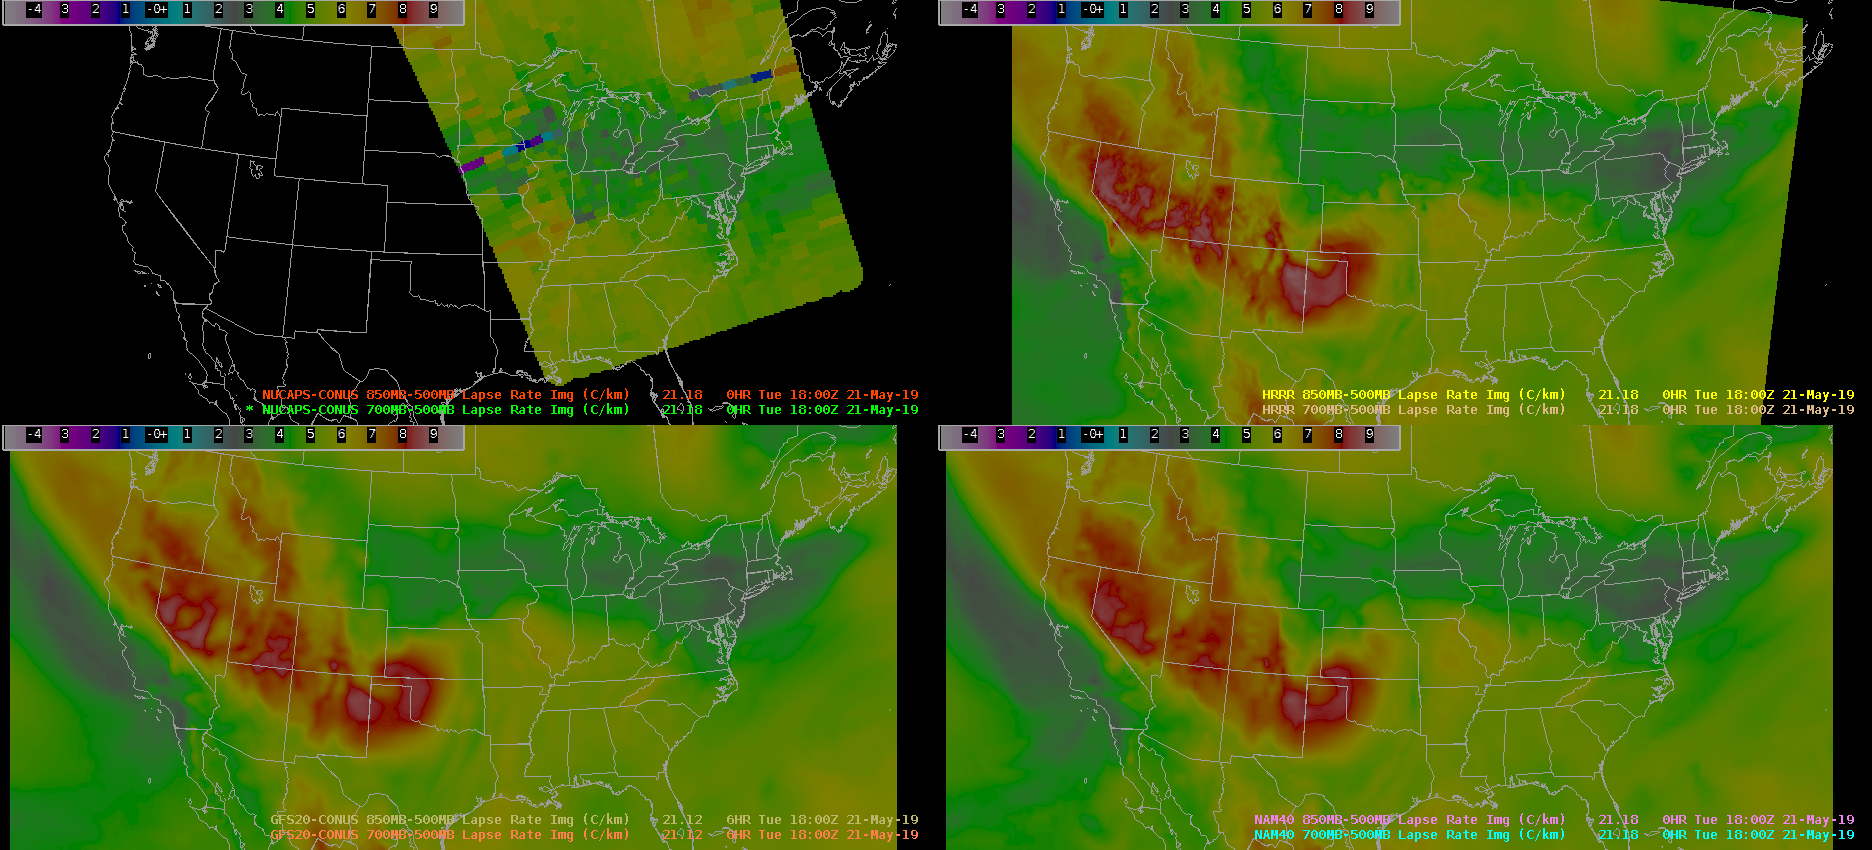
NUCAPS 700-500mb lapse rates in northern Arkansas are close to model forecasts. The NUCAPS in this pass was indicating lapse rates around 6.2 C/km. Model data was generally a little bit lower around 5.8 C/km.  The SPC mesoanalysis was on the high end near 6.5 C/km. Roy

AzShear and QLCS

A little later in the day on March 3, 2019, a complex QLCS was seen on KMXX.

The base reflectivity at 0.5 degrees (left) shows several different features along the complex that need investigation given the favorable environment for tornadoes. The corresponding base velocity product (upper right) show several locations where shear is present. However, the single radar AzShear product highlights the portions along the line that look the most threatening.

Thorcaster

Single-Radar AzShear vs MRMS Merged Shear: Lag Time

An advantage of single-radar vs. merged az shear jumped out right at the start of today’s simulation: lag time. The single radar product looks to have a 2-3 minute jump on the merged data with respect to low-level rotation, as shown in the time sequence below. The tightening/strengthening rotation couplet begins to jump off the screen in the single-radar data at the 2000 scan further intensifies through 2004. The area of strengthening low level rotation is much more muted in the merged data at 2000. It is more noticeable in the 2002 scan before becoming quite obvious by 2004. This small lag may not be significant, but it could be the difference of a  few minutes worth of lead time in warning decisions.

Dave Grohl

Single Radar AzShear Helpful in picking out strongest rotations

In going through the case of March 3, 2019, One if the useful items that stood out was the single radar AzShear Product. See the screenshot below.

Looking at the base velocity product in the upper right window, there are several circulations that can be seen. Similarly, the reflectivity image (lower right) shows several cells of potential interest. Fortunately, the AzShear product (left) highlights the cells you should investigate first by looking at the cells with the highest AzShear Values. This will be very helpful in decision making on the warning desk in a forecast office.

Thorcaster


ProbSevere Running Hot in SGF CWA

Looking at convection developing upstream across southern MO, I noticed prob severe had an object advertising 71% for TOR in the northern portion of the SGF  CWA (about a county and a half south of the CWA bondary. This particular cell does not show any rotation in the SGX base data, the Azimuthal shear doesn’t show much, and GLM lightning shows no electrical activity with this cell. I’m assuming the algorithm is keying more on environmental factors than anything else in coming up with this probability?

-64BoggsLites

EWP Operations Tuesday, May 21

Today we are continuing on with the strong upper level trough moving into the Midwest. Today will be focused on mainly linear convection focusing on a QLCS moving through Arkansas and Missouri this afternoon. We will be operating in the St. Louis and Little Rock CWAs with an opportunity to also monitor for developing convection back near the center of the upper low in central Kansas later this afternoon.

-Michael


Comparing All Sky LAP CAPE with RAOBs

One of the forecast problems of the day for the LSX forecast area is determining how far north the reservoir of instability will extend. It may be useful to monitor the all-sky LAP CAPE product in concert with surface obs to assess the destabilization throughout the day. Looking at a comparison of the product with selected 12Z RAOBs, the product appears to have a reasonable representation of CAPE values so far.

The ILX RAOB is in the stable air well north of the warm front:

Although the MLCAPE at SGF is zero, the LAP CAPE produce is indicating around 400 J/kg of CAPE, which appears to reflect the MUCAPE in the sounding:

The LAP CAPE product underestimated the CAPE at LZK, but still gets the general idea:

While some of the details may not be correct, and it is blocky in places, the LAP CAPE product appears to be doing a reasonable job at depicting the reservoir of instability over the southern Plains. By 18Z, it showed the northward spread of instability in concert with the northward advancing warm front:

Ron Dayne