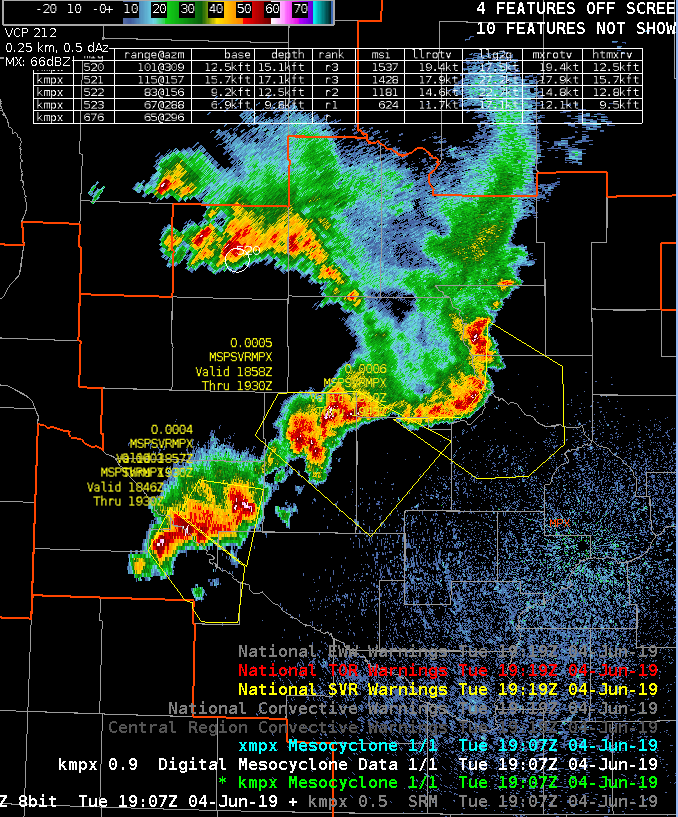
The public reported golf ball size hail 1 SW of Silver Lake in McLeod Co. at 348 pm CDT. At this time, ProbSevere depicted 99% for severe hail, and there was a ZDR minimum within the core of the storm, and the hydro class showed giant hail as the precip type (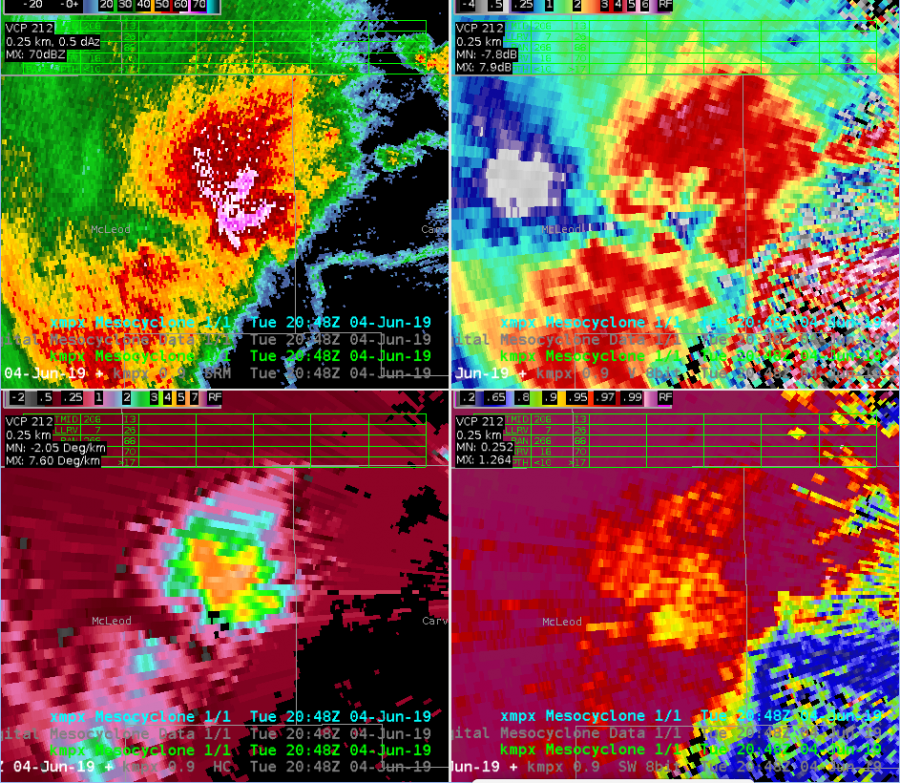
 not shown).
Category: News
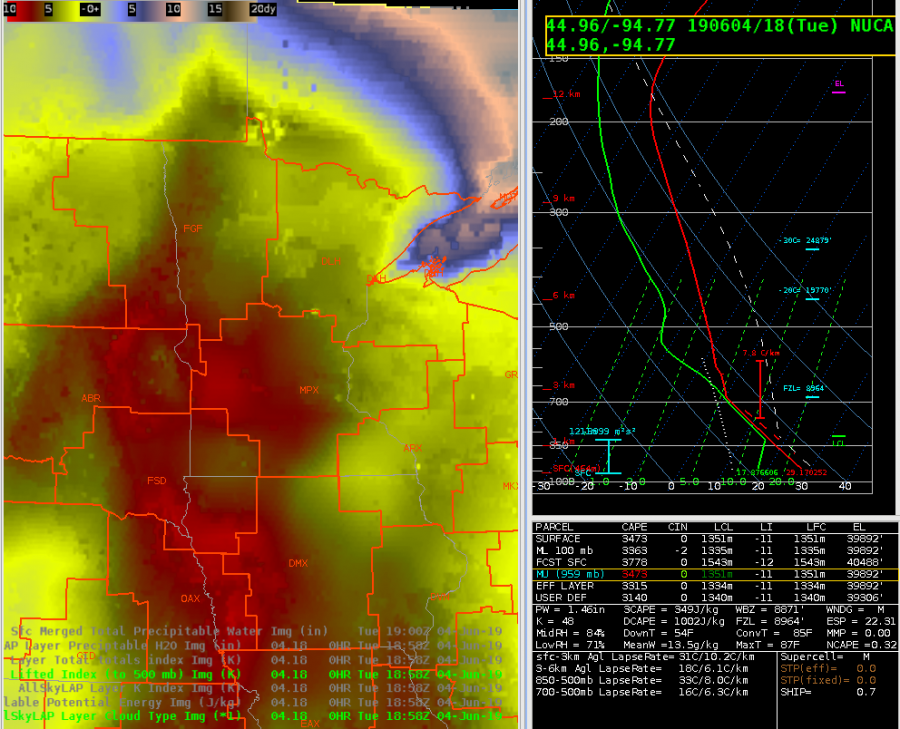
Forecast NUCAPS Info
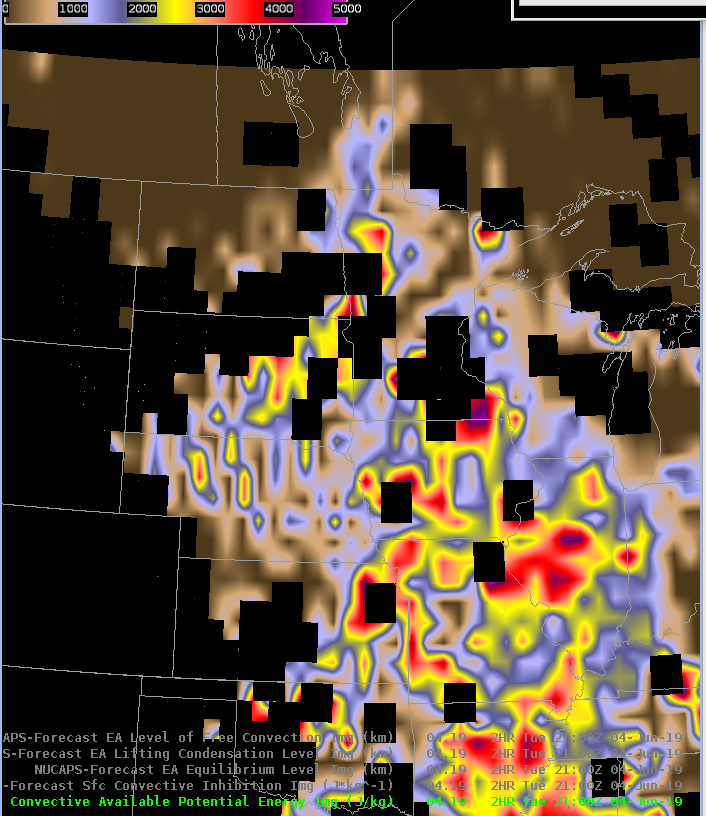
NUCAPS data indicates well the area that has received rain, and the airmass the current cluster will be going into (the colors just outside of the blacked-out area.
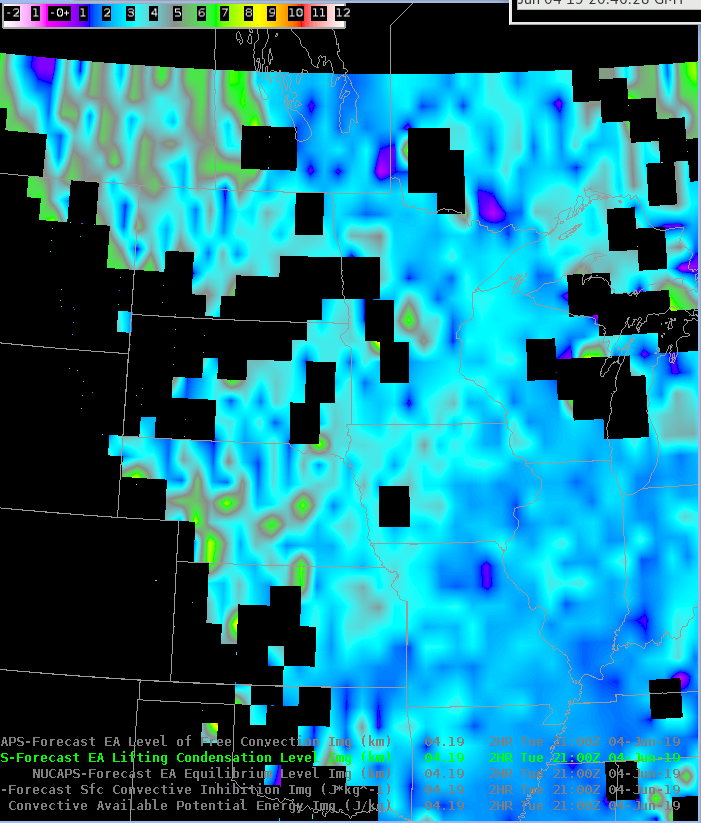
As we were thinking of some tornadogenesis earlier, seeing the relatively high LCLs from this product may deter us from issuing a later TOR warning.
Charley
EAX Near-Term AFD (Mountain Bone)
A decaying MCS continues to progress northeast across the central portions of northernmost Missouri, allowing for destabilization to begin in its wake. This is especially true along and west of Interstate 35 in NW Missouri/eastern-most KS where clouds have cleared for several hours according to GOES_East Channel 2 imagery. With in-situ observations showcasing upper-60s to low 70s dewpoints at the surface across the central and eastern portions of the state, it likely won’t take much in the way of surface heating to allow for convective initiation this afternoon and evening. Based on downstream NUCAPs soundings, rather robust SFC CAPE values in the 3000 – 4000 J/KG range will likely spread northwestward with time, which should be ample to support some convection this afternoon and evening. Best (early) thoughts on initiation location this afternoon will be across the easternmost portions of the CWA along a line from Boonville to Centerville along the eastern most periphery of the nearly stalled MCS, which could provide for enough lift to get things firing by late afternoon and evening. Also keeping an eye on a downstream shortwave clearly evident in GOES_East water vapor imagery which could push an additional round of multicellular convection through late this afternoon and evening. Most likely to brush the southern and eastern portions of the CWA, which currently finds itself adjacent to a severe thunderstorm watch extending to its south and eastward. .
Any storms that do form or push into the area should have plenty of moisture and instability to sustain themselves. All_Sky TPW and NUCAP soundings show a plume of 1.3 to 1.5 inch PWATT values extending north throughout the entire CWA, which also brings the concern for some additional flooding, especially across the southeastern portions of the CWA which will likely see more numerous coverage of storms. Low 0-1km and 0-6km effective shear values should limit the presence of sustained supercells, however, a strong to severe thunderstorm or two will remain possible this afternoon and evening.
————————————————————————————————-Mountain Bone
Error message I get at my WFO on ProbSevere
Pops up as a red banner and ProbSevere disabled.
Paint error: null:: The resource [NOAA/CIMSS ProbSevere Model (%)] has been disabled.com.raytheon.uf.viz.core.exception.VizException: Paint error: null:: The resource [NOAA/CIMSS ProbSevere Model (%)] has been disabled.
at com.raytheon.uf.viz.core.drawables.AbstractRenderableDisplay.paintResource(AbstractRenderableDisplay.java:531)
at com.raytheon.uf.viz.core.maps.display.MapRenderableDisplay.paint(MapRenderableDisplay.java:188)
at com.raytheon.uf.viz.d2d.core.map.D2DMapRenderableDisplay.paint(D2DMapRenderableDisplay.java:172)
at com.raytheon.viz.ui.panes.VizDisplayPane.glDrawInternal(VizDisplayPane.java:523)
at com.raytheon.viz.ui.panes.VizDisplayPane.draw(VizDisplayPane.java:477)
at com.raytheon.viz.ui.panes.DrawCoordinatedPane.draw(DrawCoordinatedPane.java:172)
at com.raytheon.viz.ui.panes.DrawCoordinatorJob$1.run(DrawCoordinatorJob.java:196)
at org.eclipse.ui.internal.UILockListener.doPendingWork(UILockListener.java:162)
at org.eclipse.ui.internal.UISynchronizer$3.run(UISynchronizer.java:154)
at org.eclipse.swt.widgets.RunnableLock.run(RunnableLock.java:35)
at org.eclipse.swt.widgets.Synchronizer.runAsyncMessages(Synchronizer.java:182)
at org.eclipse.swt.widgets.Display.runAsyncMessages(Display.java:4528)
at org.eclipse.swt.widgets.Display.readAndDispatch(Display.java:4146)
at org.eclipse.e4.ui.internal.workbench.swt.PartRenderingEngine$4.run(PartRenderingEngine.java:1121)
at org.eclipse.core.databinding.observable.Realm.runWithDefault(Realm.java:336)
at org.eclipse.e4.ui.internal.workbench.swt.PartRenderingEngine.run(PartRenderingEngine.java:1022)
at org.eclipse.e4.ui.internal.workbench.E4Workbench.createAndRunUI(E4Workbench.java:150)
at org.eclipse.ui.internal.Workbench$5.run(Workbench.java:687)
at org.eclipse.core.databinding.observable.Realm.runWithDefault(Realm.java:336)
at org.eclipse.ui.internal.Workbench.createAndRunWorkbench(Workbench.java:604)
at org.eclipse.ui.PlatformUI.createAndRunWorkbench(PlatformUI.java:148)
at com.raytheon.uf.viz.personalities.cave.component.CAVEApplication.startComponent(CAVEApplication.java:173)
at com.raytheon.uf.viz.application.VizApplication.start(VizApplication.java:102)
at org.eclipse.equinox.internal.app.EclipseAppHandle.run(EclipseAppHandle.java:196)
at org.eclipse.core.runtime.internal.adaptor.EclipseAppLauncher.runApplication(EclipseAppLauncher.java:134)
at org.eclipse.core.runtime.internal.adaptor.EclipseAppLauncher.start(EclipseAppLauncher.java:104)
at org.eclipse.core.runtime.adaptor.EclipseStarter.run(EclipseStarter.java:388)
at org.eclipse.core.runtime.adaptor.EclipseStarter.run(EclipseStarter.java:243)
at sun.reflect.NativeMethodAccessorImpl.invoke0(Native Method)
at sun.reflect.NativeMethodAccessorImpl.invoke(NativeMethodAccessorImpl.java:62)
at sun.reflect.DelegatingMethodAccessorImpl.invoke(DelegatingMethodAccessorImpl.java:43)
at java.lang.reflect.Method.invoke(Method.java:498)
at org.eclipse.equinox.launcher.Main.invokeFramework(Main.java:673)
at org.eclipse.equinox.launcher.Main.basicRun(Main.java:610)
at org.eclipse.equinox.launcher.Main.run(Main.java:1519)
at org.eclipse.equinox.launcher.Main.main(Main.java:1492)
Caused by: java.lang.NullPointerException
at edu.wisc.ssec.cimss.common.dataplugin.probsevere.ProbSevereRecord.getPolyGeoms(ProbSevereRecord.java:284)
at edu.wisc.ssec.cimss.viz.probsevere.rsc.ProbSevereResource.paintInternal(ProbSevereResource.java:302)
at com.raytheon.uf.viz.core.rsc.AbstractVizResource.paint(AbstractVizResource.java:542)
at com.raytheon.uf.viz.core.drawables.AbstractRenderableDisplay.paintResource(AbstractRenderableDisplay.java:528)
… 35 more
Watching to the west again

Where AllSky says LI is -8, new development on IR.
NUCAPS All Sky LAPS contrast
A modified NUCAPS sounding depicted a LI of -3 in the wake of the convection in the NW corner of the MPX CWA. This is within an area of more cloudiness and the All Sky LAP derived product is using GFS in this area, and shows a more unstable environment with a LI of -7.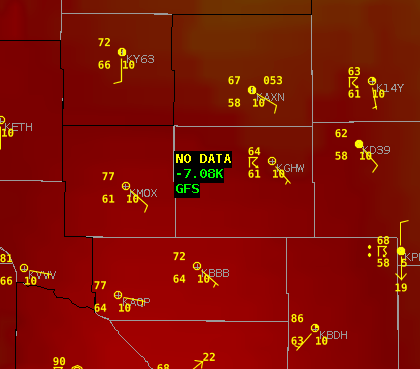
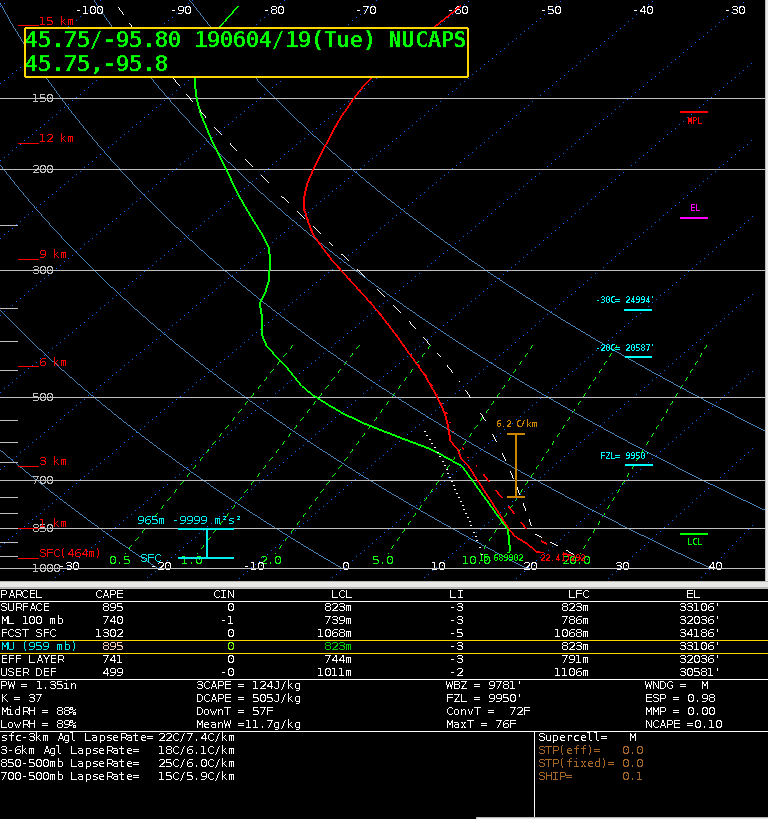
NUCAPS comes in more unstable
AllSky LI is dropping over time…with the peak red color above being around -8. Modified NUCAPS sounding came up with -11…whereas non-modified was -6. CAPE also is more unstable in new sounding…whereas AllSky is in the mid 2000s, NUCAPS was mid 3000s…non-modified in the mid 1000s.
Now starting to get mesos
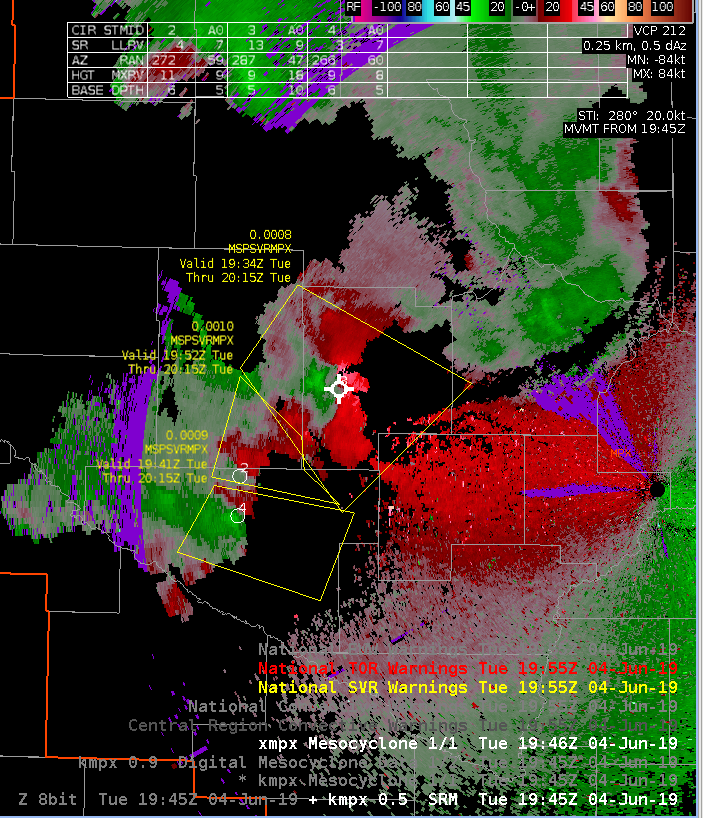
Southern warning now gusting out, and getting a rotation on the north side of that gusting.
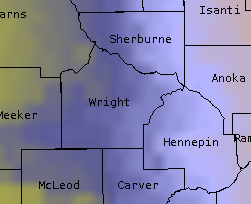
Bowing Segment moving toward Wright Co., MN
A bowing segment heading toward Wright Co., MN initially showed diminishing convective trends. However, some drying in the wake of the line combined with strong wind speeds within the lowest tilts of the radar depicted some concern for severe wind gusts, and after a diminishing trend ProbSevere did begin to increase again. Looking at the All Sky LAP CAPE, instability increased from ~960 J/kg at 1627z to ~1650 J/kg at 1828z, so the All Sky CAPE product showed some utility of assessing the downstream convective environment.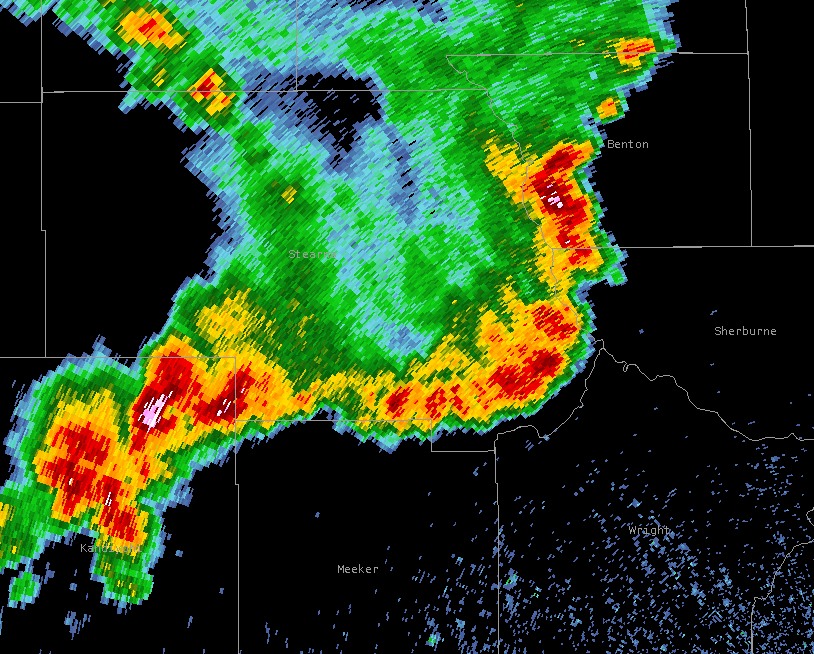
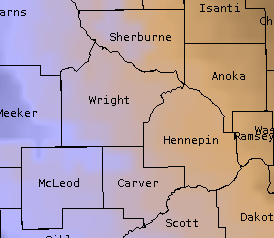
FGF cell developing into far northwest MPX area…moving into a little better CAPE environment