Another Cycling Cell

3-6km AzShear shows the cell that had caused an earlier short-lived tornado to the west starting to tighten up again. The SRM shows another convergence zone lining up perpendicular to the shear vector.

The 0-2km shear merged product may not be bad to use in this region between MXX and EOX.

A few minutes later that product shows a strengthening meso there, coupled with a broad couplet.

Charley

Tags: None

Northern Cells Still Higher AzShear, but Couplet not as Tight

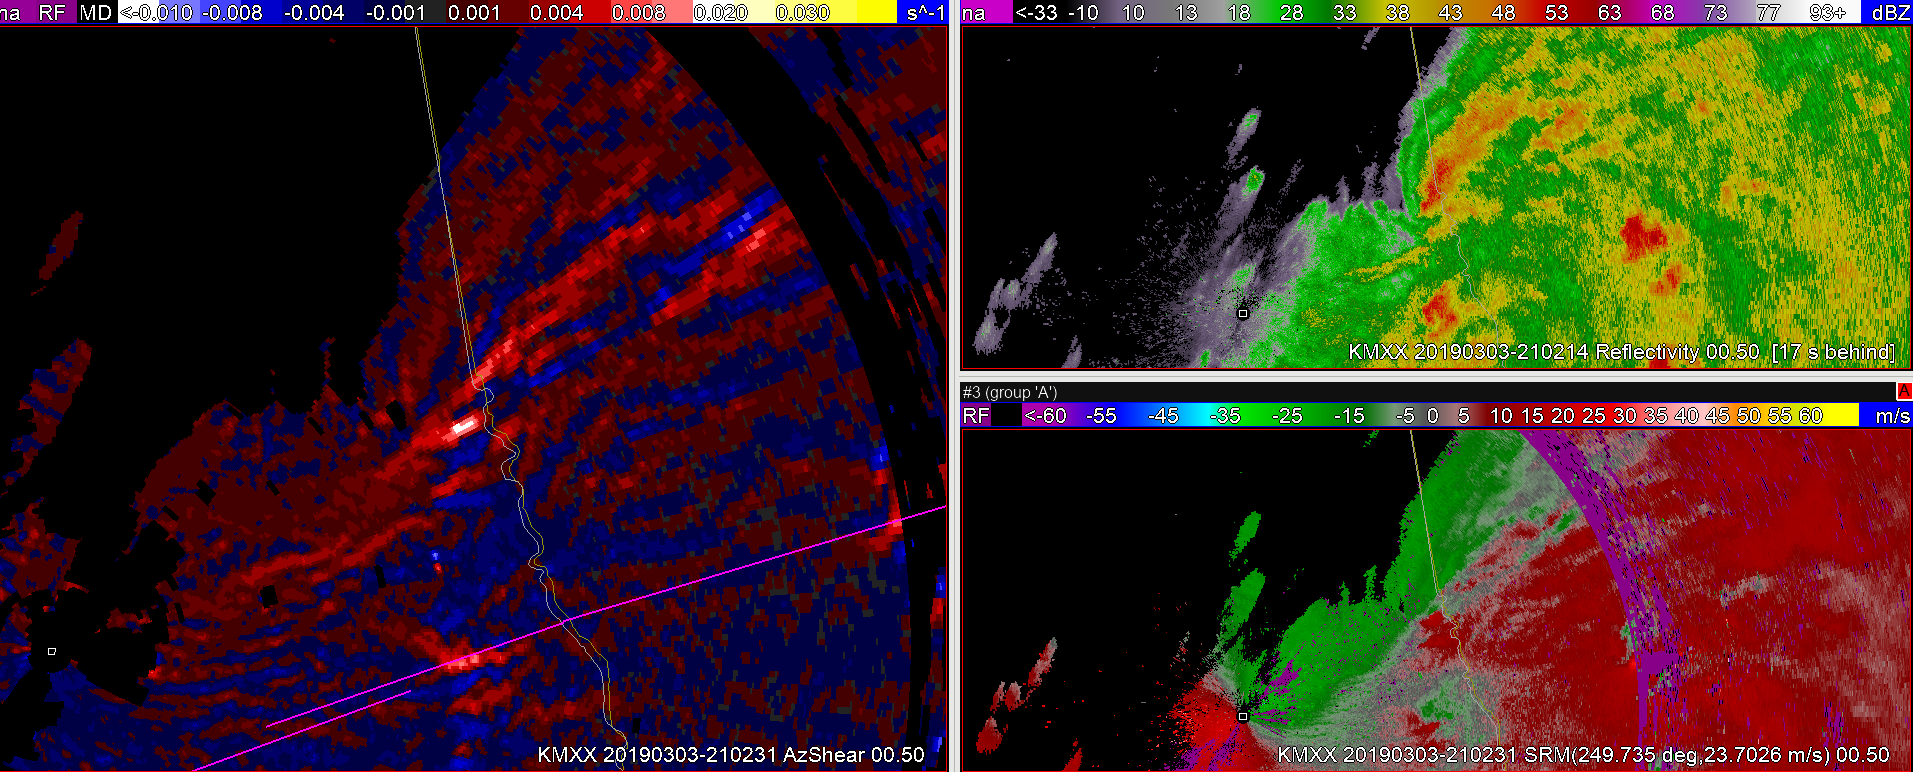
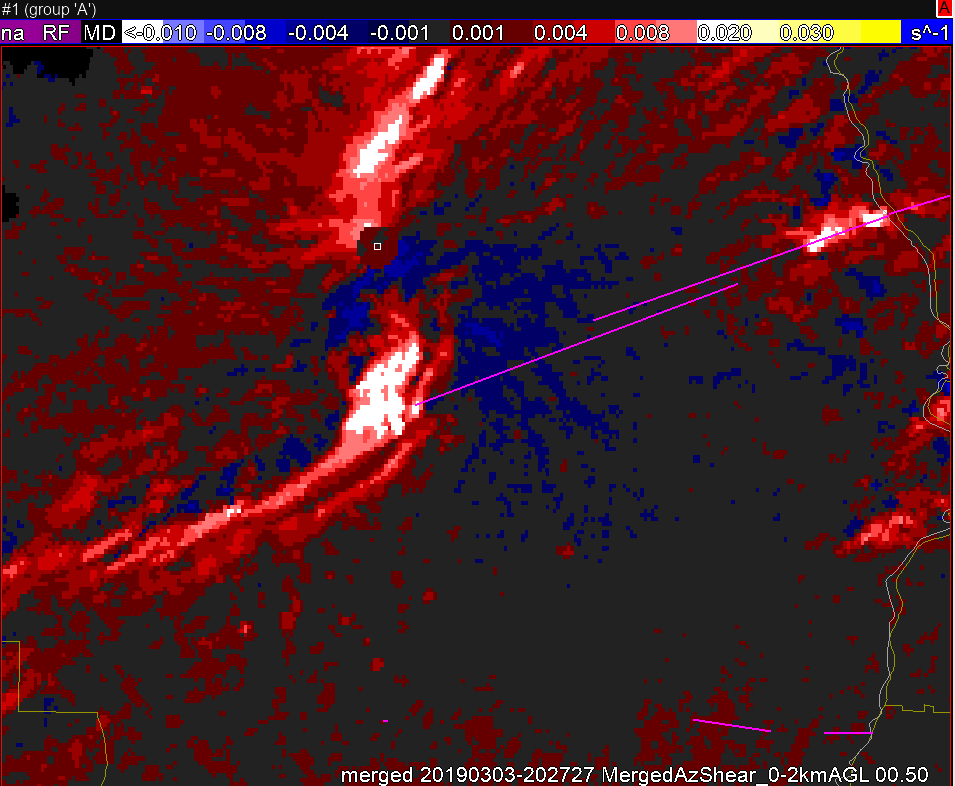
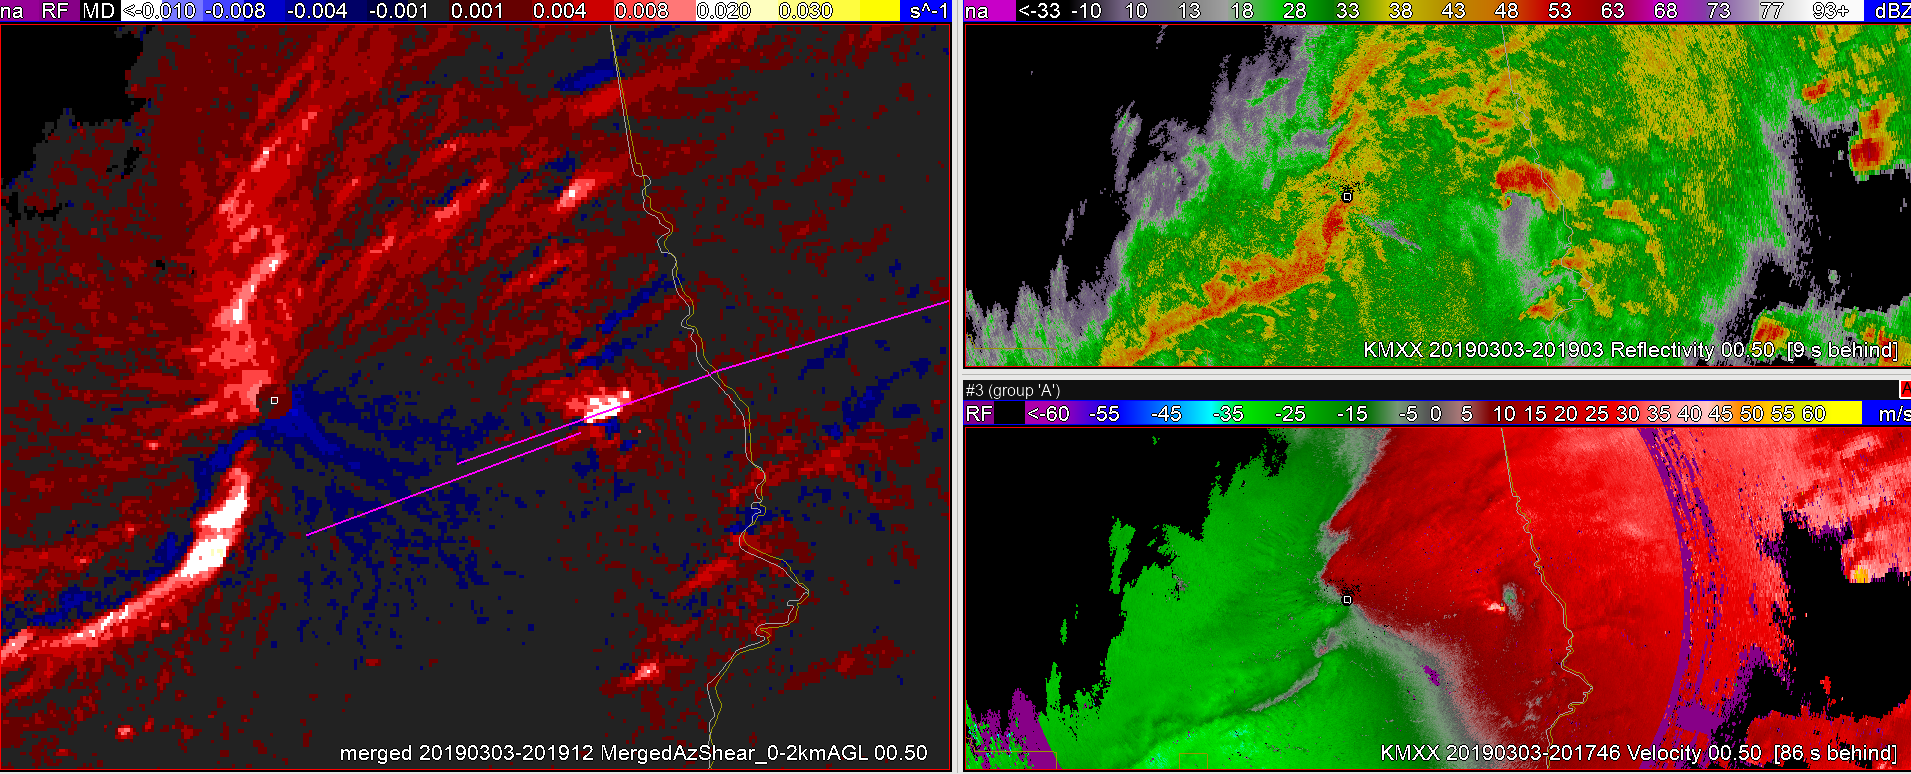
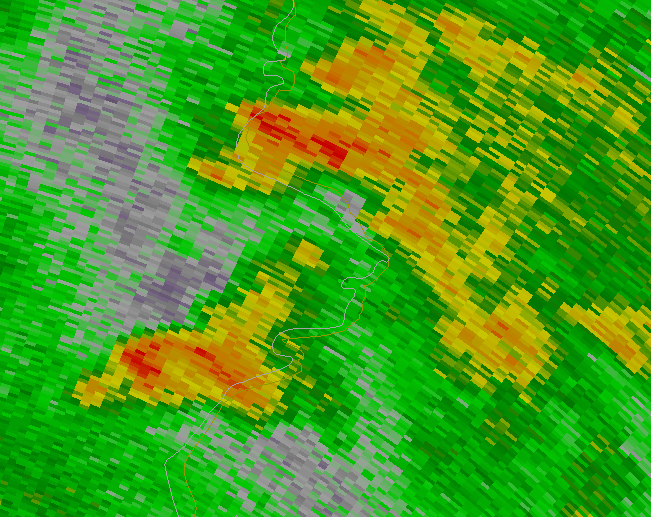
The northern line breaks still have some higher base tilt AzShear, but the couplets are not as strong.

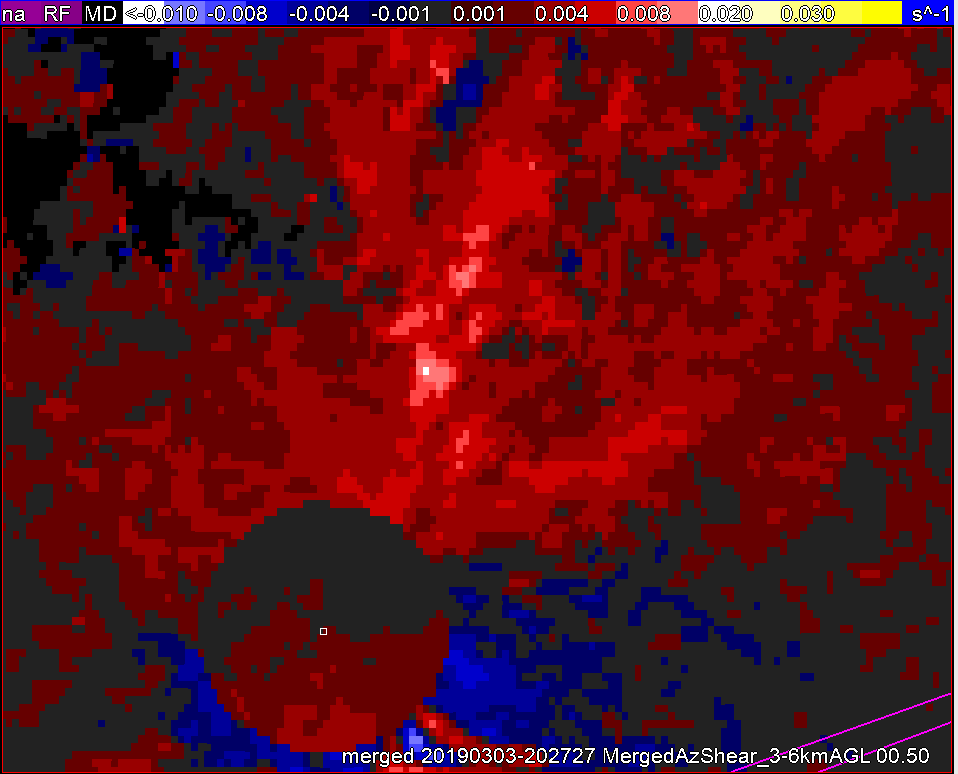
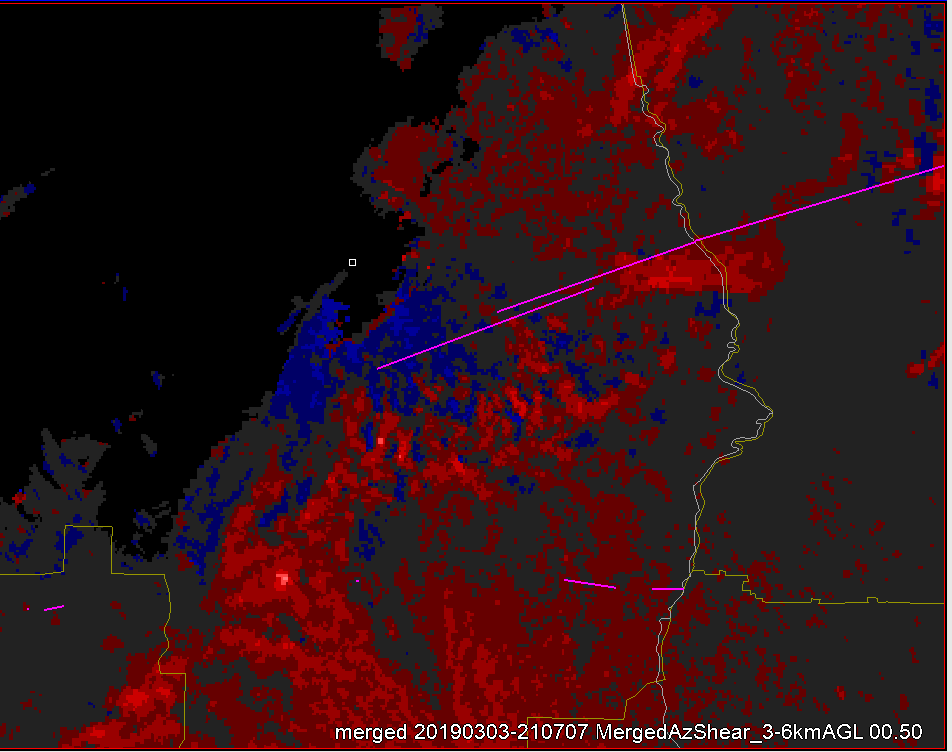
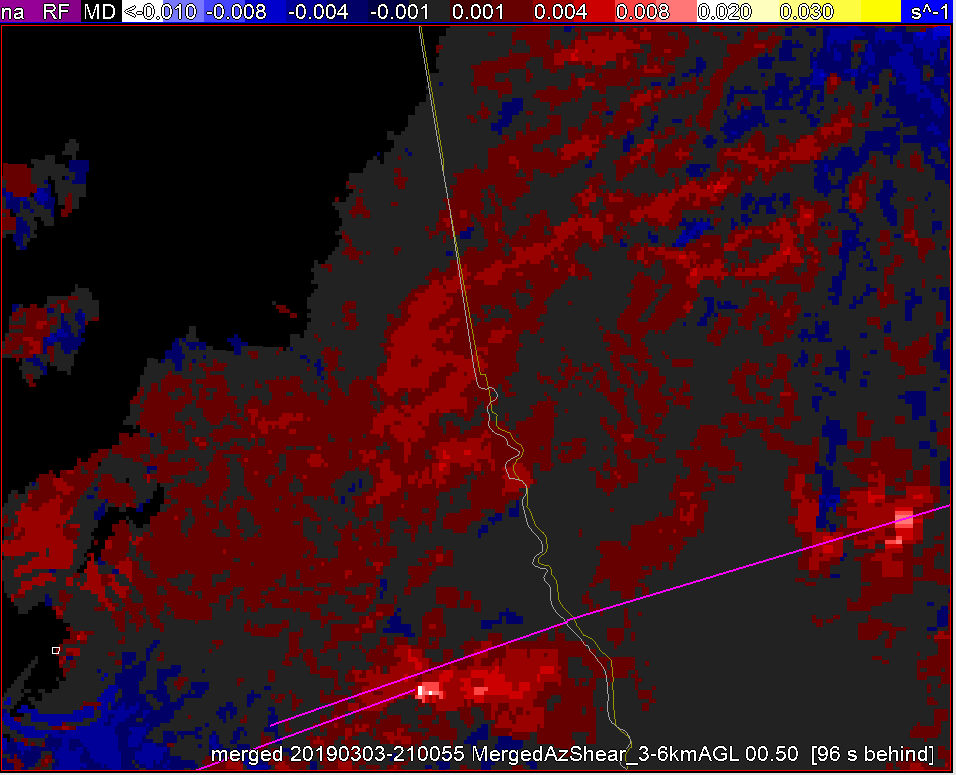
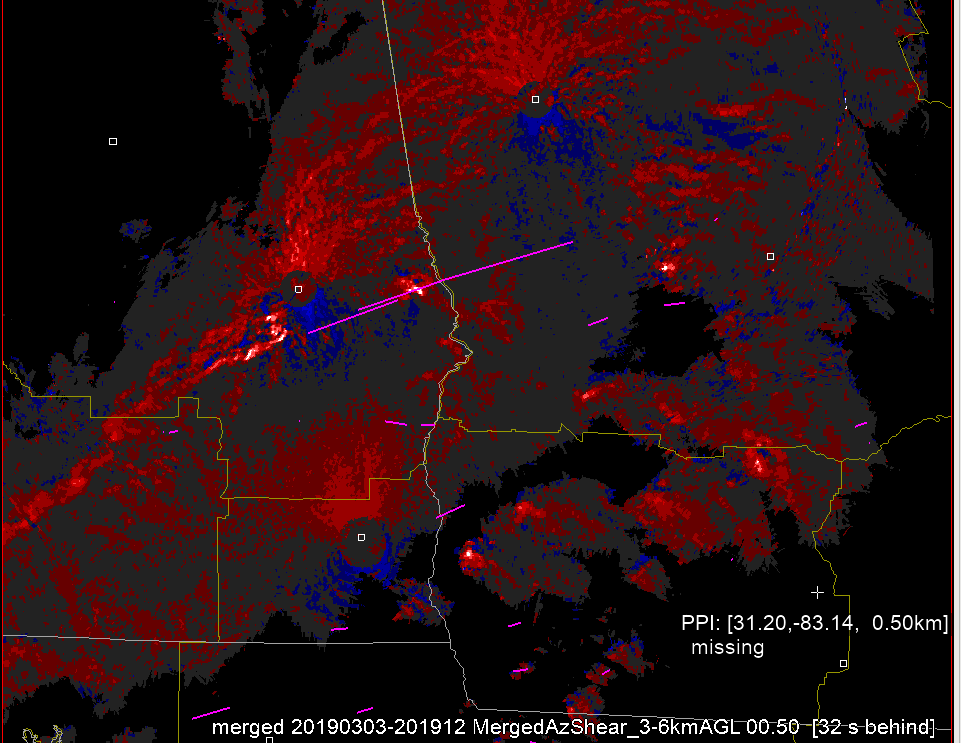
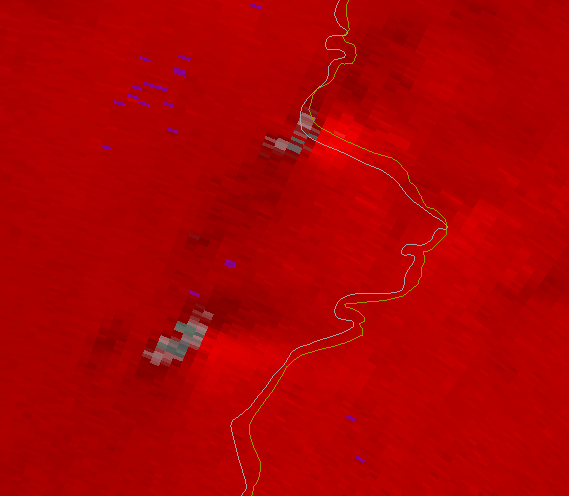
Looking at the 3-6km AzShear, the southern of the two breaks has a higher value aloft, but the northern one is more shallow.

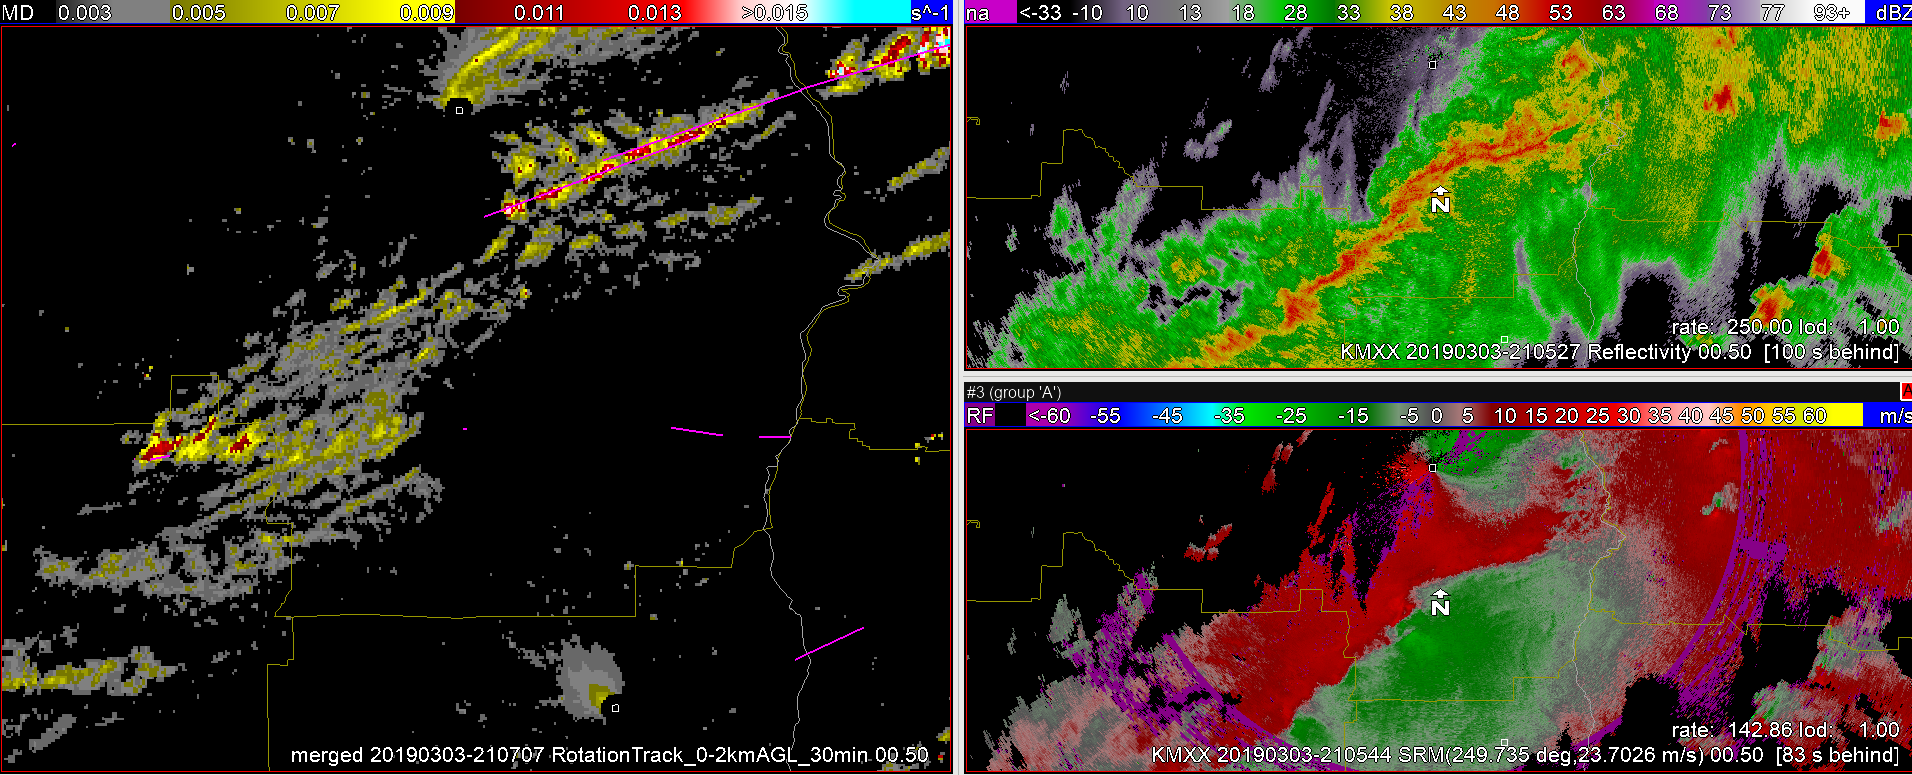
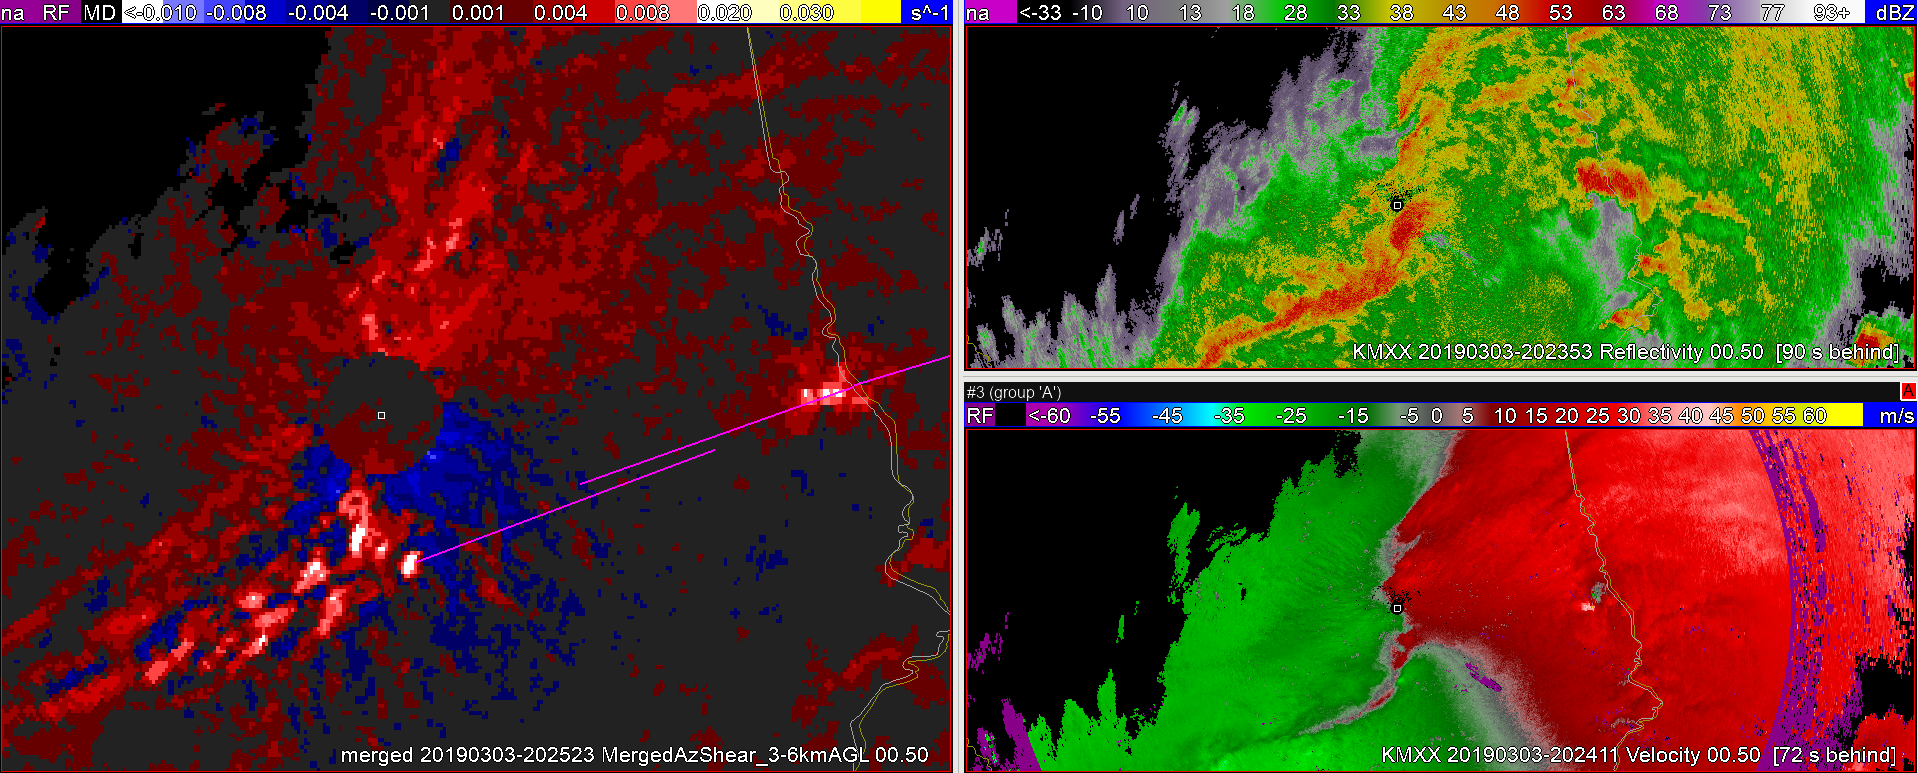
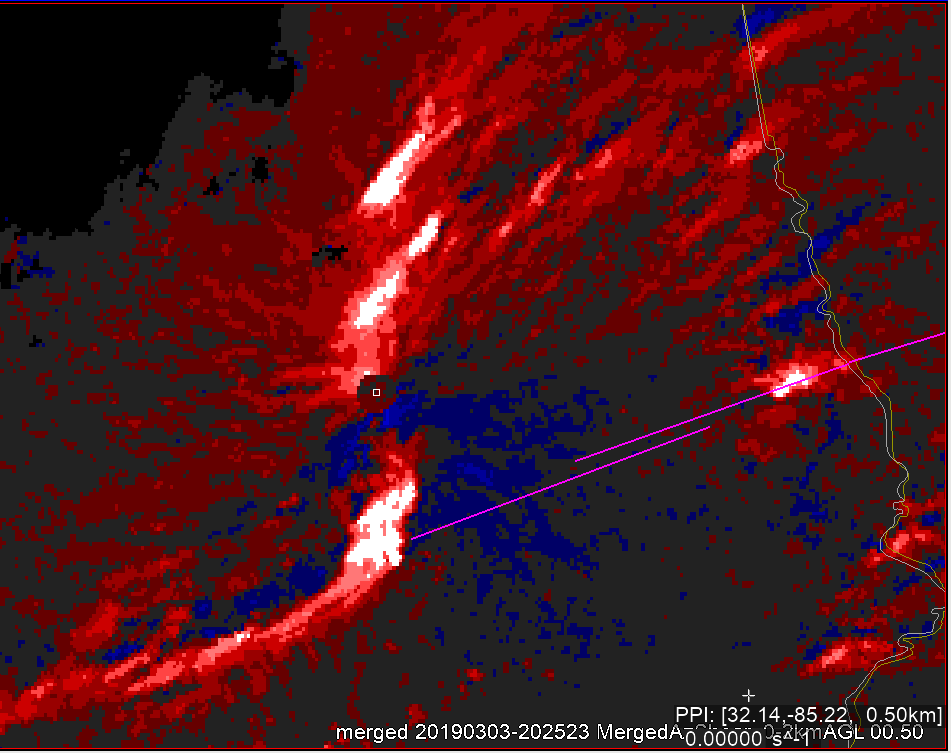
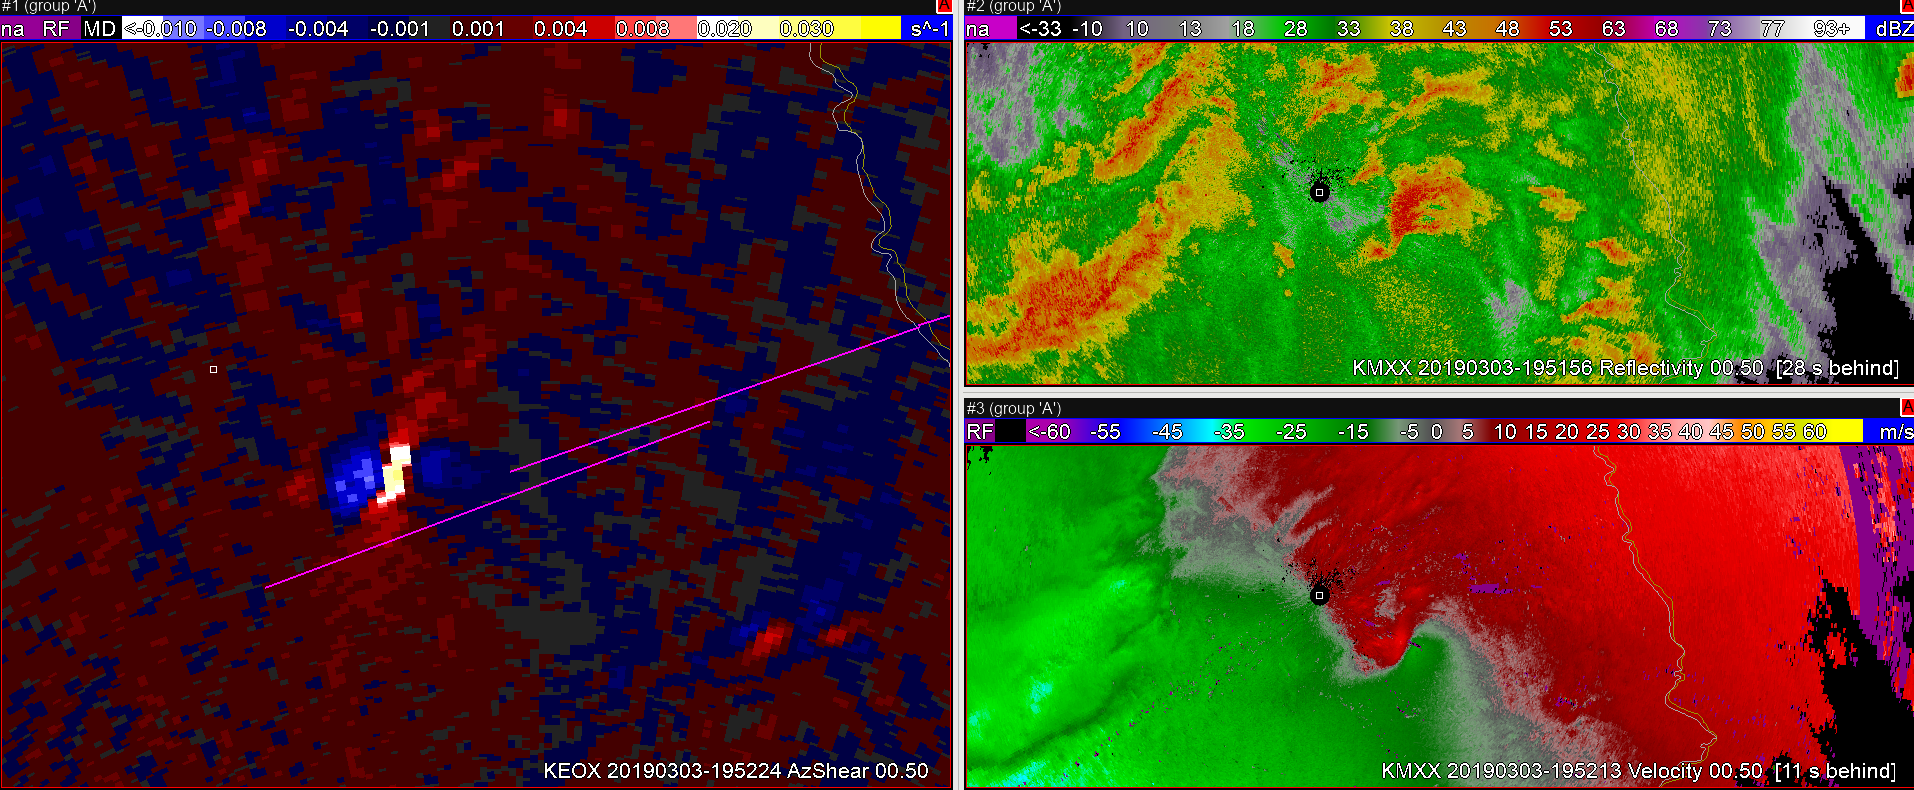
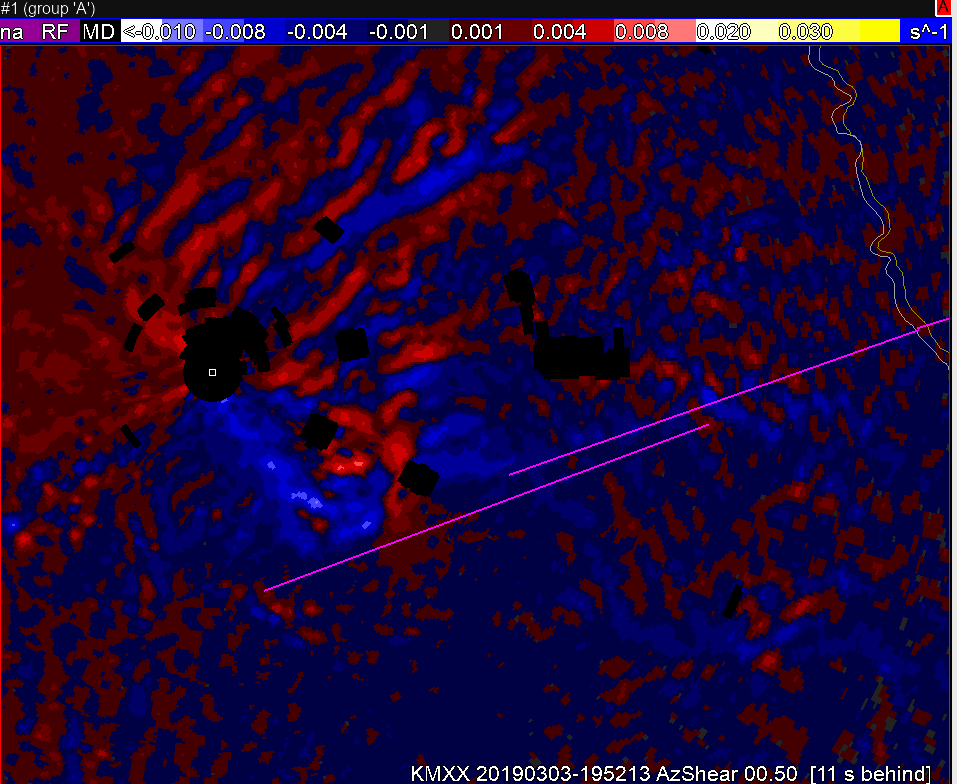
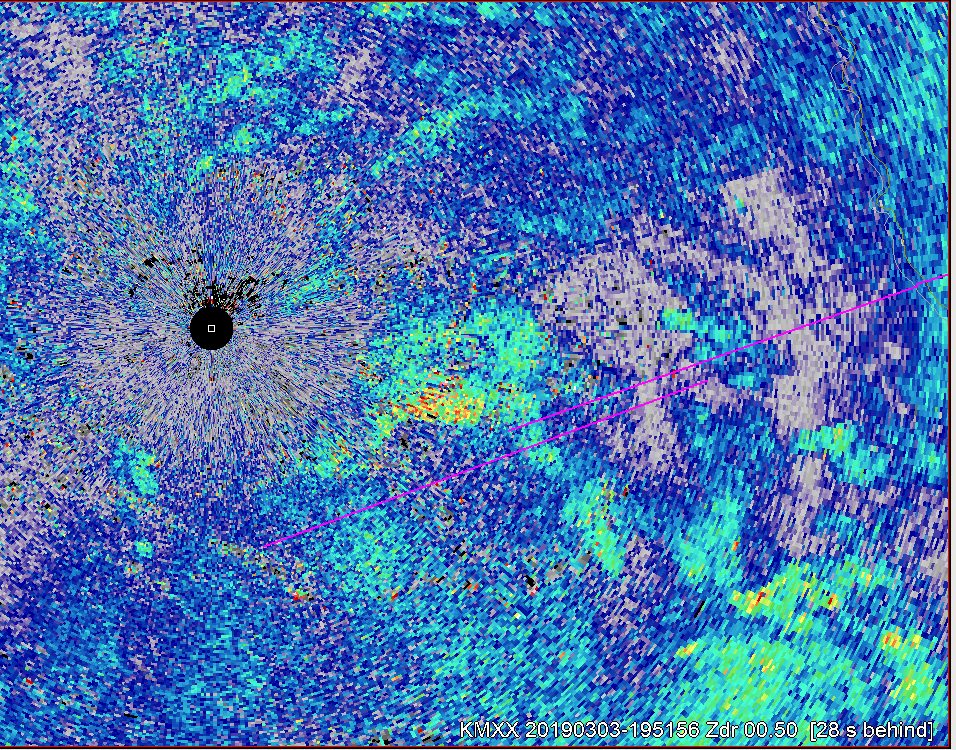
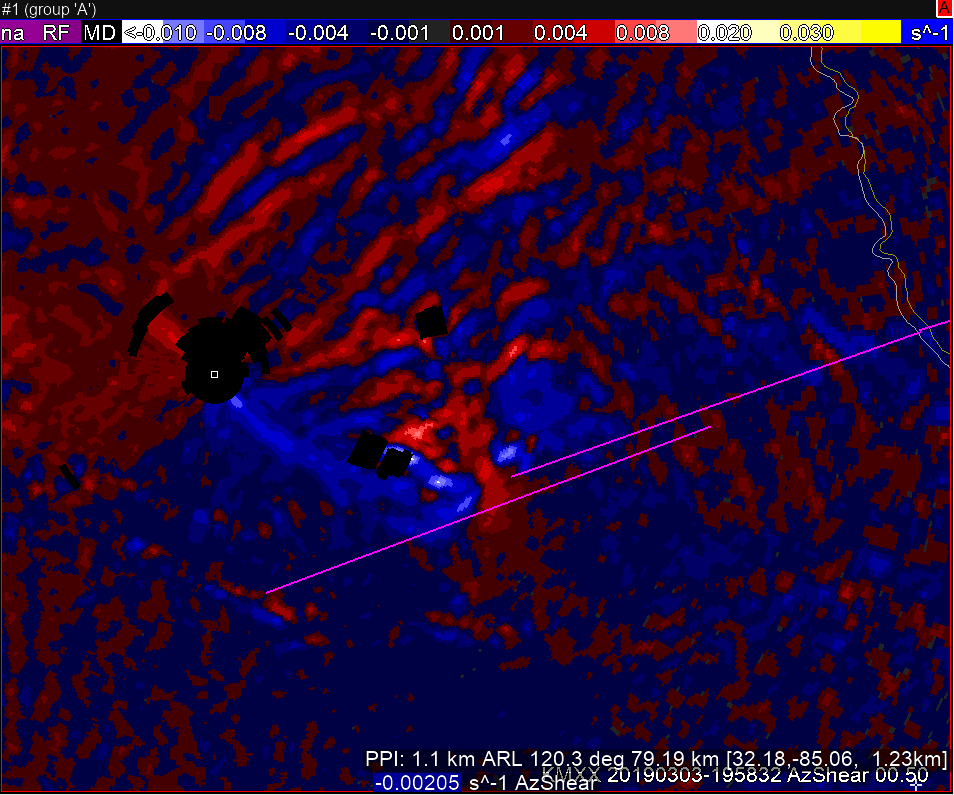
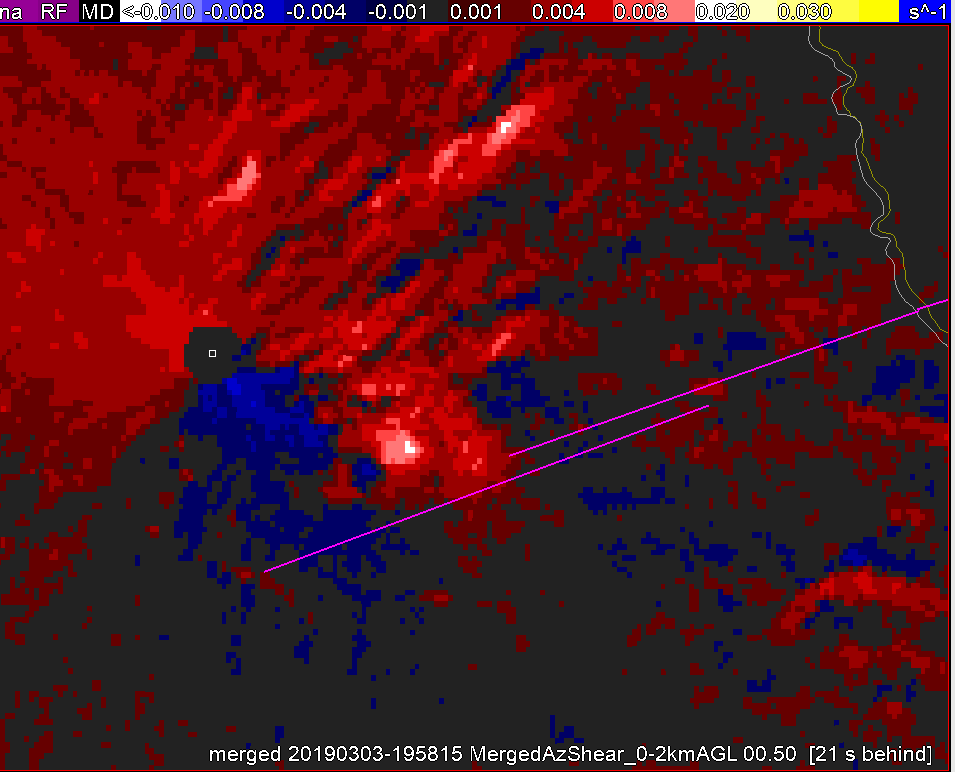
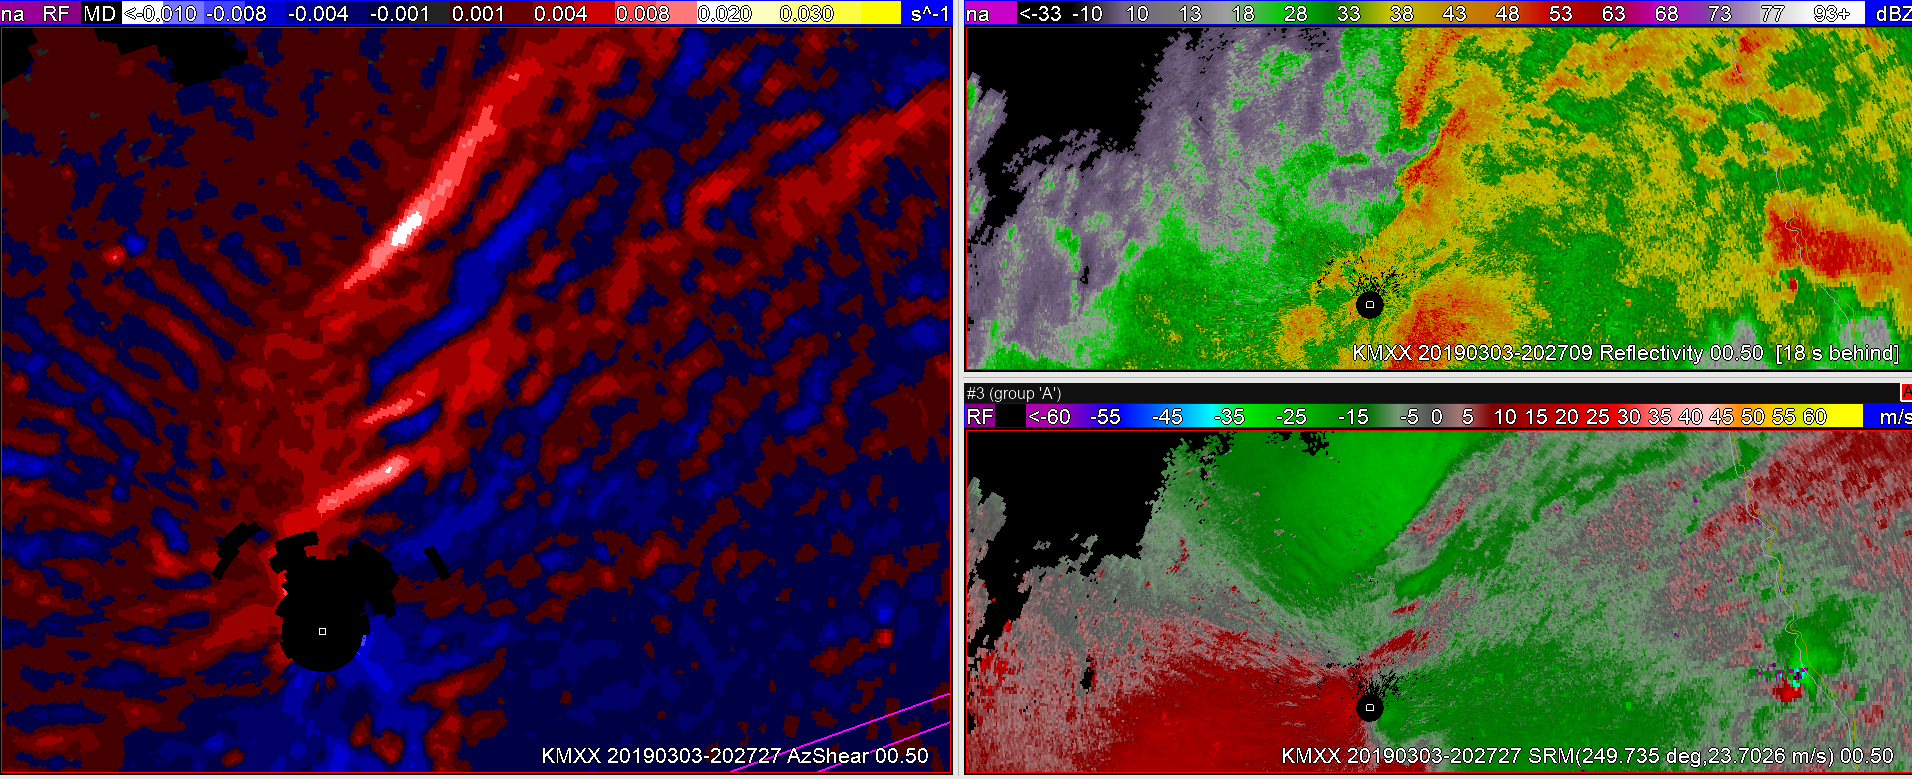
A few minutes later, the MXX 0.5 Tilt AzShear has a couple of maxima right in the reflectivity breaks mentioned earlier…and a little more in the way of couplets.  If I had a SVR out on this part of the line, I’d be tempted to upgrade to TOR possible, given my history with weaker EF0-1 tornadoes along a line of storms.

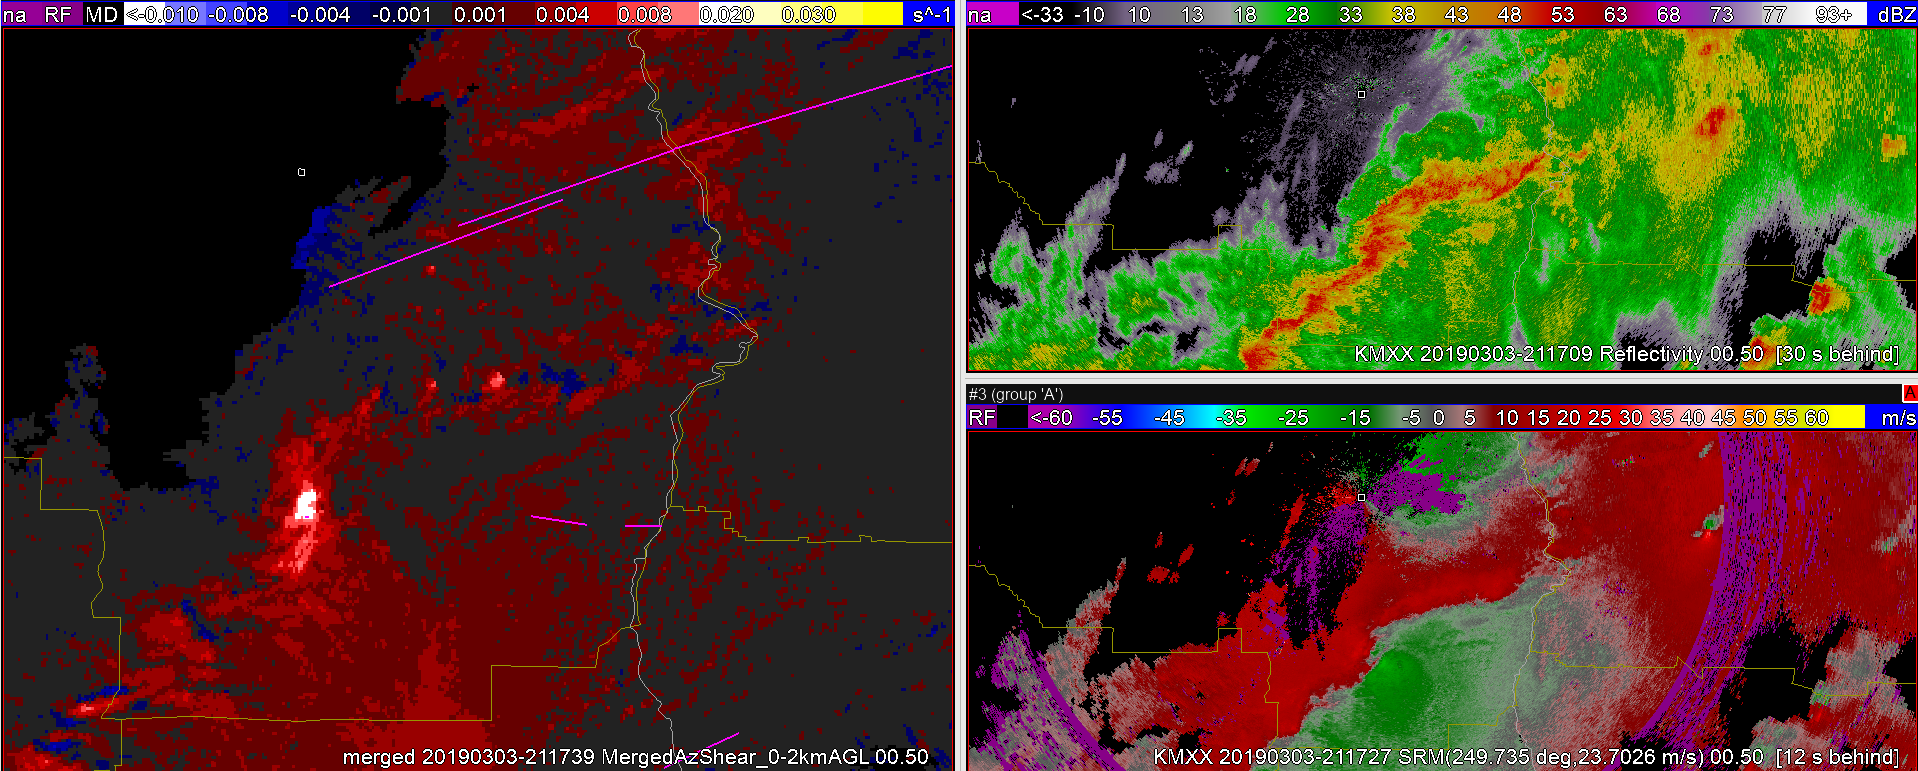
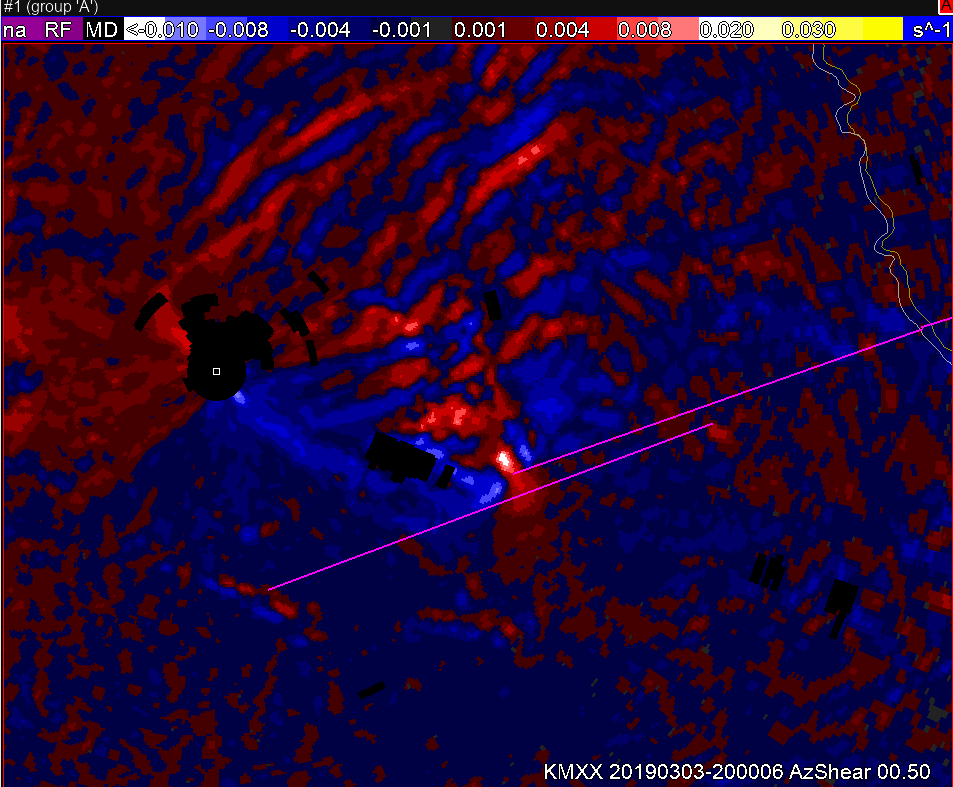
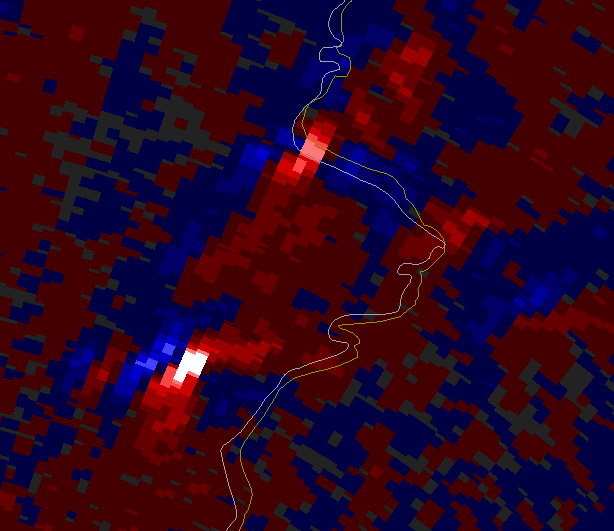
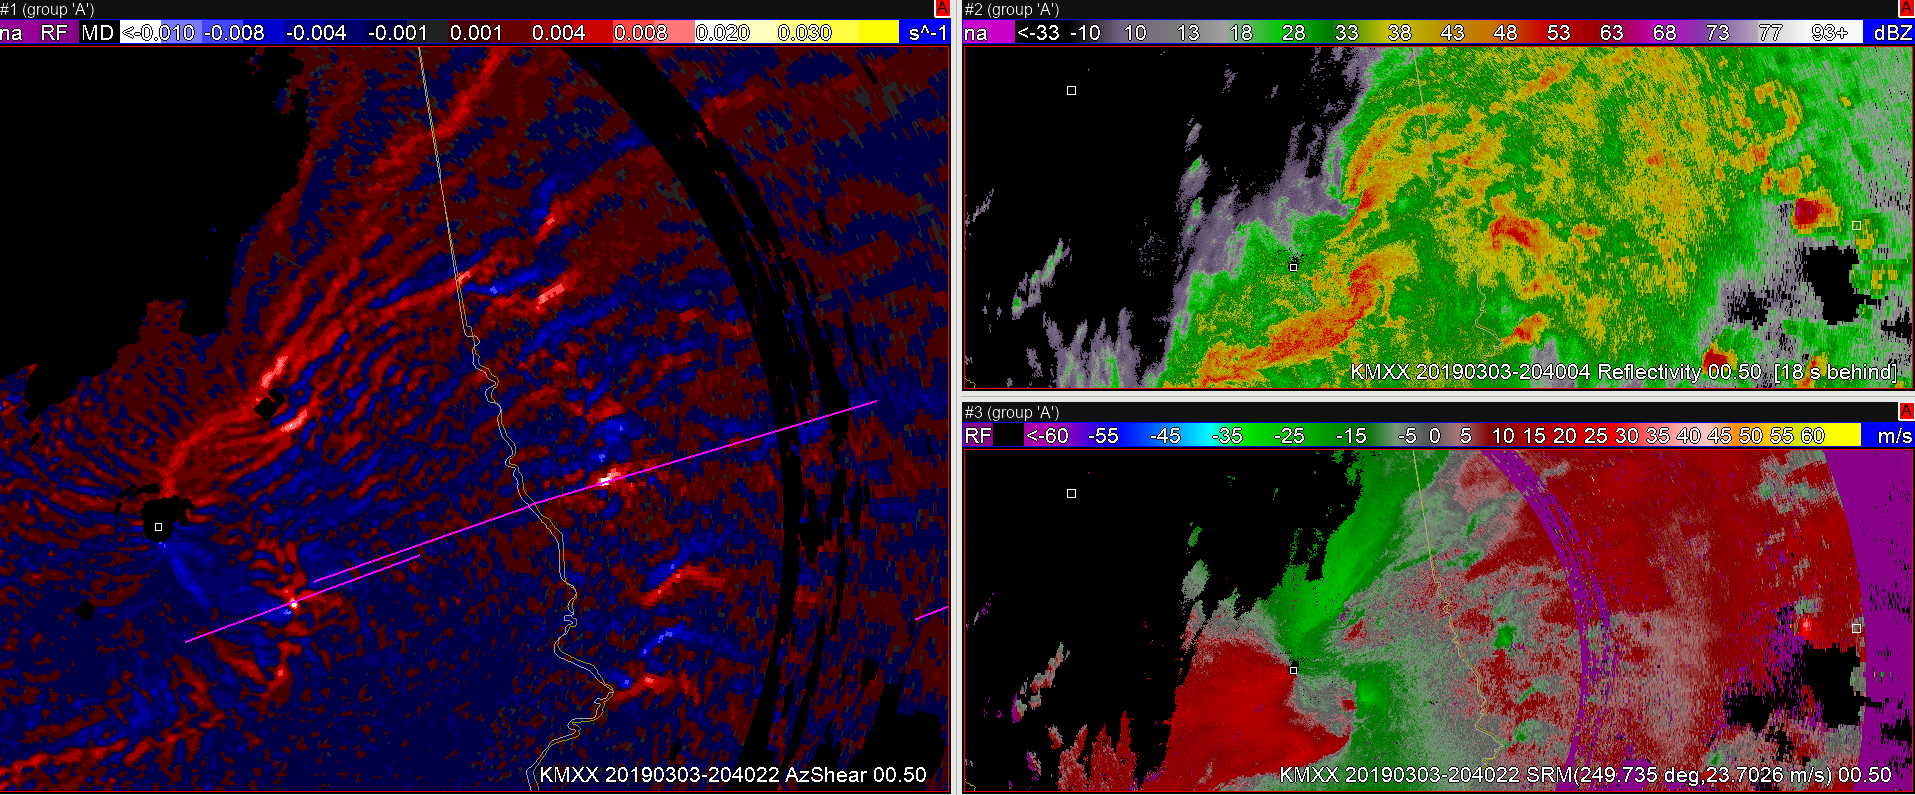
Again a few minutes later, the AzShear product maxima have weakened as well as the couplets on SRM.

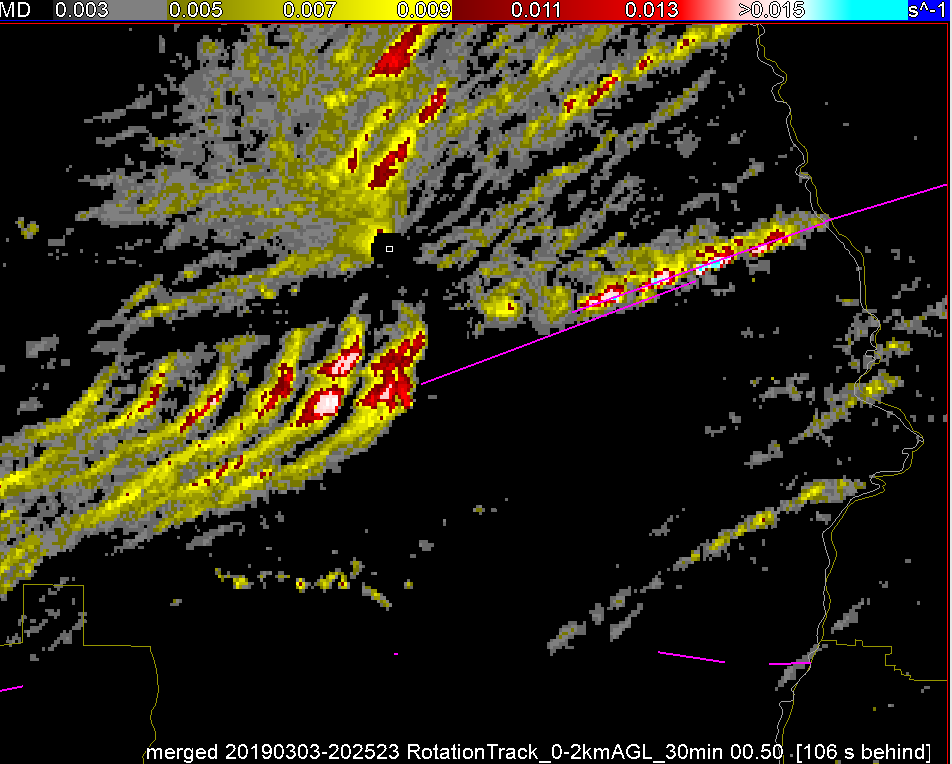
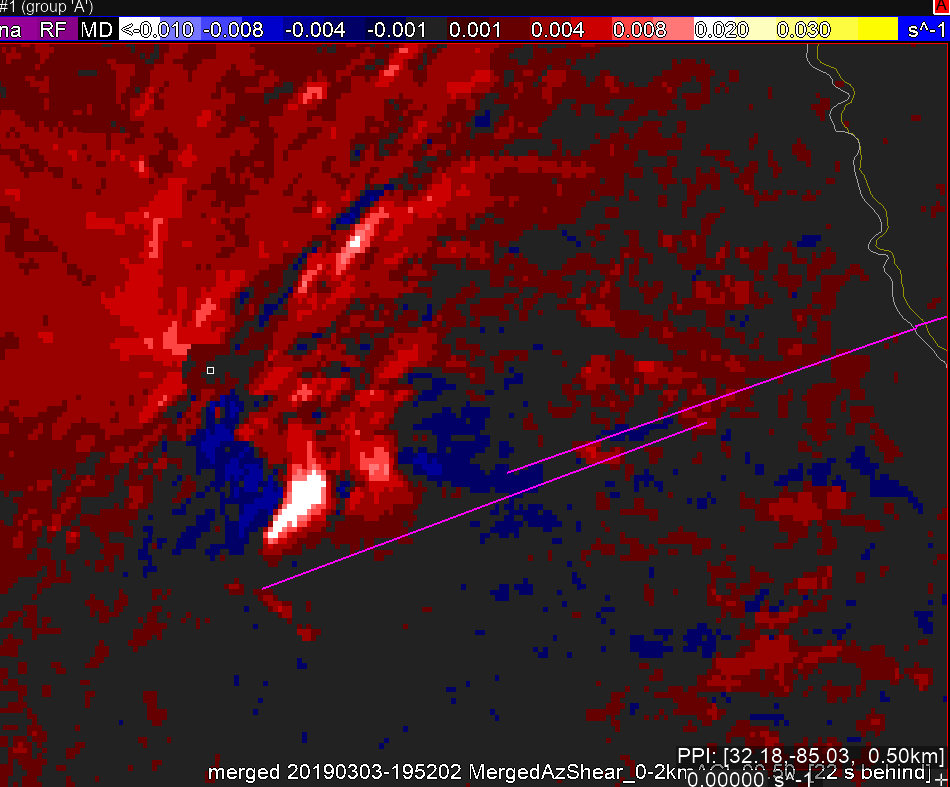
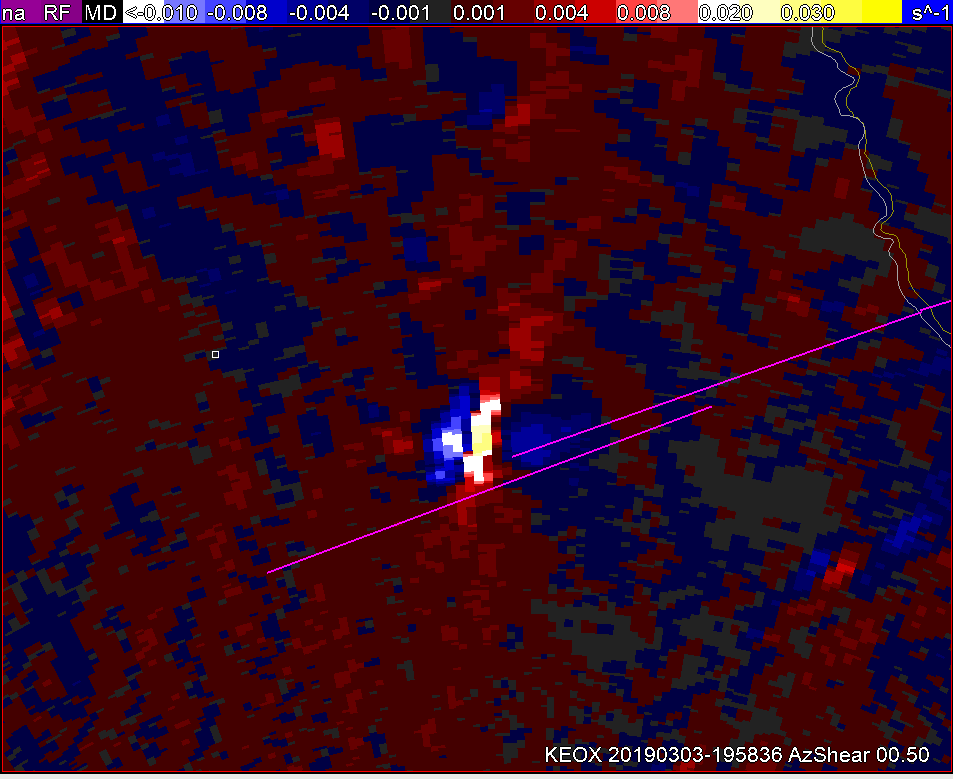
For analysis sake…I tend to like the Single Radar AzShear product over the merged products for low-level rotation…but did like the 3-6 km shear to see stronger cells rotating aloft.  Figure the latter would be sampled well by multiple radars across the region, whereas the 0-2 km region is better for a single radar.

Charley

Tags: None

AzShear Time Trends Better with Tornado 2

The MXX radar showed more of a ramp up ahead of the touchdown of tornado 2…evidenced in part from this MergedAzShear0_2km image.  The white color started showing up about 5 minutes ahead of touchdown for this cell.

Meanwhile, Tornado 1 keeps tracking along nicely, maintaining a pretty strong intensity, indicated by the Rotation Track map.

Charley

Tags: None

Developing smaller supercells

Meanwhile, south of the two tornado tracks, a couple of smaller supercells have developed.  They too show ZDR arcs, but AzShear is not as pronounced, either at the 0-2km or 3-6km ranges.  In addition couplets on SRM/Velocity are much less noticeable.


Charley

Tags: None

Time of Tornado 2

The 0-2km product still highlighted all three parts of the line, and reflectivity still shows the line breaks up north, but the velocity product itself is not showing much gate to gate tight mesos there, despite the higher AzShear numbers.

Charley

Tags: None

West of Tornado 1…several areas of interest…then more discrete cells to the southeast and east

The merged 0-2km AzShear product shows threat more areas of interest along a north/south line crossing MXX.  The southern one obviously is the strongest, but one just north of the radar and one farther north of the radar has reflectivity and velocity tags indicate some potential for tornadogenesis.  Reflectivity shows line breaks and a convergence zone at enough of an angle to the 0-3km shear vector to induce some stronger mesos.

The 3-6km shear vector focuses more on the southern one of those three.


Charley

Tags: None

ILX All_Layer CAPE Comparison

Taking a look at a quick comparison example of when the model fill-in of the All_Sky CAPE product may not be the best solution. In this example, an ongoing MCS was diving south through north central IL earlier this morning before it dissipated rapidly over the central part of the state. The GFS model struggled depicting the rapid de-escalation of said storms, and attempted to stabilize much of the ILX CWA in its wake. Unfortunately, this led to quite the gradient between areas where clouds prevented in-situ satellite observations to be utilized in the All_Sky CAPE product. Taking a look at the SPC Mesoanalysis (RAP) output in image 2 for comparison, the more accurate CAPE values across eastern IL should be closer to the 2500 – 3000 J/KG range while the ALL_Sky CAPE layer (Image 1) is showing 1000 – 1500 J/KG tops. A suggested best practice to overcome this discrepancy is to  include the AllSkyLAP Layer Cloud Type Image underneath any AllSkyLAP product so you can easily depict what is sensor derived and/or model output.

—————————————————————————————————Mountain Bone

Tags: None

AzShear EOX high ahead of TOR…other factors point toward downstream TOR

AzShear product for EOX, showing higher elevation rotation, was strong for this cell as it was getting organized.  MXX was lower, but the merged shear product picked up on the high value.

Other Dual Pol factors indicated the supercell was starting to get ready to drop a TOR…with ZDR arc forming on the MXX radar.

A few minutes later, the MXX AzShear on the base tilt still didn’t show the high values until right at tornado time.

Then at time of touchdown, it showed a better max in the lowest tilt.

The merged 0-2km Azshear product then cycled down after that max, despite continued higher values from the EOX radar…in fact the trend was getting stronger from that radar, with peak values near 0.03 at touchdown time.  Sampling indicated the AzShear on the base tilt was at 1.7-1.8 km AGL at this time, so I would think it still would factor into the 0-2km AzShear product.

Charley

Tags: None

Attempting to determine which weaker circulation is stronger

EOX radar depicted two distinct weaker circulations from circulations near the AL/GA border.  Both storms had similar presentation on reflectivity and at a broad glance, the relative strength of the circulations were similar.  The single radar azimuthal shear depicted that the southern circulation was stronger.  One remaining question though is whether the southern circulation was stronger based on proximity to the radar.

Tags: None