
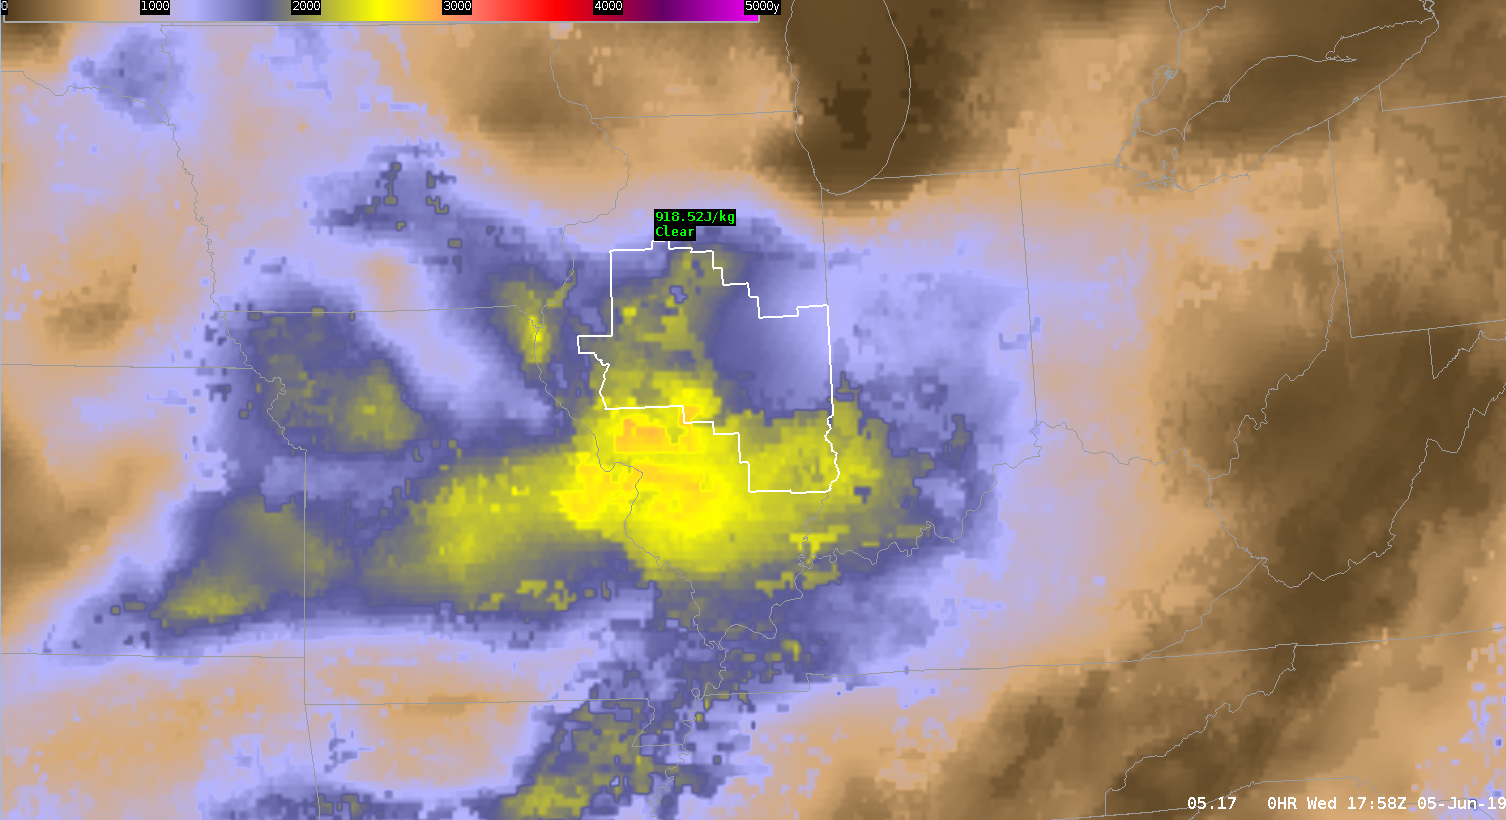
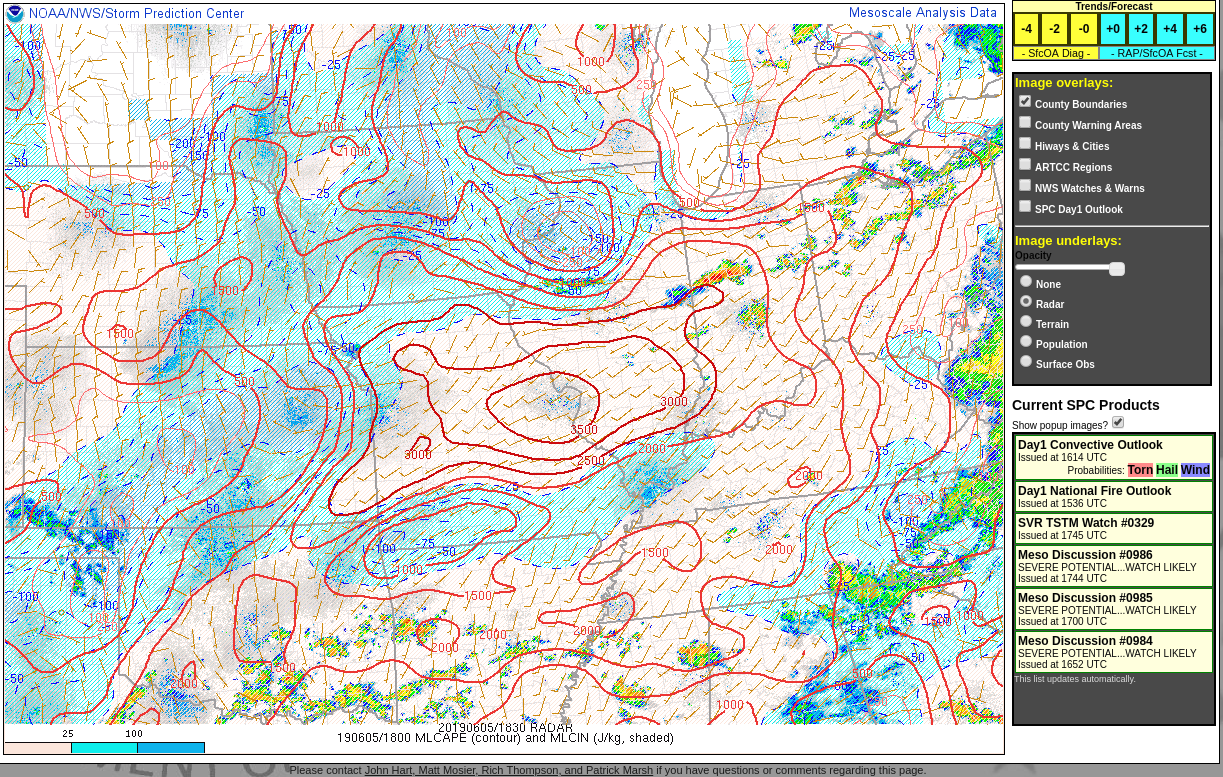
Taking a look at a quick comparison example of when the model fill-in of the All_Sky CAPE product may not be the best solution. In this example, an ongoing MCS was diving south through north central IL earlier this morning before it dissipated rapidly over the central part of the state. The GFS model struggled depicting the rapid de-escalation of said storms, and attempted to stabilize much of the ILX CWA in its wake. Unfortunately, this led to quite the gradient between areas where clouds prevented in-situ satellite observations to be utilized in the All_Sky CAPE product. Taking a look at the SPC Mesoanalysis (RAP) output in image 2 for comparison, the more accurate CAPE values across eastern IL should be closer to the 2500 – 3000 J/KG range while the ALL_Sky CAPE layer (Image 1) is showing 1000 – 1500 J/KG tops. A suggested best practice to overcome this discrepancy is to include the AllSkyLAP Layer Cloud Type Image underneath any AllSkyLAP product so you can easily depict what is sensor derived and/or model output.
—————————————————————————————————Mountain Bone