Interesting high prob NTDA Case along bowing segment

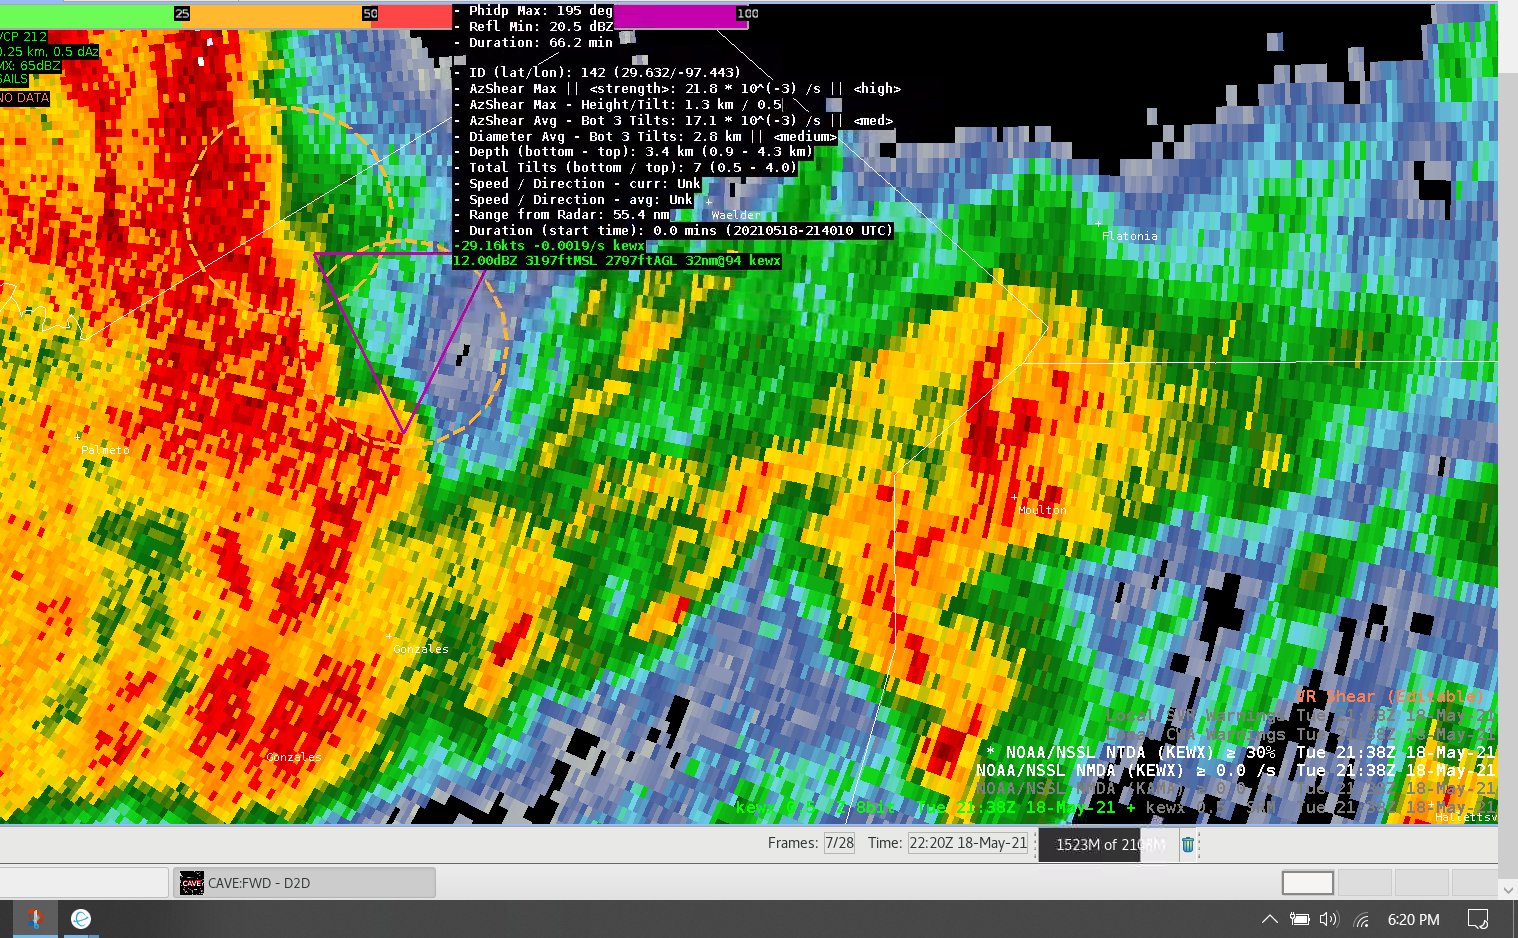
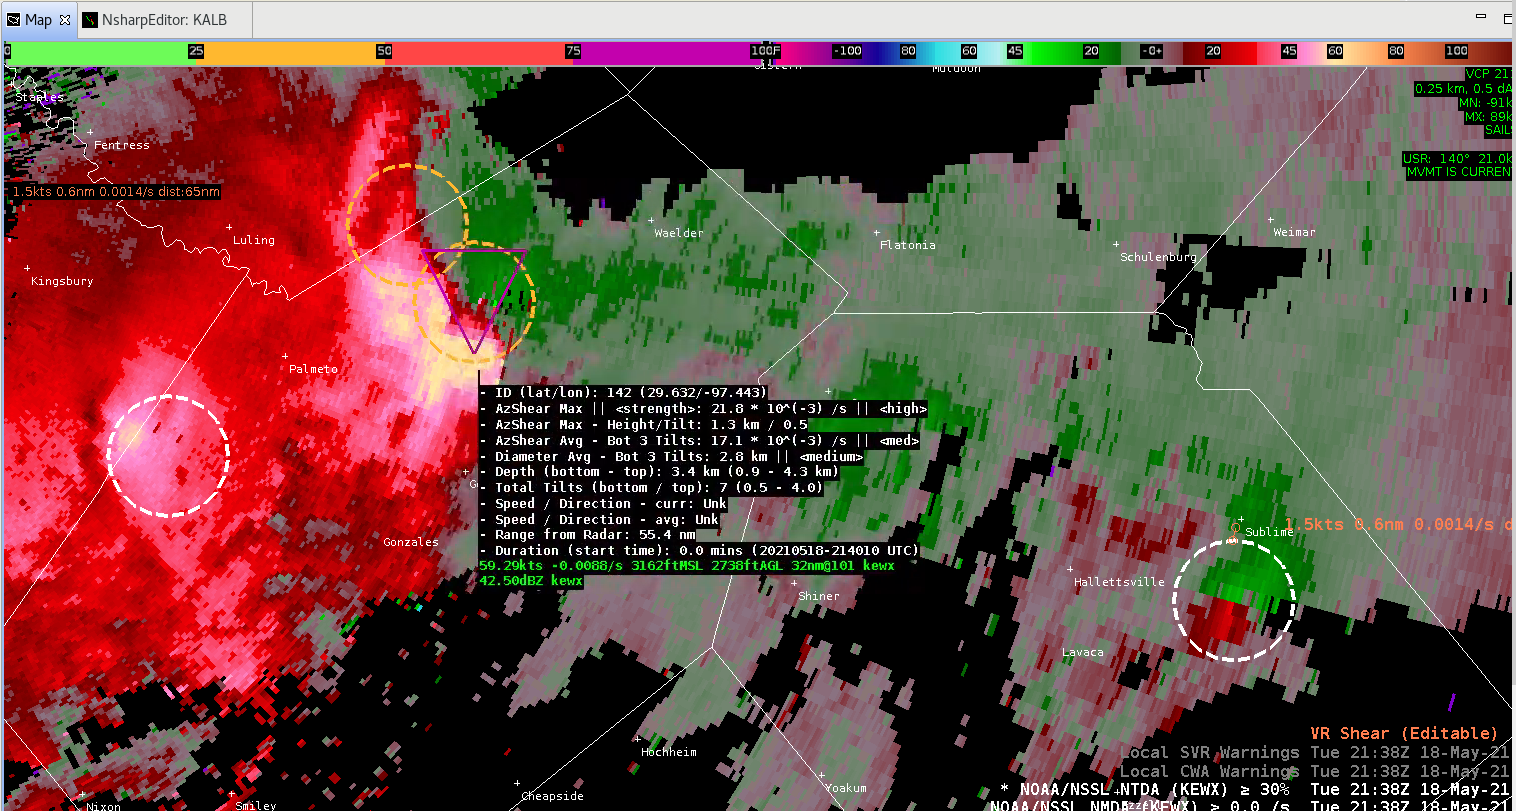
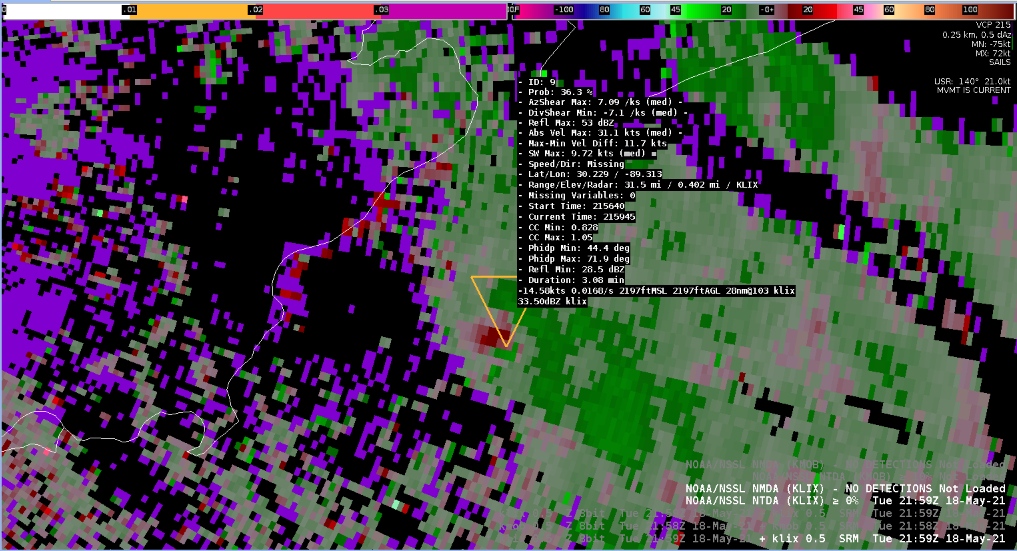
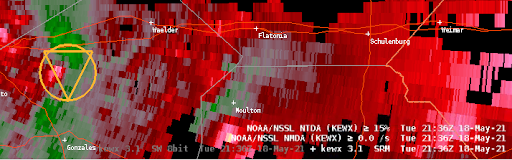
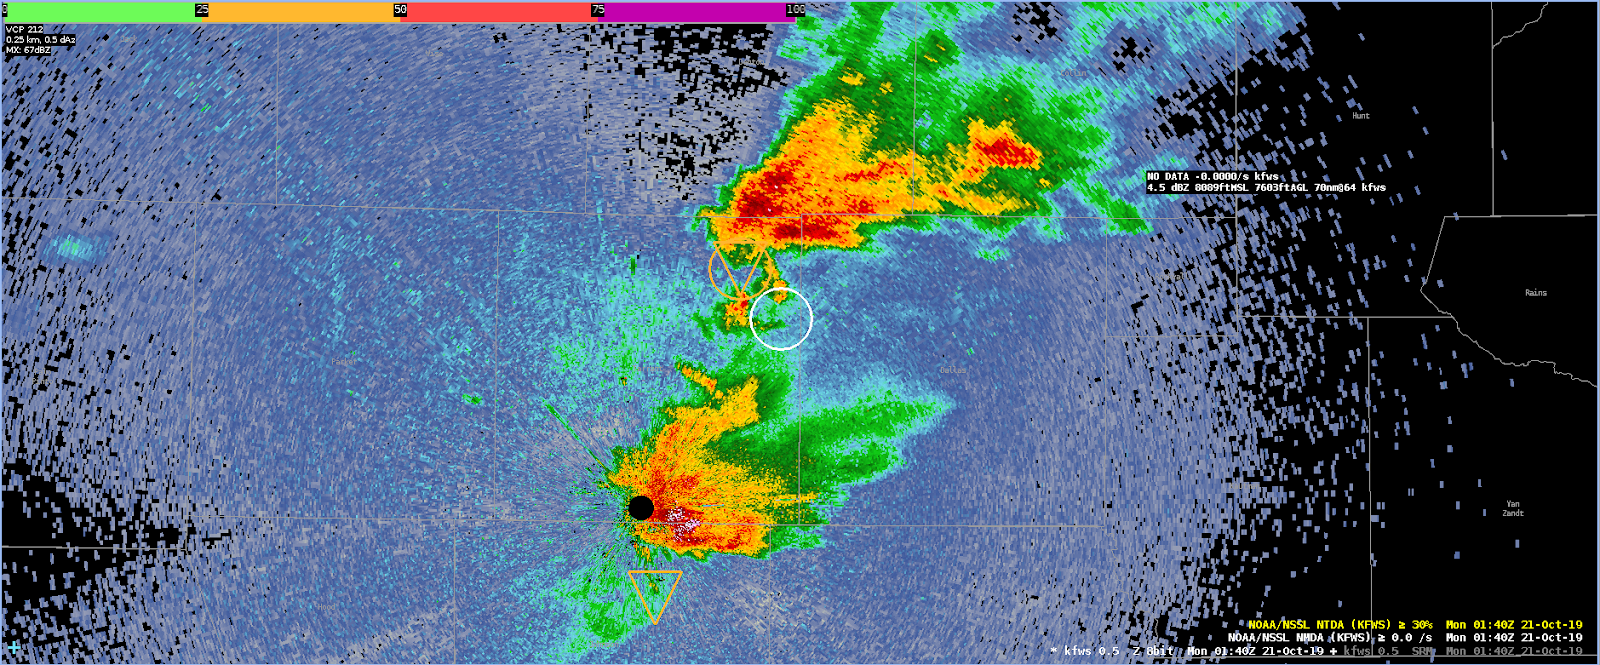
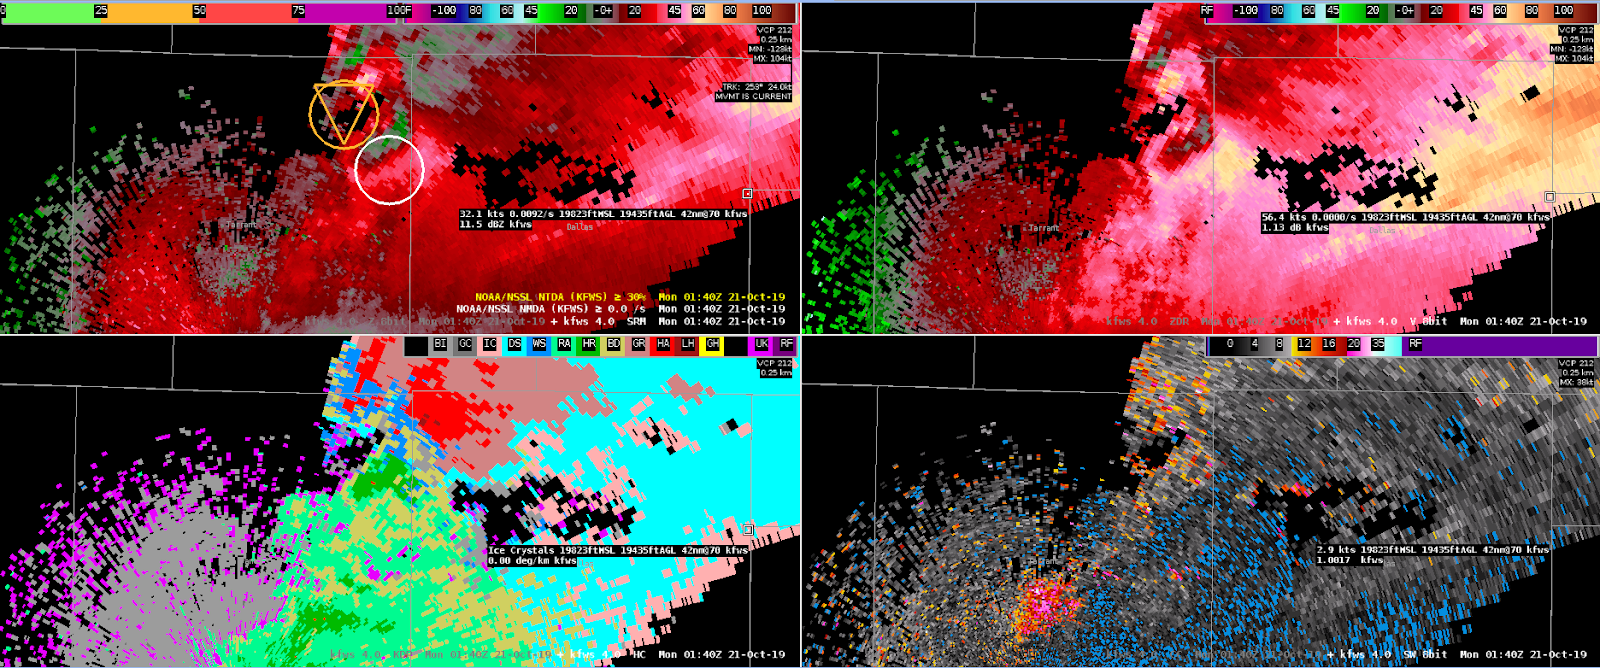
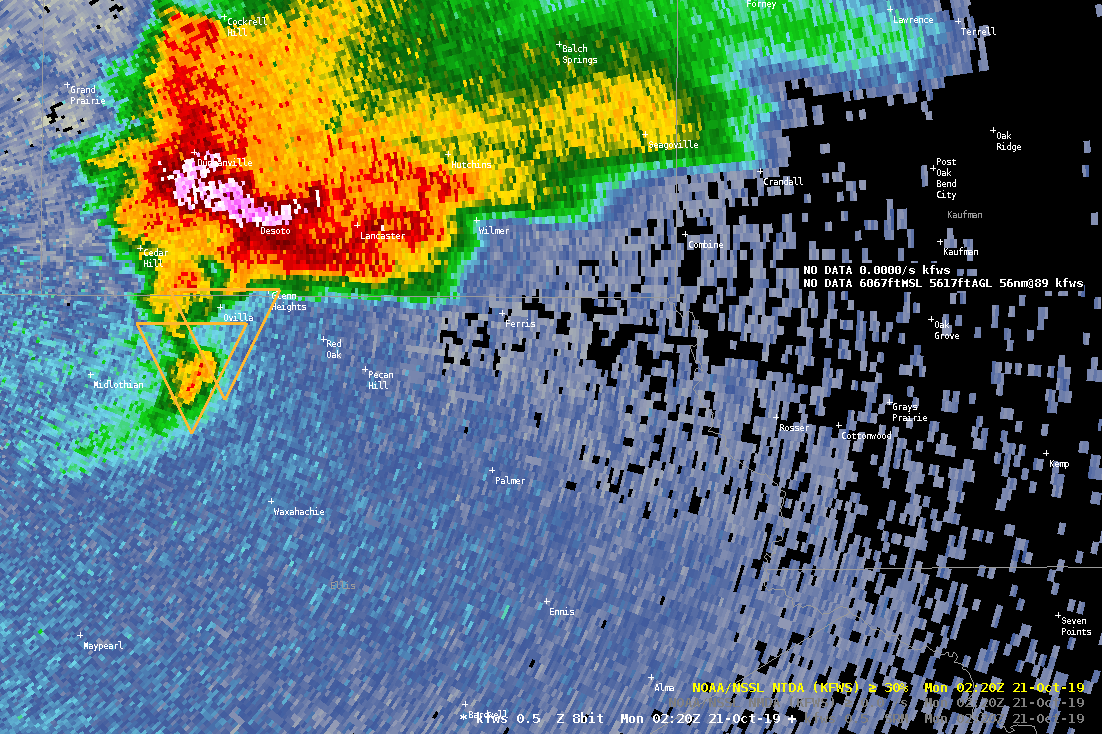
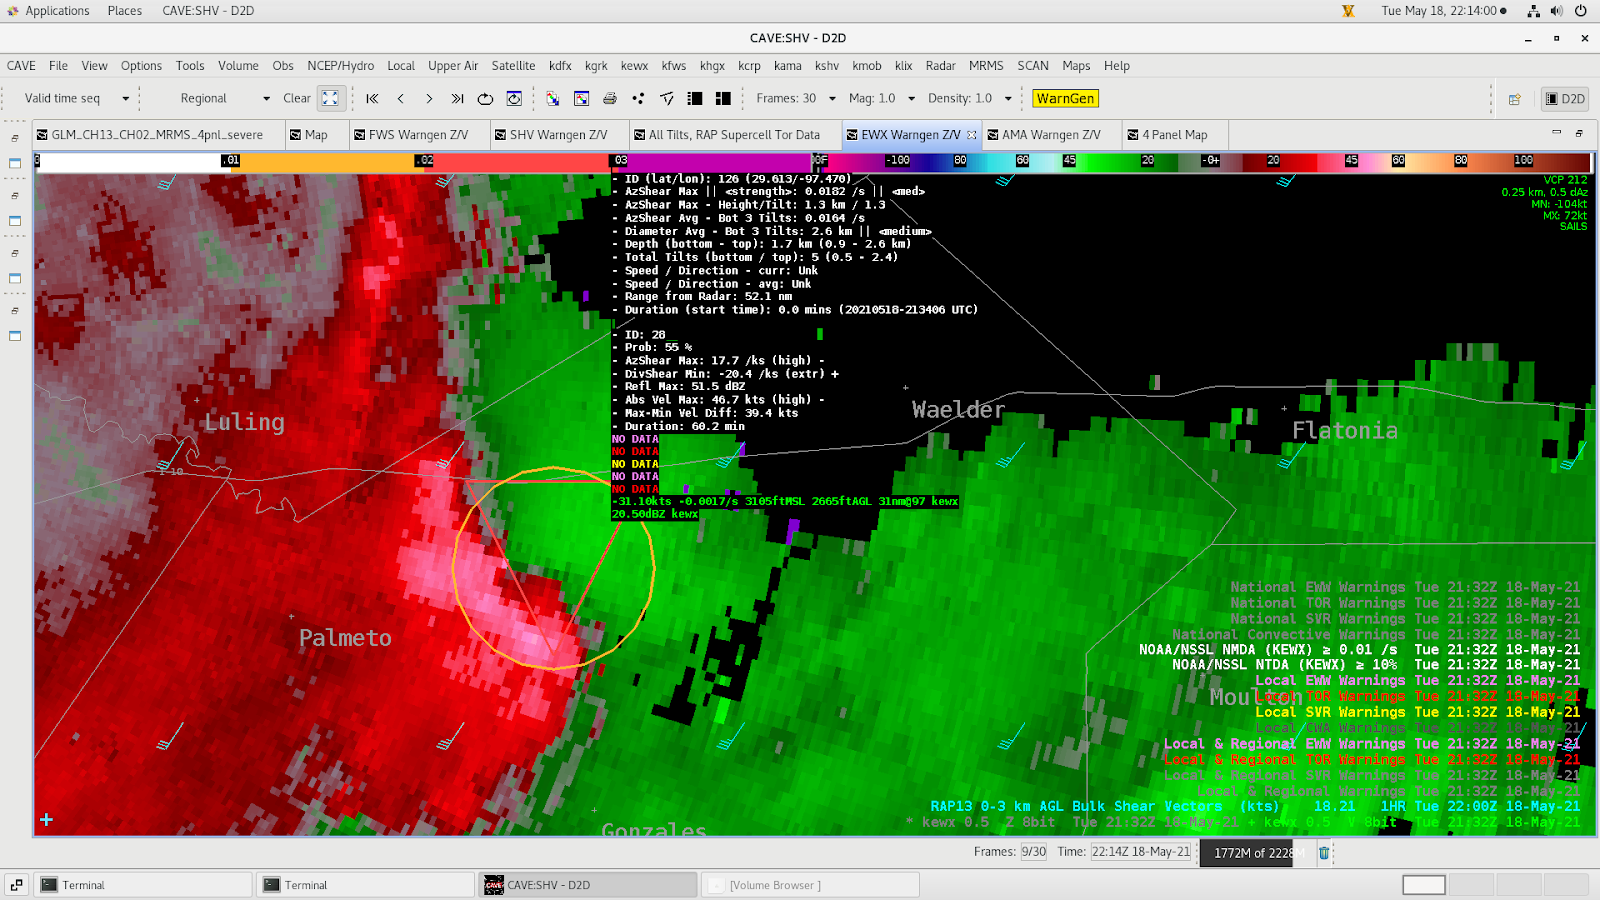
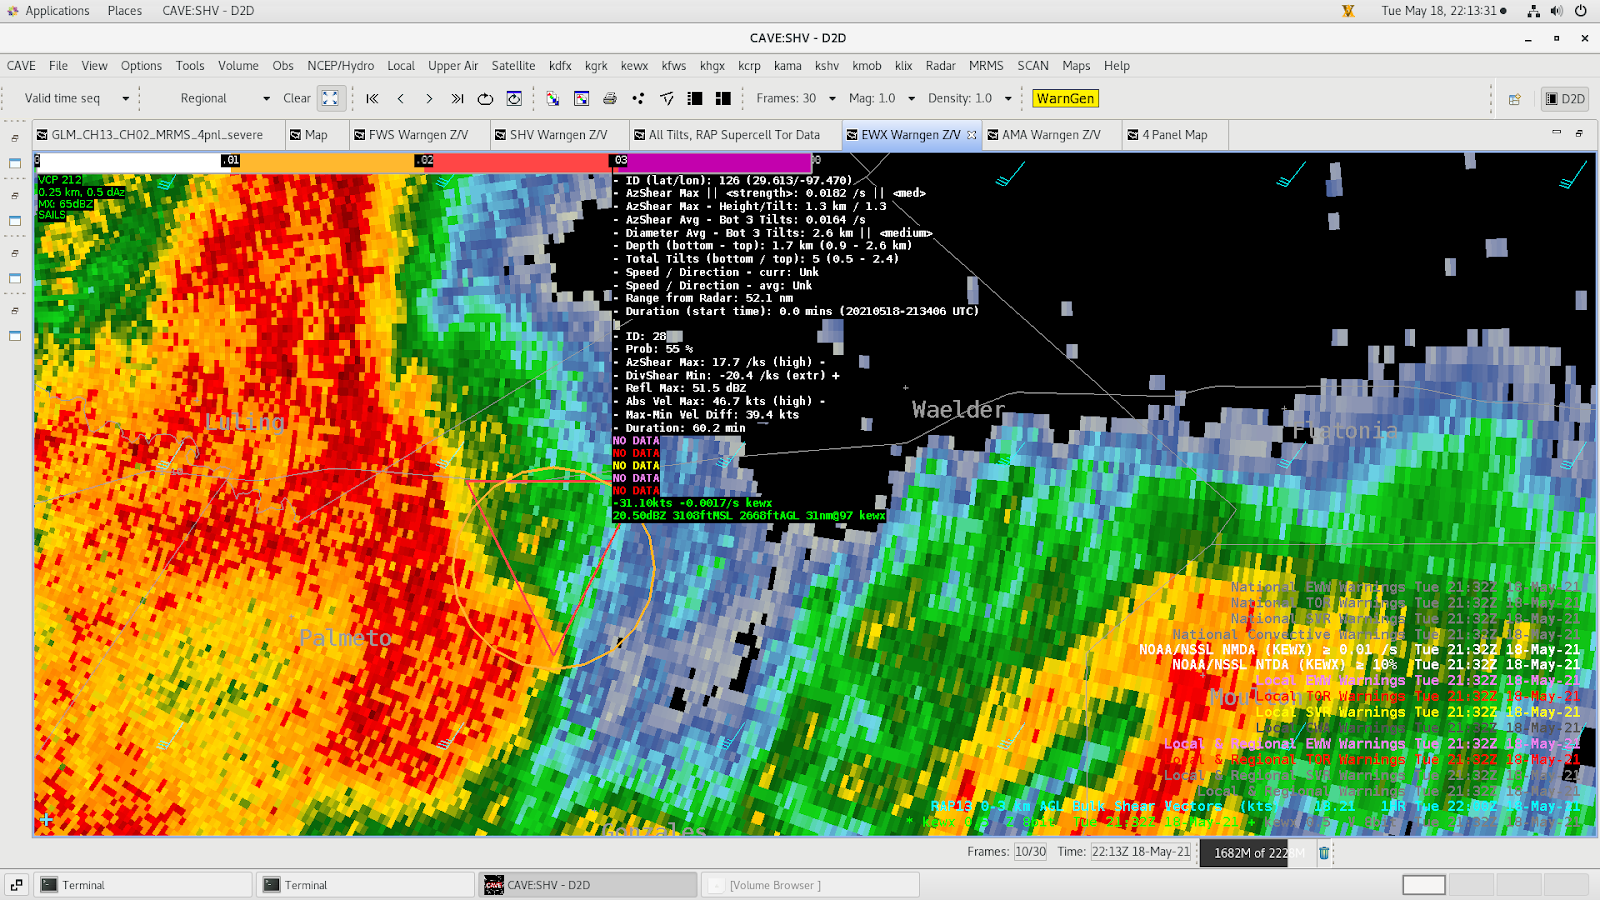
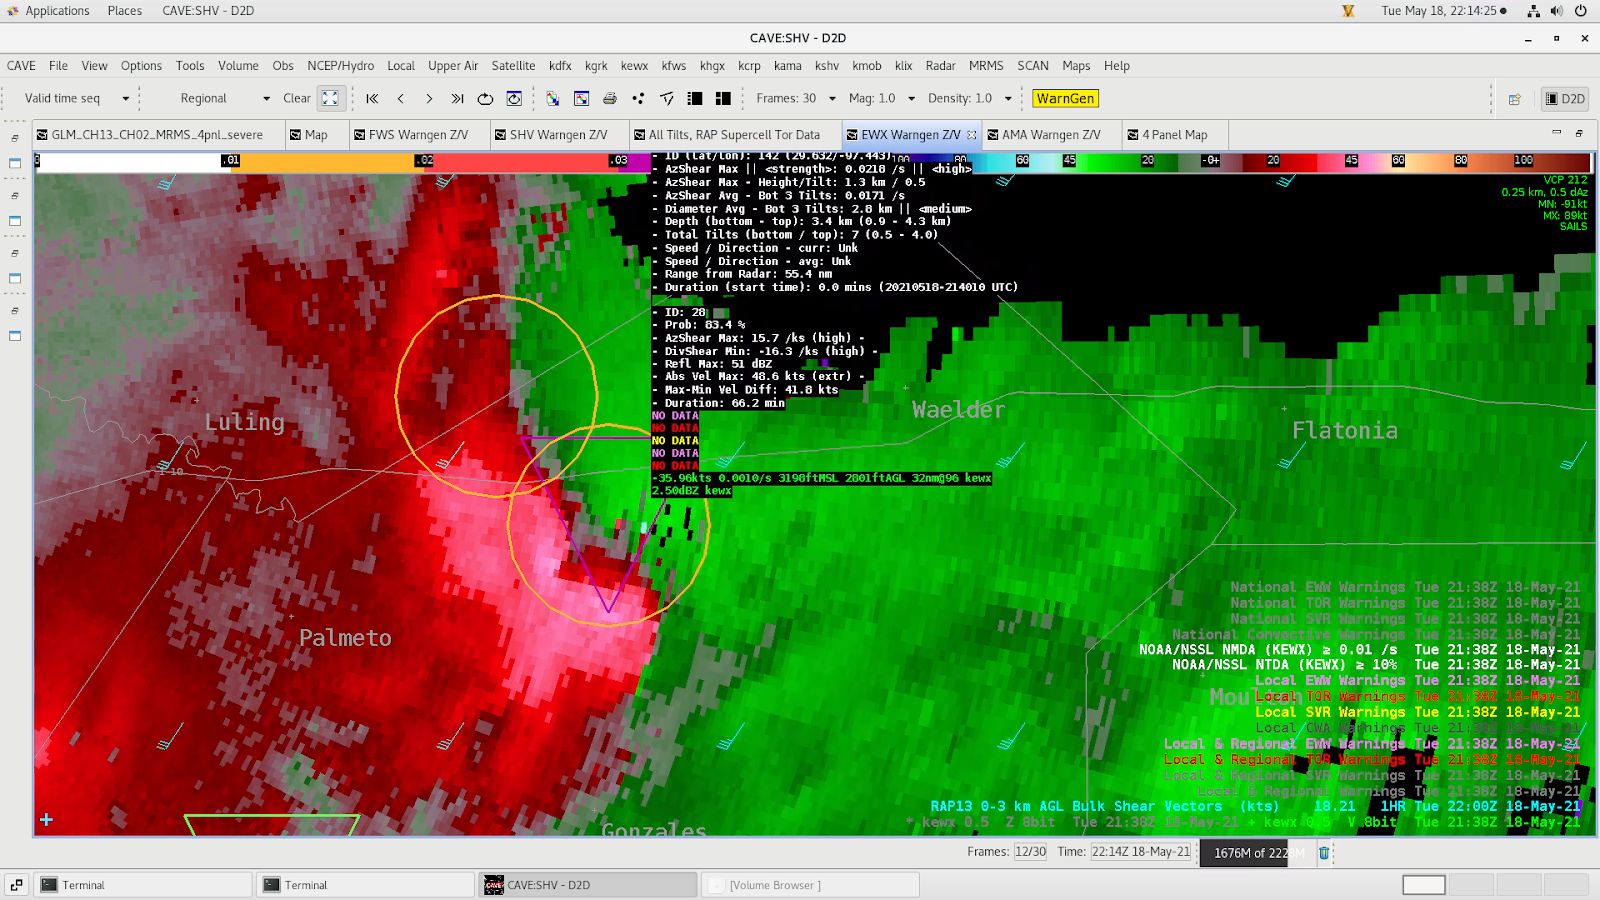
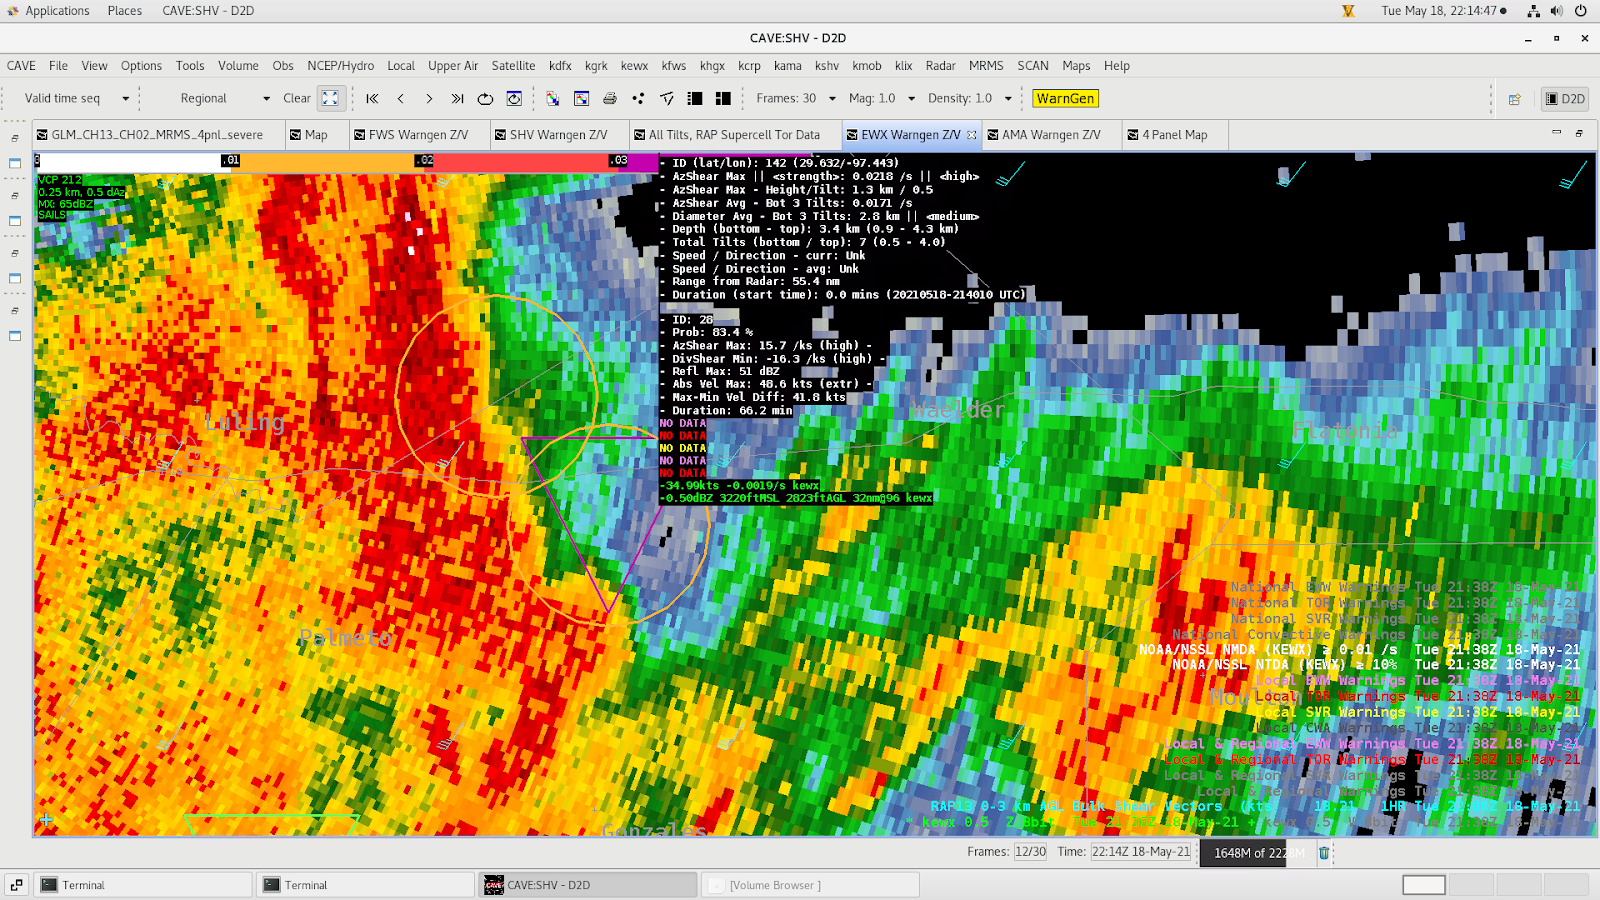
A convective complex near the EWX radar developed into a more linear system as it moved east of the RDA. Several low end NTDA detections were made along the line, generally where there were kinks in the velocity field. One detection did end up showing high probabilities of over 80% just north of Gonzales, Texas. This occurred on the northern end of a localized surge in the line. The NTDA peaked at  84% at 21:38Z and again at 82% at 21:42. There was broad rotation in both instances but not a particularly tight couplet. The center of the NTDA detection was over the inflow region of the storm. I’m not sure if this was a tracking issue or maybe I’m misunderstanding the way the polygon is placed . The NMDA showed an azShear Max of 0.0218 /s at 21:38Z but the AzShear Avg never rose above the 0.02 threshold. The NMDA and NTDA were occasionally not co-located.

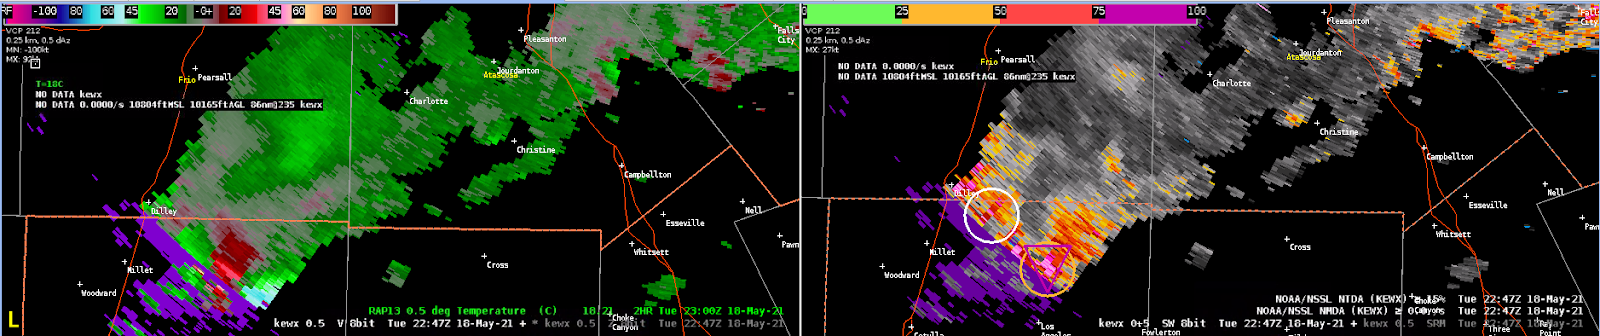
I’ve overlaid 0-3km bulk shear vectors from the RAP on the screenshots below. The shear direction is nearly parallel to the line before the surge occurred which would not be favorable for tornadogenesis by the three ingredients method. Though there were other ingredients/nudgers that would support tornadic development.

Base Velocity at 21:32Z NTDA Prob at 55%
Base Reflectivity at 21:32Z NTDA Prob at 55%
Base Velocity at 21:38Z NTDA Prob at 83.4%
Base Reflectivity at 21:38Z NTDA Prob at 83.4%

– Gerry Bertier

Tuesday – KEWX Circulation

2138 UTC 18 May 2021 KEWX

KEWX radar was definitely the most active in the mid afternoon on Tuesday.  A QLCS segment formed along or just north of the city with initially multiple circulations along the line with 6 weak to modest NMDA circulations along the line. One circulation looked like a mesovortex on the leading edge along the line (Fig. 1).  The NTDA percentage shot up to 83-84%.  The NMDA was in the medium range with a “high” as AzShear max.  The total tilts from the bottom to top was 0.5-4.0 DEG (7 tilts).   It was at a decent range from the radar at 55 nm.  It definitely looked like a SVR was needed with a tornado tag.  I would have been tempted to issue aTOR.  A consistent time continuity of the MESO would have increased my confidence despite the “High” tornado probability.  The couplet was dominated by outbound velocities based on the SRM data (velocities > 60 kts).  It was nice that the NMDA and NTDA values were co-located. Also notice with the outflow a new cell fires (Fig. 2)  in the second image (SRM velocity data).  The circulation was narrow, compact and gate-gate in terms of the couplet velocities that the WFO KEWX office issued a TOR on that cell.

Fig. 1: 2138 UTC 18 May 2021 KEWX 0.5 DEG Base REF (dBZ) with NMDA and NTDA data overlayed.
Fig. 2: 2138 UTC 18 May 2021 KEWX 0.5 DEG SRM (Kts) with NMDA and NTDA data overlayed.

– Yoda777

Small but Mighty: Shallow Rotating Marine Cell and NTDA

Was great to see the NTDA in action for marine areas! One particular shallow area of cells was approaching coastal Mississippi within the Mississippi Sound (generally south of Bay Saint Louis to Gulfport, MS. While some minor adjustments were necessary to allow NTDA to display for such weak rotational couplets (dropping NTDA probabilities down to around 10% was helpful in this specific case), there was rather consistent tracking with one small area of rotation.

KLIX 0.5 SRM (user defined SMV of 140º @ 21kt) at 2159Z 5/18/21.

Definitely small, but mighty. These small areas of rotation not rooted to a deeper mesocyclone can easily drop weak waterspouts in tropical environments (characterized by deep moisture and very low LCL heights on average). It was nice to see NTDA tracking this cell much more consistently than anticipated, with occasional peaks of higher probability reaching as high as 36.3% (as pictured above). A Special Marine Warning went in effect around this time to mention the potential for waterspouts as this cell neared land, but dissipated before making landfall. A great example at where NTDA can easily act as a warning nudger in low-end rotational velocity cases.

– Dusty Davis

Only as Good as the Velocity Data

KEWX – 22:47

Good example to watch the quality of the velocity data…as it could lead to unrealistically high NMDA and NTDA.

Note the very high SW values in lower left hand corner. NTDA probs were near 87% with max/min velocity diff of 51kt. Granted this signature was nearly 100mi from the radar, with the center of the beam nearly 10K ft AGL…so probably not using this for warning decision…but it was still a good reminder for me to QC the velocity data and ask myself “does this make sense”.

-Beltzer

NMDA Depth – Should it be higher?

KEWX – 21:36

Noticed the NMDA was detecting a meso, but only on the lowest 3 tilts (tough to see on screenshot, but lists the 0.5-1.3 tilts)

It looks like it could’ve gone up to at least the 3.1 tilt:

Thought it might be a lag, but even 30 min later it was still only showing lowest three tilts being used. Also thought maybe it was being filtered out due to low Z, but Z was actually higher with height. Interesting situation as to why NMDA wasn’t using higher tilts, even though base velocity suggested suggested it should be.

– Beltzer

Lower Calculated Probability in Higher Confidence Scenario

This was an interesting find during the Archived Case from ILN. Focus was on western portions of Indiana/eastern Ohio at several areas of rotation associated with a multicellular cluster of convection. A tool commonly used to interrogate a potentially tornadic storm’s rotational velocity is the VRshear tool. This tool calculates the Vrot, line distance (end of points), shear (in ms-1) and distance from the RDA. WDTD mentions from their Impact Based Warnings Guidance of around 30kt of rotational velocity being the initial supercell tornado warning threshold. Of course, this has some gray area but is generally expressed as an approximation.

At 0207Z from KILN, a cell was identified to show increasing cyclonic rotation. Vrot was calculated to be at 37kt estimated. NDTA probabilities began relatively low at 21.48% which at this early indication, a warning would have already been required. The next scan at 0208Z showed an increase of Vrot to 38kt, with NTDA probability increasing to 24.85%. One more minute followed at 0209Z showed an obvious increase in Vrot at 44.7kt with NTDA Probability of 32.41%.

KILN 0.5º BR at 0207Z. Distance from RDA: 55nm.
KILN 0.5º BR at 0208Z. Distance from RDA: 55nm.
KILN 0.5º BR at 0208Z. Distance from RDA: 54nm.

This is one of several examples where lowering the current default threshold of 30% was necessary. While tracking of both NMDA and NDTA was very accurate, I was surprised at the lower probabilities. A few calculated parameters were identified to be a potential hindrance at a higher probabilistic value, including high SW (and trending higher) and AzShear Max value actually showing a temporary lowering trend at 0207Z. An interesting situation where having to lower the probabilistic threshold was necessary, and was a bit lower than what was expected but still showed consistency with tracking.

– Dusty Davis

Example of High NTDA Prob in Low Confidence Case

In this case the NTDA was able to detect strong azShear in a messy reflectivity signature. It was difficult to detect any reflectivity signatures with a cell that was approaching New Madison due to a cell merger. There was also evidence that the cell was weakening from 1:30 Z to 2:00Z. Cloud tops were warming on IR, the reflectivity core was falling and lightning count and VII were also much lower at 1:45Z than 1:30Z. But the NTDA picked up on a quickly strengthening velocity couplet. The 0.5° beam was also about 5kft agl which lowered forecaster confidence in a tornado warning.

At 1:55Z NTDA probs were at 20% and quickly strengthened to around 50% at 2Z then peaked out at 84% at 202Z. Looking at the velocity data at 201Z I may have assumed that there was a daliasing issue since there was such a rapid increase in the outbound velocities at 0.5°. Had I not already had a warning in place from when the storm was stronger I’m not sure I would have issued one for this couplet. But we had an LSR at 205Z near New Madison with a tornado possible tag. The NTDA was very useful to pick up on this signature when most of the other data showed the storm weakening overall and the reflectivity was not very helpful.

There were two other interesting features of the NTDA for this case. At 202Z the azShear, divShear and Abs Velocity max were all decreasing from the previous scan but the probability actually went up from 72% to 84%. Another interesting thing was how quickly the probability decreased after the peak of 84%. 2 min after the peak, the prob dropped to 3.3%. I was not expecting to see probability drop this rapidly. Albeit the velocity signature was much weaker.

0205 Z
BUILDING AT OHIO 121 AND 72 WITH DOOR BLOWN OFF. DAMAGE POSSIBLY CAUSED BY A TORNADO | Darke County | Near New Madison

– Gerry Bertier

NMDA aids in detecting 1” hail :20 before occurrence

In the archived ILN event, a LSR of 1-inch hail piqued my interest and I wanted to see how the NMDA product handled it.  I used the ILN WSR-88D and the storm at that time was 66NM NW of the Radar. The NMDA product was consistent for the 20 minutes prior to the storm report and I would have felt confident using the product (along with interrogating other base products) to effectively warn/issue Severe TS for this storm.

Wayne County, IN storm producing 1” hail

-AFWXLIFER

NTDA Threshold vs QC Suppression

A variety of non-meteorological returns seem to trigger the NTDA. In the attached image there are 3 NTDA icons within ~25 miles from the RDA. All have “Prob” values less than 30%. There were other examples from earlier in the day where bad radials and elevated roadways caused detections. All of these were also less than 30% prob. So I can see why the default threshold for the NTDA is >= 30%. I was assuming that the probability from the NTDA represents the actual probability of a tornado occurring based on the training cases. To me I would want the NTDA to pick up on anything that would be even a slight potential for a tornado. That way I could use it as SA or a first alert. I would be concerned if the NTDA was predicting a 22.7% probability of a tornado, like in the screen capture below. That to me means similar detections from the training cases produced a tornado about 1 out of 5 times. To see a non-meteorological return produce that high of values would lower my confidence in real returns. Rather than setting the threshold at >=30% I think that filtering out the bad detections  would make me trust the NTDA more.

Three NDTA detections from near the KLBB radar on non-meteorological returns.

– Gerry Bertier

Tags: None

Mon Archived Case Blog

0140Z – Nice Heads Up on New Updraft

The NMDA gave me a nice heads up to the new updraft that was forming on SE flank and already showing signs of rotation. At first I thought it was a “false alarm”, but upon further inspection, I could see new rotating updraft on higher tilts.

0.5 deg tilt
4.0 tilt

It looks like this updraft ultimately played pivotal role (or was at least in the area of) new tornadogenesis about 15-20 min later.


0220Z – Two NTDAs in Close Proximity

ID20 was the main object. Lat/Lon is 32.491/-96.916
ID33 came along second and is at 32.514/-96.889
This is about 4km apart

These seem a little close together and could clutter up display. Also, these didn’t seem to be two separate areas of low level rotation, but both part of the parent circulation.

-Beltzer