An official website of the United States government
Here’s how you know
Official websites use .gov A
.gov website belongs to an official government
organization in the United States.
Secure .gov websites use HTTPS A
lock (
) or https:// means you’ve safely connected to
the .gov website. Share sensitive information only on official,
secure websites.
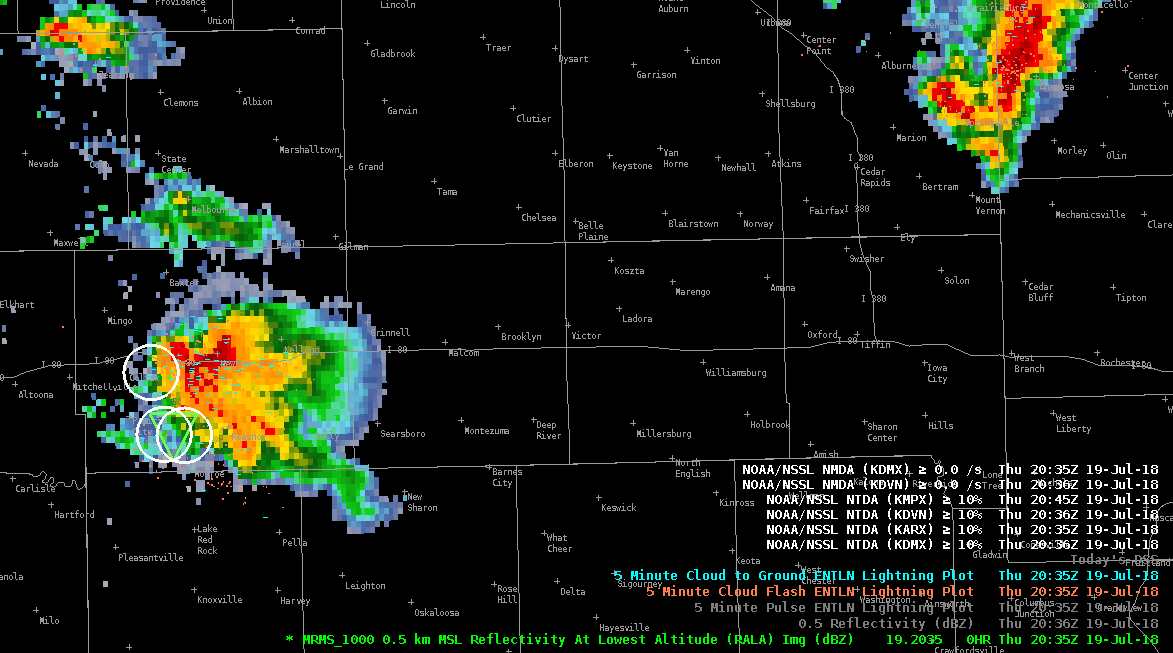
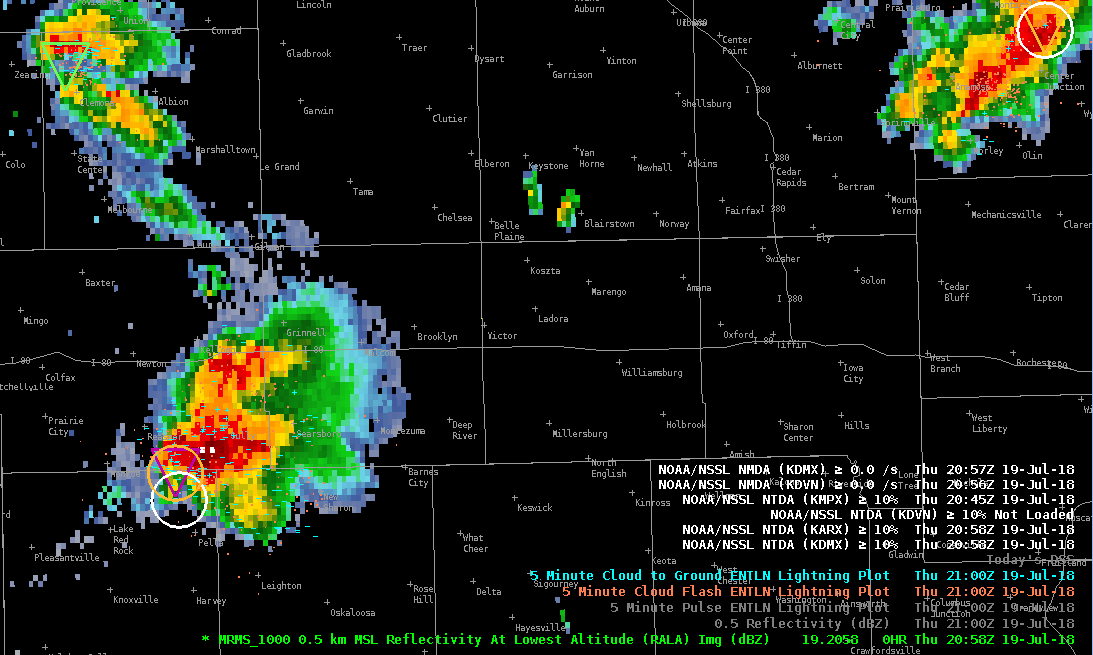
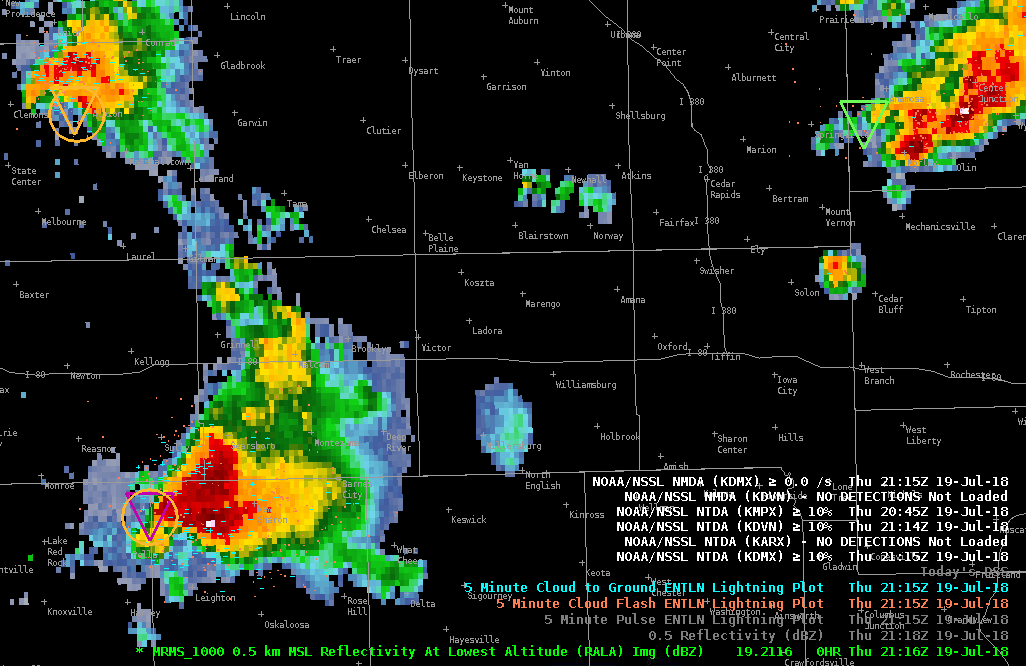
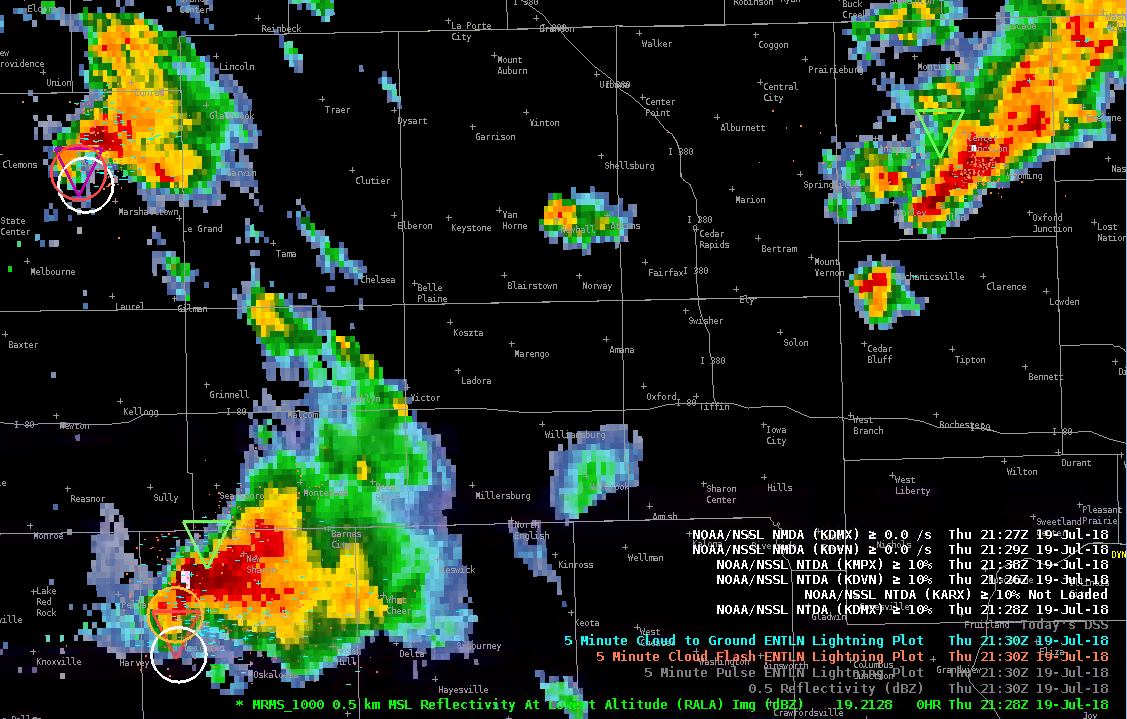
Here’s a series of screenshots showing how both algorithms increased detections and intensity as the event evolved.
DMX 2035ZDMX 2058ZDMX 2116ZDMX 2128Z
After a difficult start to this event in which both algorithms had an absence of detections despite multiple reports of tornadoes and funnel clouds (likely due to very limited Z in the area of weak rotational couplets), both algorithms performed much later in the event when two dominant supercells emerged as the primary threats. Both algorithms showed an increase in intensity coincident with increasing rotational velocity, and for the most part, tracked these features well.
It’s good to see these algorithms do well in relatively obvious situations, because if they can’t get these right, it’d be hard to use these operationally with much confidence.
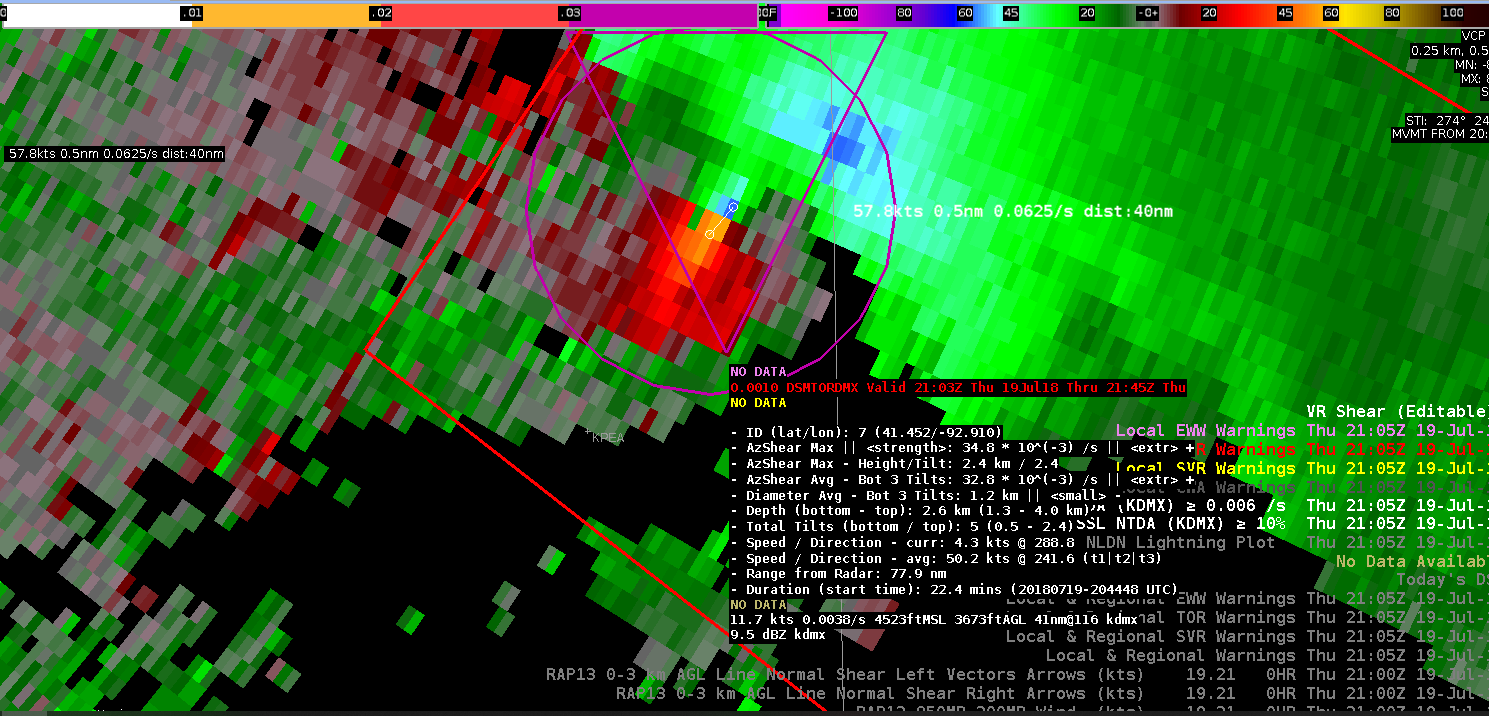
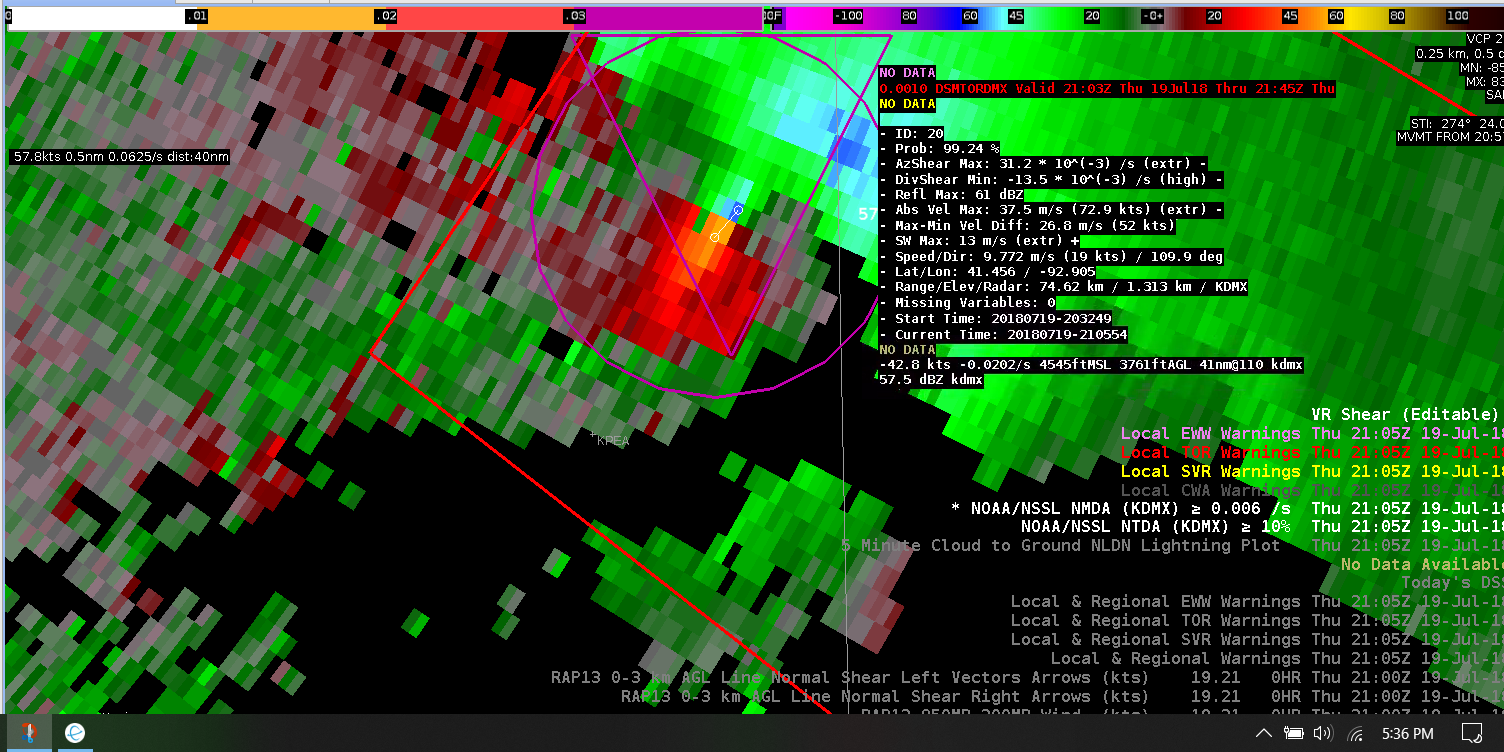
An outlier severe weather event turned out a few classic supercells with tornadoes. The algorithms performed well with this supercell with extreme values on the NMDA, and the NTDA having a 99+ percent chance for a tornado. The V-R shear couplet was intense with a high probability of an intense tornado. Would not be surprised if this was an EF2 or even an EF-3. High confidence tornado warning issued with these algorithms doing a stellar job with a tricky convective environment.
18 July 2019 KDMX 0.5 SRM with NMDA and NTDA overlaid. Impressive tornadic supercell with V-R Shear showing 58 knots of rotation with a shear value of 0.0625 s-1. It was a distance of 40 nm from the radar with an extreme MESO from the NMDA.18 July 2019 2105 UTC KDMX 0.5 SRM with NMDA and NTDA overlaid. Impressive tornadic supercell with a 99+% probability of a tornado and an absolute velocity max of 72 kts!
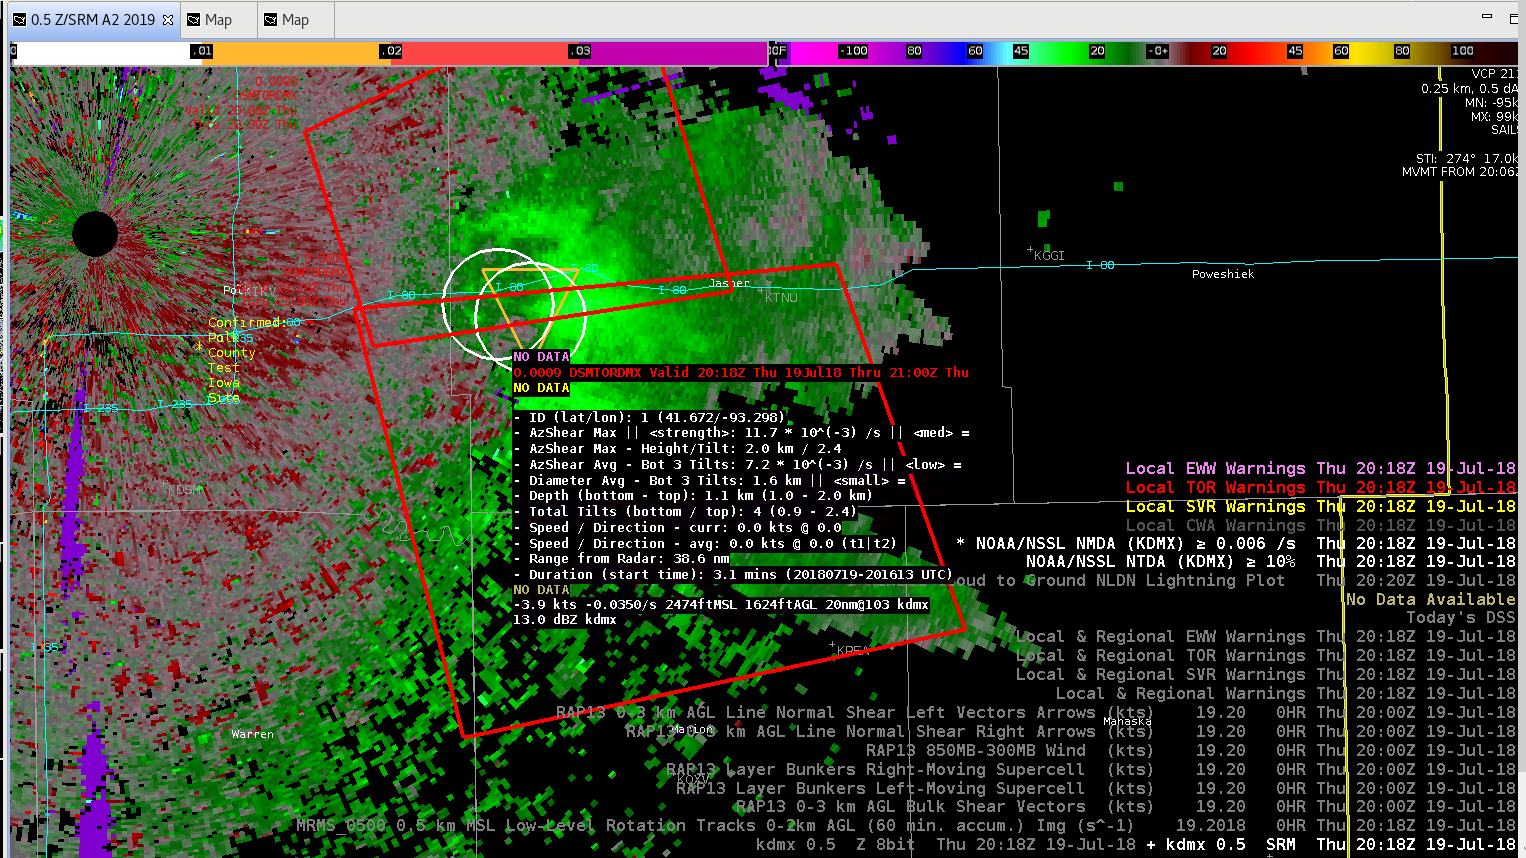
An outlier severe weather and tornado case to say the list. Adjusted NMDA threshold to the bottom value of 0.06 to detect weak MESO’s and the NTDA percentage to 10%. The tornadoes to the east to the RDA I warned on based on the ground truth to the north and what they may have seen outside the WFO DMX. Tornado Probs 10-20% were yielding the tornadoes with very strong inbound velocities. The inflow ahead and along the warm front was strong. The image below is the 2018 UTC 0.5 DEG SRM with NTDA and NMDA algorithms overlayed. Also, the TOR polygons I issued were overlayed. Slider Bars and ground truth was the key to this event.
There was an occluded boundary north of the DMX radar where several mini-supercells developed. Environmental shear across the boundary may have enhanced the tornado potential similar to waterspouts developing along a sheared boundary. The first tornado report came quickly after the simulation began and was associated with a cell I certainly would not have warned on given the weak appearance on reflectivity and weak rotation.
azAhear was relatively weak for each rotating cell along the boundary and NTDA probs were peaking at about 20 to 30%. Although the probabilities from the NTDA were low, it did a surprisingly good job of only detecting the stronger rotations. By a *rough calculation*, if you had relied solely on the NTDA with a threshold of ~25% in areas > 10 miles from the radar you would have had a warning on every tornado with at least a few minutes of lead time. I think there would have been one or two false alarms but overall I think the NTDA did very well.
You may have been able to cut down on some of the FA by using GOES16. The IR/VIS sandwich RGB happened to do a very good job of showing the cells that produced a tornado. The cells where the IR cools below the threshold for display tended to be the ones that produced tornadoes along that boundary. The exception may have been the storm farthest north of the radar, in northern Wright County, where the cloud tops were cool but there was likely a stronger low level inversion with surface temps near 66°. I attached a loop of the sandwich RGB and NTDA detections to try to show that the NTDA and coolest cloud tops were closely related.
GOES16 IR/Sat Sandwich RGB and NTDA detections. The cooler cloud tops and NTDA detections seemed to be good discriminators between tornadic and non-tornadic cells.
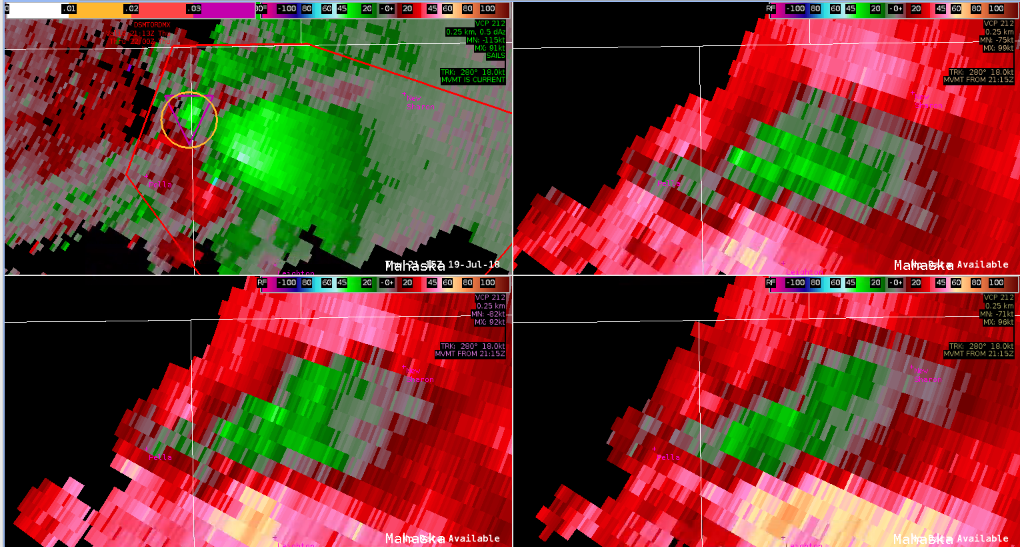
Here’s a quick, classic example of where meteorological situational awareness plays a large role in storm interrogation while using the NTDA/NMDA algorithms. A first look at Base Reflectivity shows higher probabilities of NTDA/NMDA at a position of the supercell well detached from where you would commonly expect strong, deep rotation (notice the BWER also in the top left, cool!).
2157Z 7/19/18 KDMX. Top Left: 0.5º BR. Top Right: 3.1º BR. Bottom Left: BR 4.0º. Bottom Right: BR 5.1º.2157Z 7/19/18 KDMX. Top Left: 0.5º SRM (Storm motion 280º at 18kt). Top Right: 3.1º SRM. Bottom Left: SRM 4.0º. Bottom Right: SRM 5.1º.
Sure enough, looking at SRM confirms messy and anomalous values of SRM likely associated with the back end of a boundary or front. Another example of anomalous values from both algorithms and how situational awareness can avoid miss identifying aspects of a supercell.
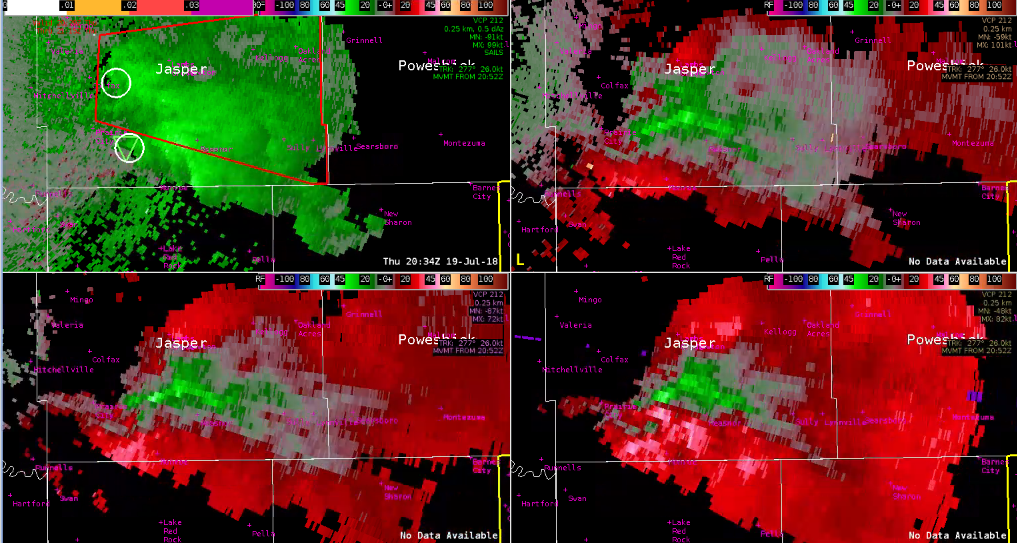
Interesting confirmation from the NTDA/NMDA Algorithms in the DMX Archived Review. An earlier Tornado Warning was in effect for a main ESE tracking supercell, with plenty of storm reports previously. Out ahead of this storm, a weak cell was approaching from the SW and was beginning to merge and cut off the necessary inflow to the already ongoing tornado in south-central Jasper County.
This brought forth an interesting situation. NMDA/NTDA algorithms were lining up but at low probabilities at 2034Z (NTDA 23.56%) which was enough to grab my attention. Since this entire event was tricky due to such an elevated storm environment (analyzing SRM/BV at atleast 3.1º and above), seeing the algorithms line up was enough confidence given to propose a new TOR for the southern part of the current polygon.
2034Z 7/19/18 KDMX. Top Left: 0.5º SRM (Storm motion 277º at 26kt). Top Right: 3.1º SRM. Bottom Left: SRM 4.0º. Bottom Right: SRM 5.1º.
From here, NMDA began to show increasing trends which supported a visual interpretation of increasing cyclonic rotation in the mid levels.
2041Z 7/19/18 KDMX. Top Left: 0.5º SRM (Storm motion 277º at 26kt). Top Right: 3.1º SRM. Bottom Left: SRM 4.0º. Bottom Right: SRM 5.1º.
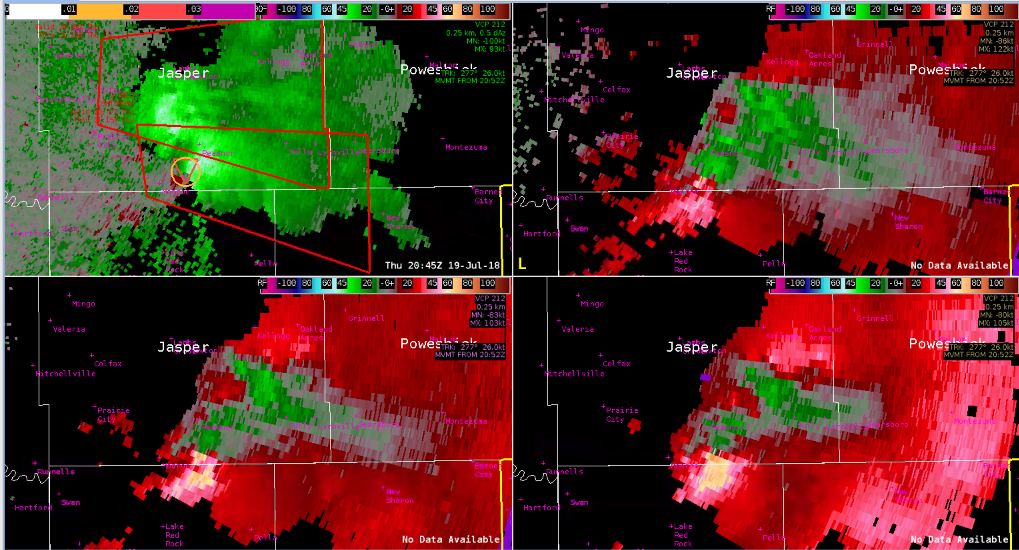
Further increases in NTDA/NMDA along with increasing Vrot now in the lowest tilt (indicative of either a strengthening tornado or stretching/tightening of rotational velocity to the lowest levels) increased forecaster confidence in the decision of a warning.
2045Z 7/19/18 KDMX. Top Left: 0.5º SRM (Storm motion 277º at 26kt). Top Right: 3.1º SRM. Bottom Left: SRM 4.0º. Bottom Right: SRM 5.1º.
This was a great illustration of both an early heads up, and a warning confirmation from both algorithms. Only mistake was not using the Bunkers Right Motion wind barbs to illustrate a tall enough updraft’s potential at a far right deviant motion (with a follow up warning clocked much more southeast to account for this motion)
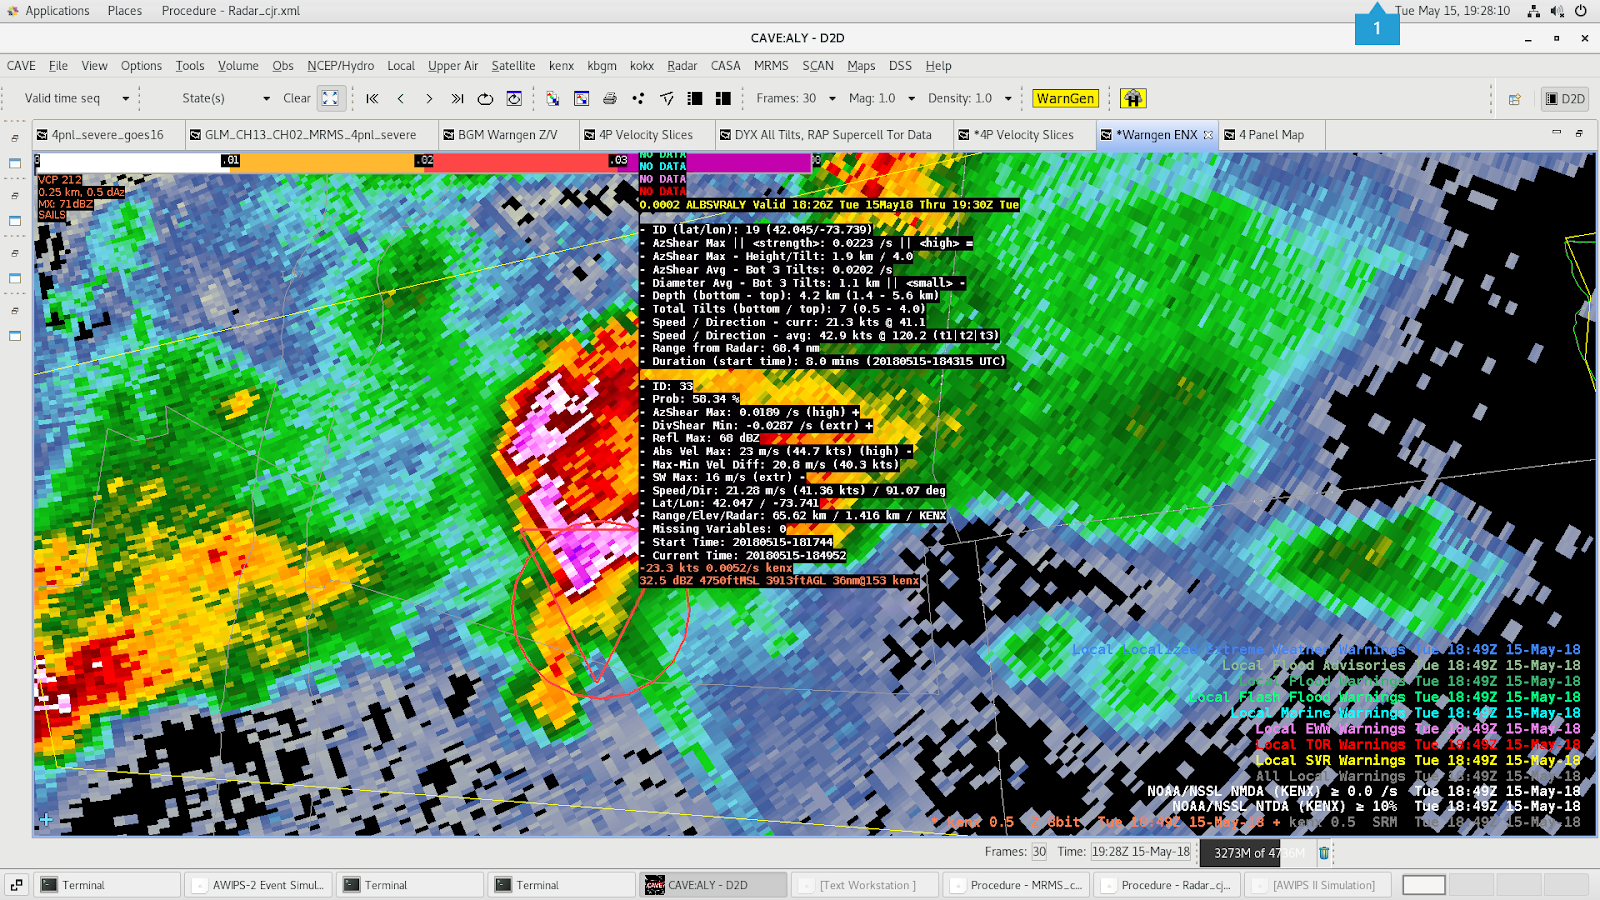
A supercell tracked south of the ENX radar in the archive case. A particularly large hail core produced a TBSS to the south of the storm over the inflow region. This may have produced bad velocity data in the area of interest when examining the Meso/TDA detection. At 18:49Z, there was a high prob in the NTDA and the NMDA was colored in the 3 out of 4 range. But the values really jumped around within a few scans of that time. Possibly because of the TBSS signature. I found that the detection values were much more consistent with the supercell once it moved east and the TBSS was located away from the hook/inflow region. It was important to use nearby radars in this case to avoid the TBSS contamination.
SRM at 18:49Z near the ENX 88D radarTBSS in Reflectivity at 18:49Z near the ENX 88D radarCC at 18:49Z near the ENX 88D radar
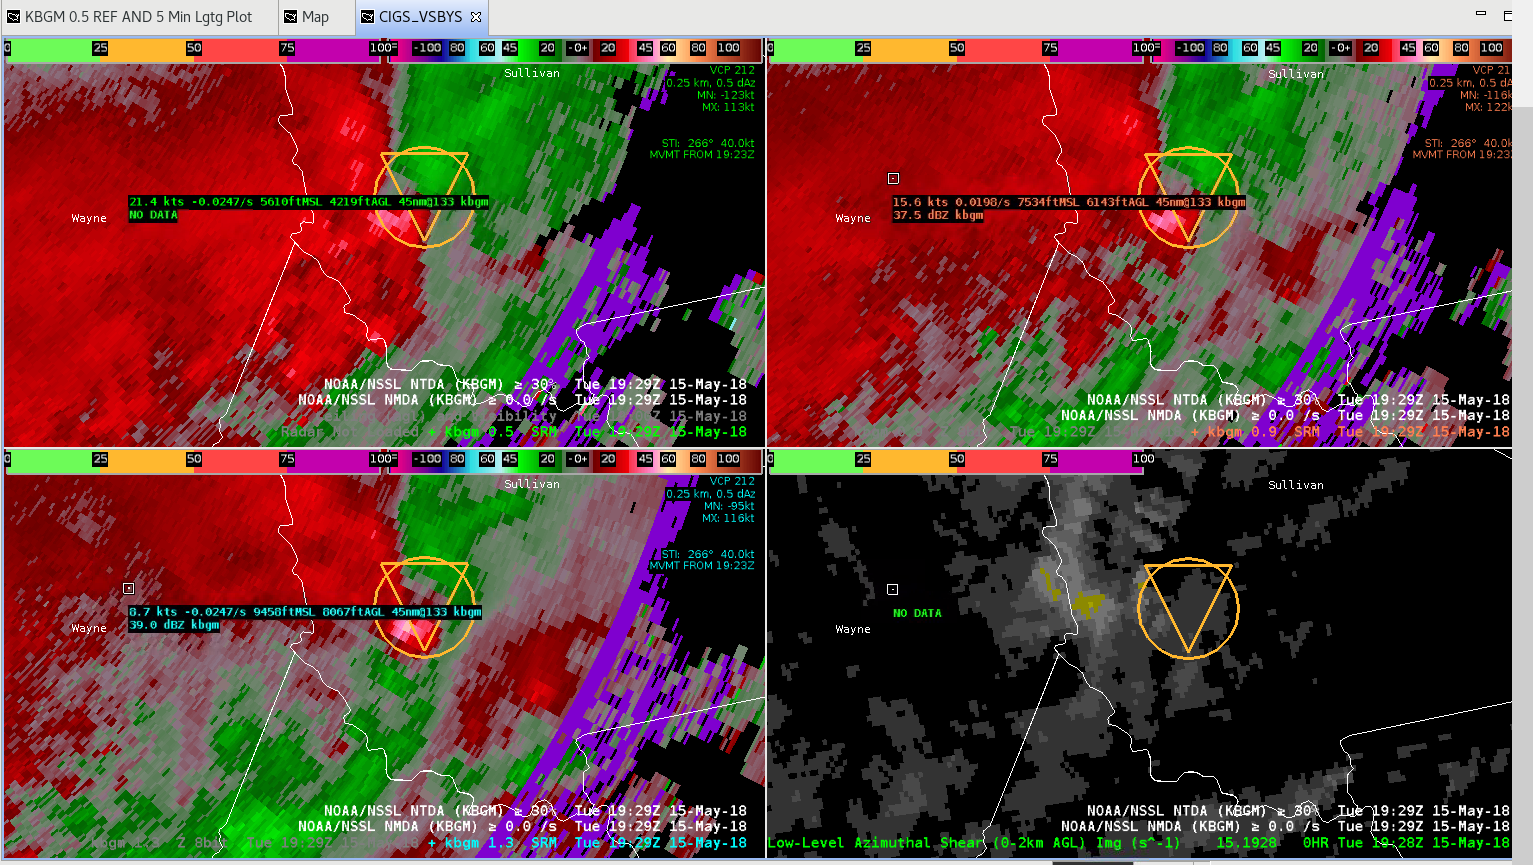
A supercell formed along the squall line/QLCS moving through the Catskills and Sullivan County. The circulation strengthened around 1925 UTC and continued through 1929 UTC with a deep MESO detected through the lowest 5 tilts of the radar beam and around 100 nm from the KBGM RDA. The probabilities for a tornado increased to ~60% with a strong inbound velocity and some outbound in terms of the mesocyclonic couplet. The potential tornado was moving towards KMSV. The two images below show the cursor readout (0.5 DEG, 0.9 DEG, 1.3 DEG of SRM/REF data and 0-2 km Azimuthal shear). The radar beam is up high, but I felt with a medium strength MESO and high Probs for a TOR from the NTDA that an upgrade from a SVR to a TOR was warranted.
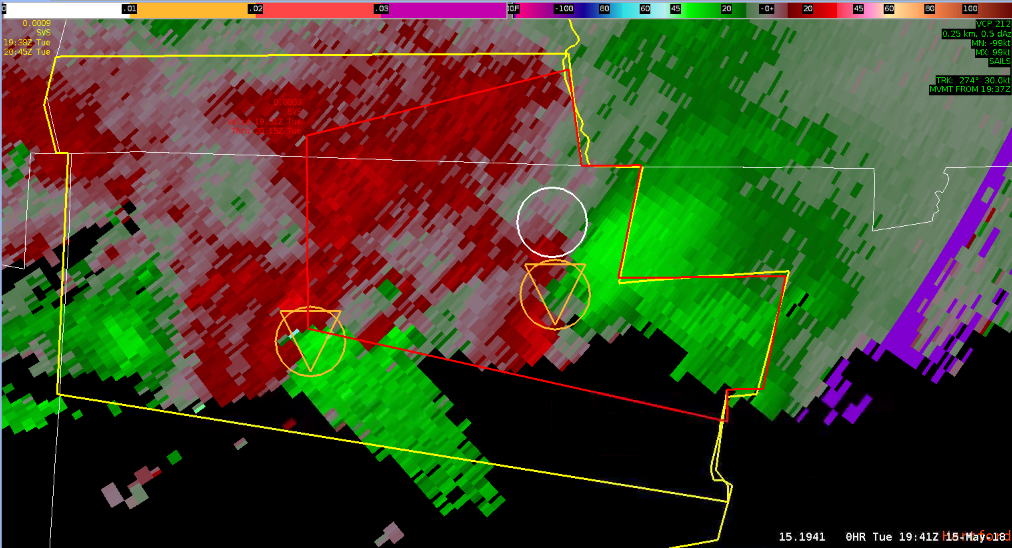
Interesting challenge in today’s Archived Case from WFO ALY. One particular challenge was the presence of Three Body Scatter Spikes (TBSS) present within the inflow region of supercells south of the RDA causing the radar beam to strike hail prior to the rotational signature. Since this phenomenon was more so identified on the lowest tilt, I did not witness any significant anomalously high probabilities from the algorithm, but it did identify a centralized area of rotation (see “stacking” of NMDA and NTDA in images below).
In the meantime, damage from a tornado was being reported in the lead (eastern) cell, which also had lower-end probabilities but within a more trustworthy region of velocity – owing to confidence in the warning. However, using meteorological “common sense” gave me the ability to take the western cell’s algorithm detection less seriously.
Is this a weakness or a strength in the algorithms? Depends on how you look at it. For the lead storm, I was a bit surprised on the lower probabilities, but for the western cell, it gave a prime example on the limitations that exist and where you, the forecaster, come in by having that situational awareness at hand to identify false signals.
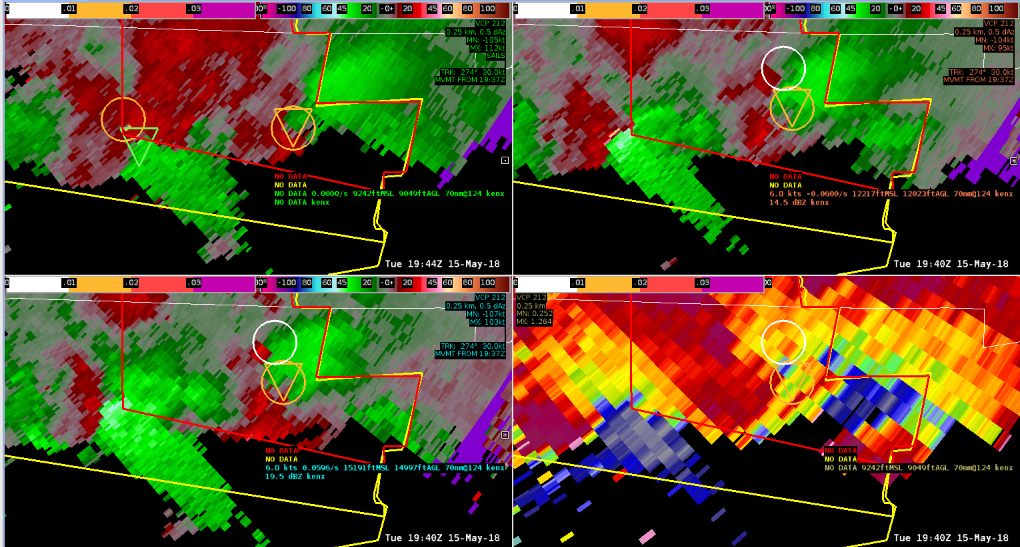
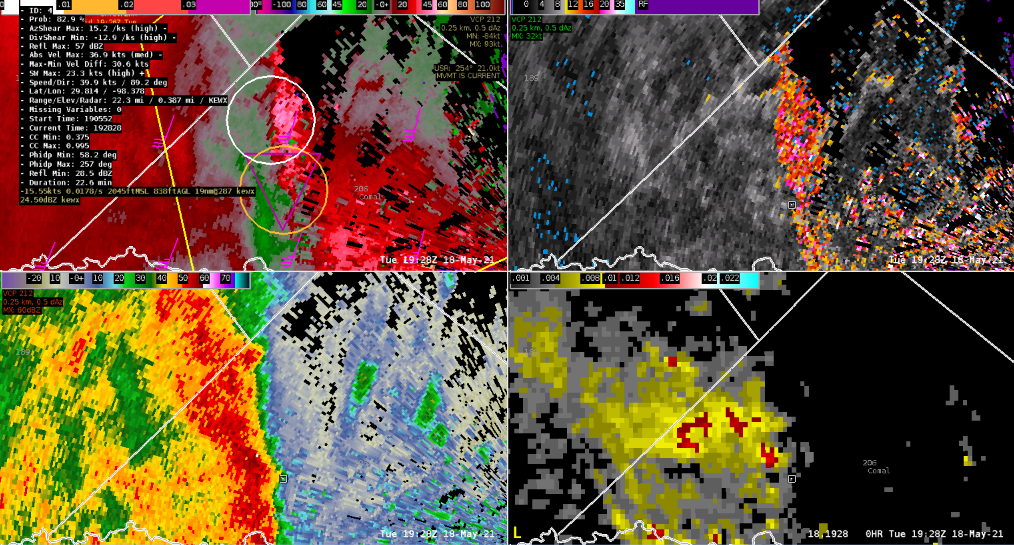
Today’s case at EWX presented numerous challenges in a mixed case multicellular/linear convective environment. While closely monitoring for any potential local surges along an eastward surging line segment (already covered with a SVR/TOR POSSIBLE at the time), it was observed several NMDA and NTDA algorithms were lightning up along the front edge of the line.
At this time, I was closely monitoring for any local surges given 0-3km Bulk Shear reached 30-35kts, but the UDCZ (Updraft/Downdraft Convergence Zone) was not line-normal to the shear orientation, meaning it would take a local surge to possibly spin up requiring a proactive tornado warning decision.
This line segment was just west of the EWX RDA at the time, which presented some challenges along the leading edge of the line with ground clutter in an area of low power return causing erroneous velocity (as noted in very high SW).
This was an example of where applying situational awareness to each algorithm is necessary, and false signals can and will appear. This is where the trained eye comes in to further investigate using additional products/scans to gain confidence at what exactly is going on.
KEWX Radar scan 19:28Z 5/18/21. Top left: 0.5º SRM using a storm motion of 254º @22kt, 0-3km Bulk Shear and NMDA/NTDA with cursor readout. Top Right: 0.5 ºSpectrum Width. Bottom Left: 0.5º Base Reflectivity. Bottom Right: MRMS Low-Level Rotational Tracks.