Satellite HWT Day 4 Thoughts
Octane Direction
During my initial afternoon analysis I noticed a good use case for the directional product in identifying how different air masses may be coming together over the CWA. In the directional product below, we can see the magenta showing the moist surface air mass that is advecting up from the SE into west Texas and western NM. A drier air mass that is creating a bit of a dry line is pushing from the west in the more yellow colors, with some glaciating cu noted within the Day Cloud Phase RGB. Elevated convection that is still persisting from overnight can be see pushing to the southeast in the lower right, giving the more green colors. This provided a very clear and quick way to pick out these different air masses that will be the main players later in the afternoon for potential convection.
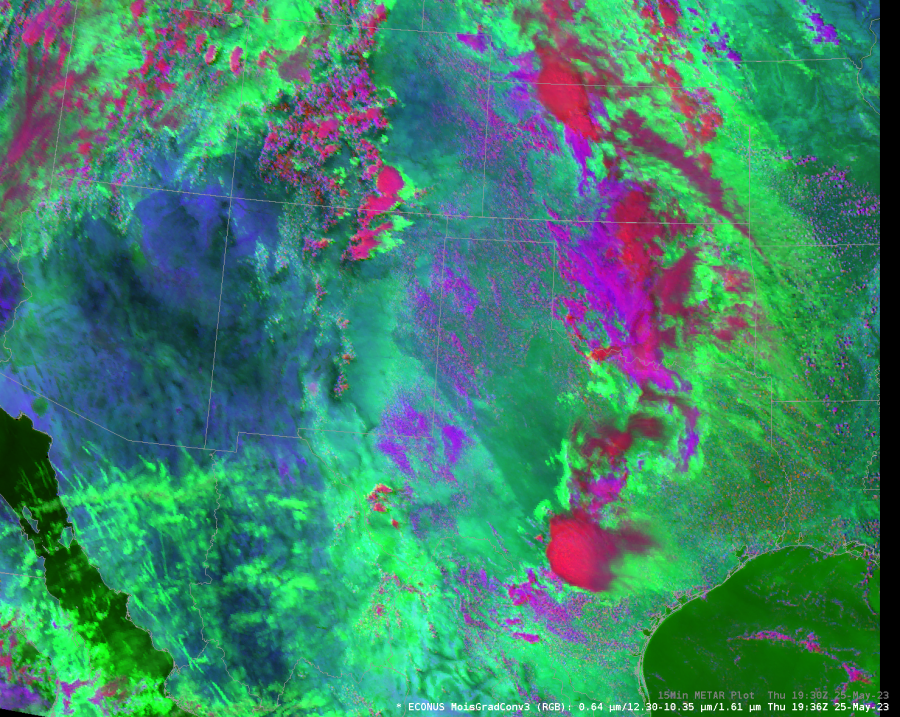
MoistGradConv RGB ECONUS
Some really interesting features that stood out when looking at this imagery during the afternoon today. Notice the sharp gradient in the light vs dark greens running across Texas, starting in the southern pandhandle near the NM border and then running SE through central parts of TX. When overlaid with 24 hour MRMS precip, you can see a clear boundary between the areas that received rain last night (the panhandle, darker greens) and the area that did not (lighter green in the Big Bend areas). This clearly stands out in the Snow/Ice NIR band which makes up a portion of the RGB. Moisture can also be seen pooling in west Texas as it moves northwestard along the edge of the Mexican Plateau. Obs later in the day showed that the “brighter” area was mixing out a bit faster given the lack of soil moisture. Some good potential situational awareness being combined within the RGB, given the ability of this to also pick out things like the dry line a little bit easier.
ProbSevere v3
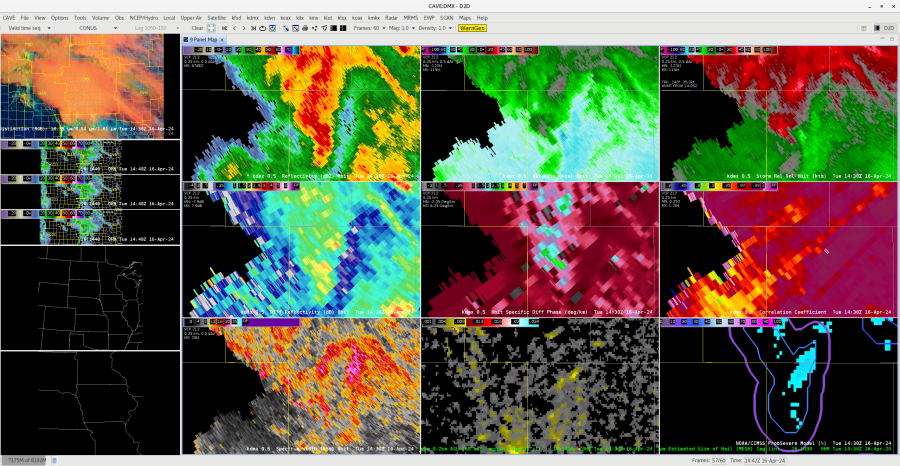
Issued a warning in an area of pretty poor radar coverage (lowest tilt height was around 15kft). MRMS was still capturing a good bit of the freezing level to -20C isothermal levels, so ProbSevere was running pretty strongly with hail probabilities. Additionally, there were some significant bursts of cooler cloud tops, and the Octane product began to show some of the stronger “divergent” signatures that we had seen throughout the week as well as highlighting a clear AACP, all signs of a stronger updraft capable of keeping hail lofted.

Given the environment, these products definitely gave me additional confidence and potential lead time, given these cores really grew tremendously about 15 minutes later, including an eventual split and right mover that likely produced some large hail (hard to verify in this area given lack of population).
More Octane (Speed)!
Another picture from later of how this storm grew and exploded. Octane was showing yet another AACP. A very interesting feature of this is that Octane speed algorithm does seem to be “tracking” the AACP in a way. There are a lot of research groups out there that have been looking at ways to track these features for injections of tropospheric moisture into the stratosphere among other things, so this could be a novel way at looking at that problem.
An hour or so later, we can see how the Octane product can be used to see that a storm was weakening. The deep blue divergent signature began to quickly fade, an indication that the updraft wasn’t as strong as it was previously. Given this is data flowing in from the mesoscale sectors on GOES 16, we are getting one minute updates, which will give some lead time over analyzing the core of the storm via the radar or MRMS which needs to get the radar data and then process it. This can be important for SVS or considerations for a downstream severe. I ended up still issuing a downstream severe, but was able to use what I was seeing in the product with the weakening trend to decrease the expected hail size. MRMS and ProbSevere trends closely followed, moving downward in severity.
Above: Weakening trend starts around 22Z for the Octane Speed product in the top left
Below: ProbSevere and MRMS trends begin to come down around 22:05Z or so, lagging the above by a few minutes. Every minute counts in lead time.
-Carl Coriolis


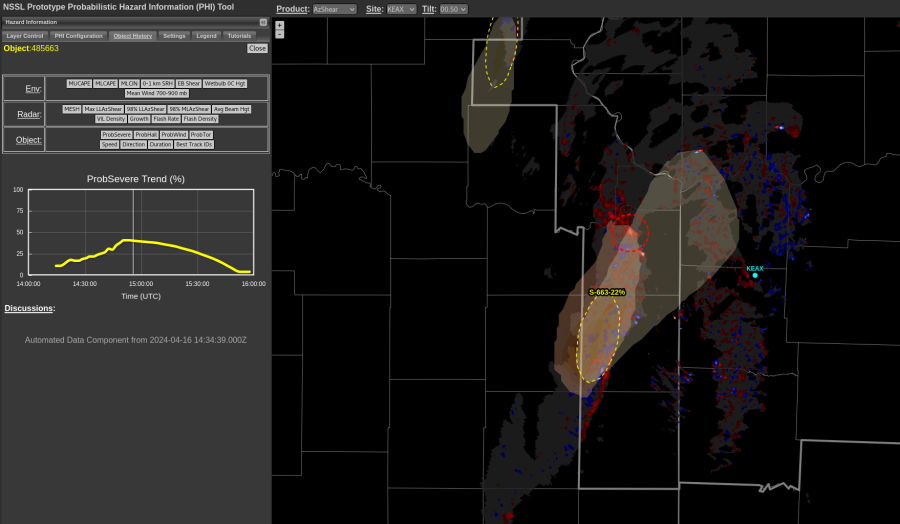 Initially, prob severe detected a small area for it’s algorithm and it tagged it with low severe probabilities. As the storm progressed, prob severe picked up a larger area for the object, and when it did that, the probabilities increased.
  This could indicate that the storm is gaining strength, but radar presentation has remained almost steady state. This could be a detection issue as when it picks up a larger area, the probabilities increase due to size.
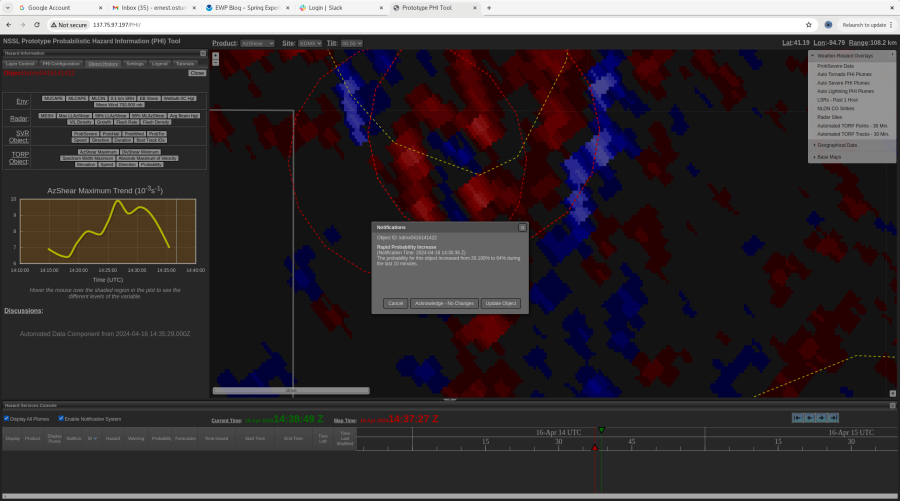
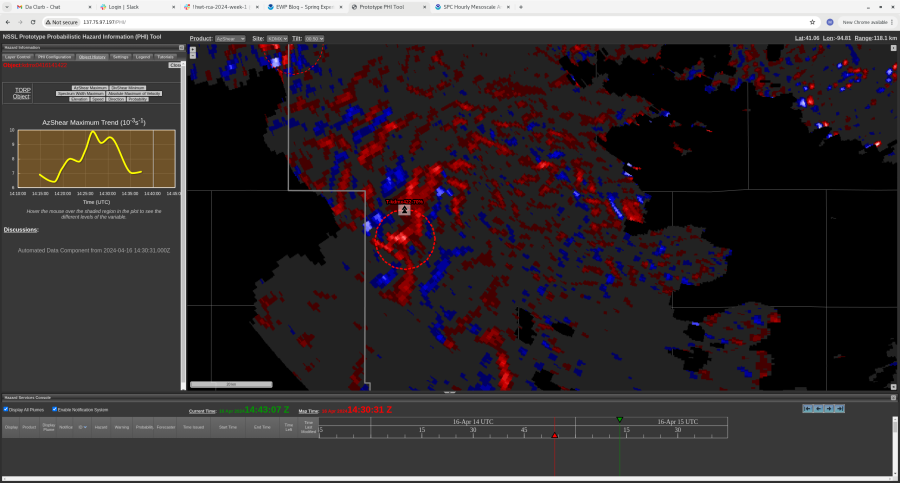
 I still don’t know if this will turn into anything, but AZ shear signal that is being picked up along with the trend is concerning. This storm is just starting to show some inbound velocity and this may be a very early warning signal. Definitely worth watching at this point.
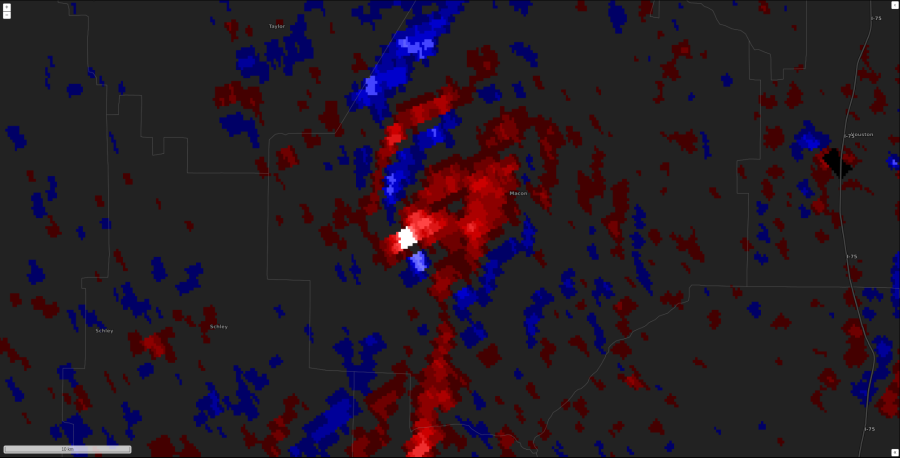
 Quick example of a very small false signal (low prob around 30%) that appears in AZ shear data. That said, I think this is good. It forced a quick look at V/SRM data to see if it was real, and it could be quickly eliminated – and it quickly disappeared from AZshear in the next couple of minutes. Showed up on multiple radars – also good. I also think setting filter lower to say 15% would be better. Having the extra circles there is not problamatic and does not prevent you from seeing the data behind it.


 Octane Speed Sandwich also captured the outflow boundary approaching the DSS Event.