-Oppenheimer
Category: News
First blog post (test)

First blog post. Rotational velocity tightening considerably with corresponding CC drop. -Sidney Crosby
Test Blog Post
This is a test post. Fingers crossed it works! Now I am editing to see if it works lol.

Kilometers
Test Post
Example of a 6 panel map with Az and Div Shear plotted


-Nimbus
Test Post
This is a test blog post to test the software and process.
High TORP Signal with Strange DivShear
In my pursuit to find strange cases with TORP, AzShear, and DivShear, I stumbled across a large number of single digit TORP probability values along a line of meager convection. As I cycled through the different TORP objects, most looked to have short life spans with low values (as expected) but one looked to extend out over an hour back with sharp spikes in probability up to 74%.
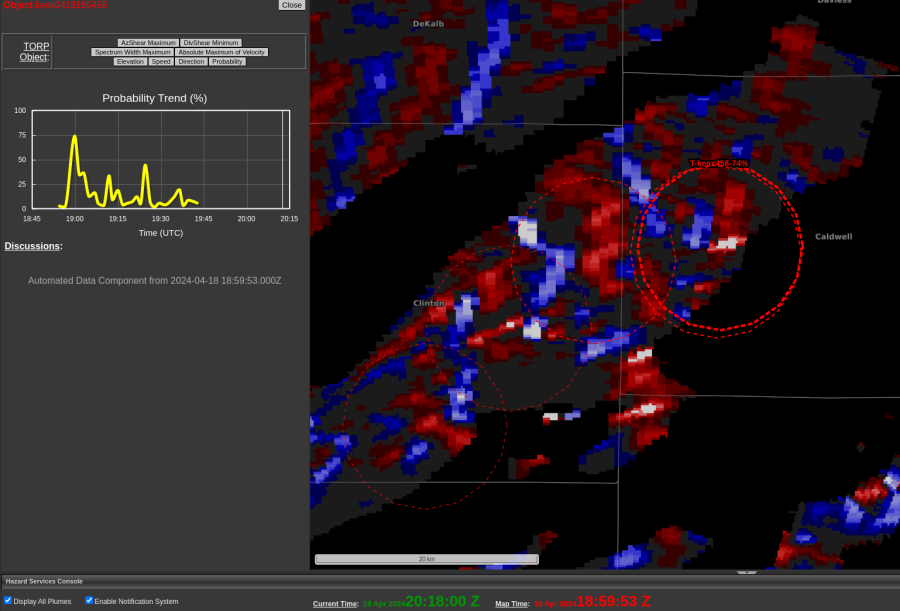
Intrigued, I stepped back to interrogate the storm data, expecting to see a possible tornado in its wake. In reality, it seemingly caused by erroneous velocity data (displayed with reflectivity below).
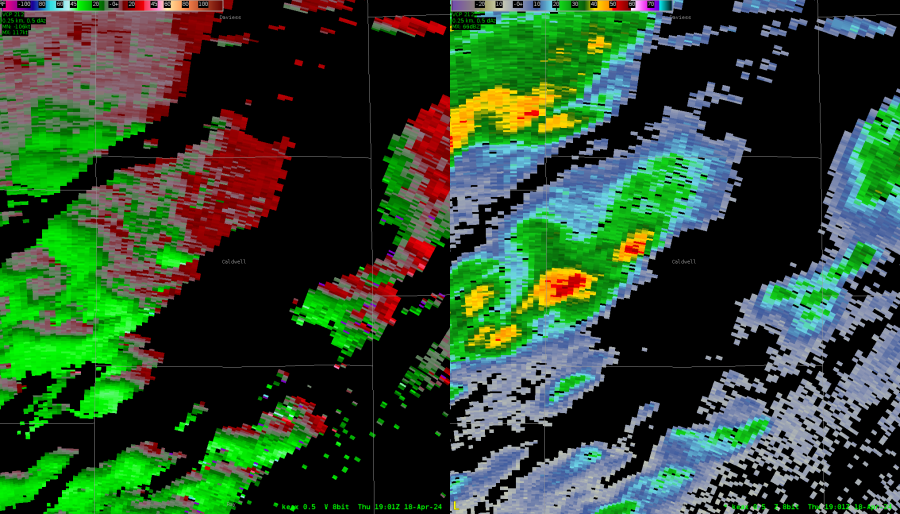
This was a little disappointing both because TORP seemed to have done alright with the line otherwise and this feels like something QC could catch and delete (not that I would necessarily know how). The overdone AzShear looks to explain this outlying detection, but I figured it would be worth also checking DivShear now that we had access to it. What I found was not what I was expecting.
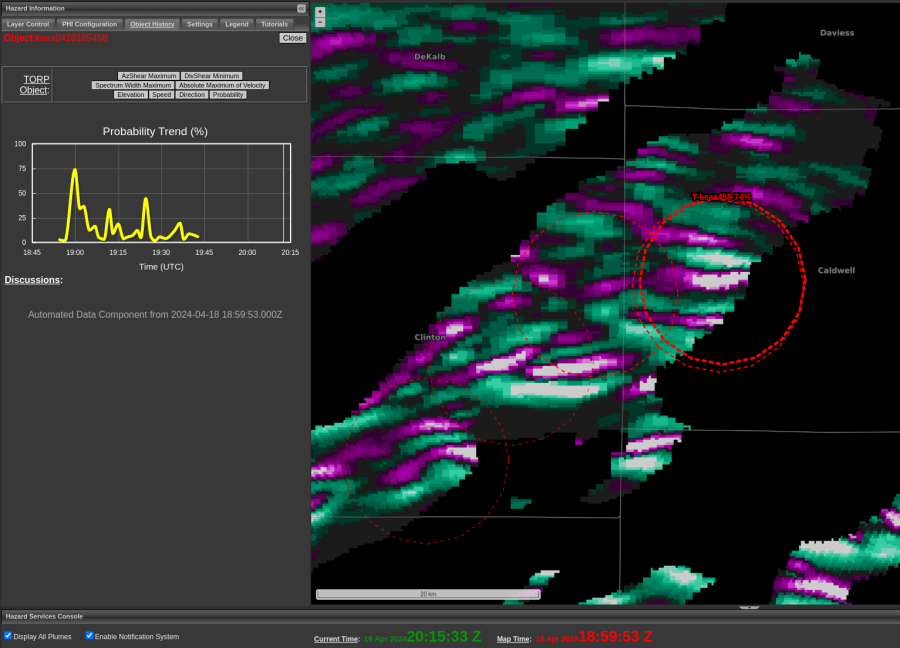
When we have good data for a robust supercell, we would expect a sort of clover formation centered about the max AzShear couplet. Instead we have these long ribbons and convergent and divergent signatures. Pleasing to the eyes, but again not what we want to see if we expect a tornado touching down.
-Wx Warlock
Lots o’ Detections
KDOX radar plotted nine TORP detections along a line of low-topped convection at 1451Z on 7 Feb 2020. Eight of the nine detections had probabilities over 30 percent, but almost all of them were less than half an hour in duration. 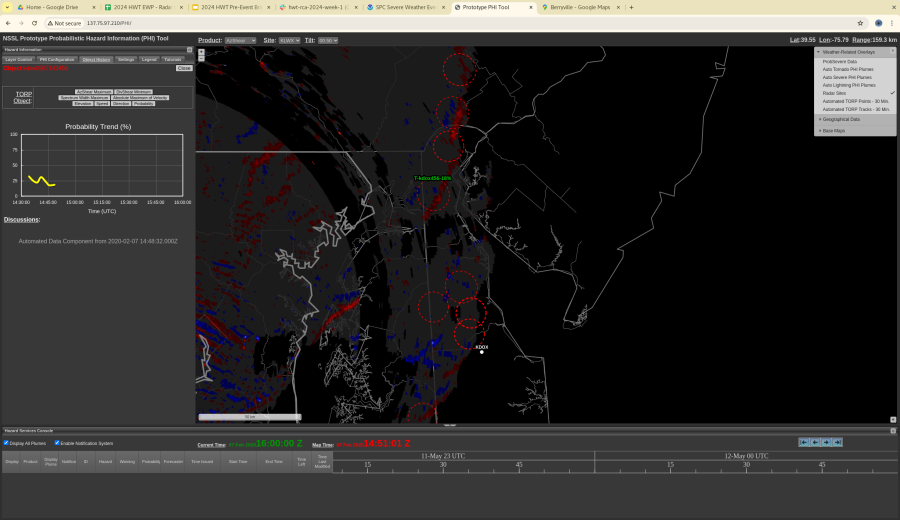
Posted by Rigel
AzShear Increase with Clutter
Just south of the couplet that did produce damage, AzShear looked quite good with what appears to be clutter near the radar. No damage reports were noted in this area.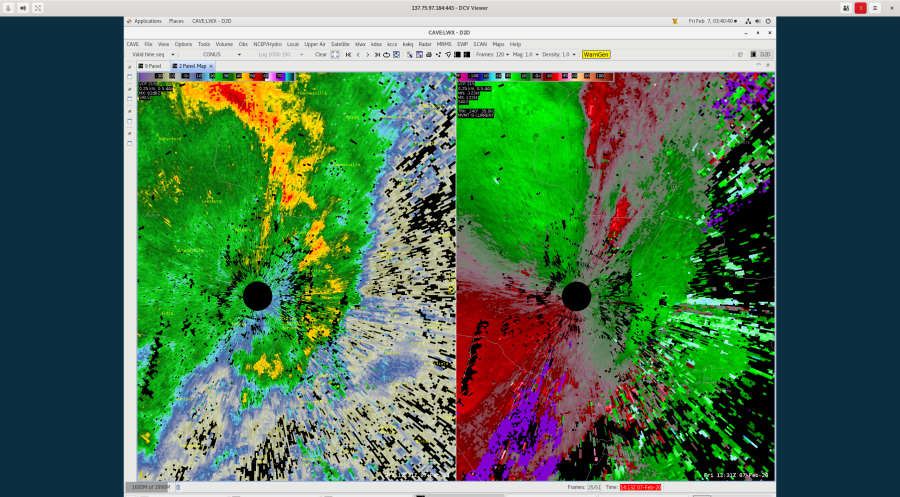 TORP wasn’t that interested in this feature, which is good, but the AzShear certainly caught the eye. This is important to identify as a forecaster and use TORP in tandem with AzShear so as to not be tricked by clutter near the radar that causes AzShear to spike. -newt
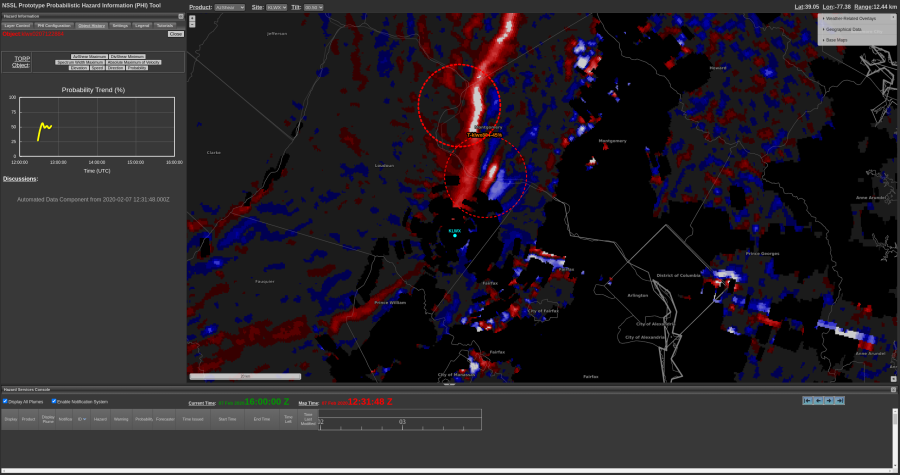
Waves
Interesting wave like structure behind the front in an area of relatively steady (light) precip with a TORP object on leading edge (30ish) prob. Wind report closer to the front at 1417Z that has a weak rotation and signal in AZshear, but does not have a TORP object. – Wildcat 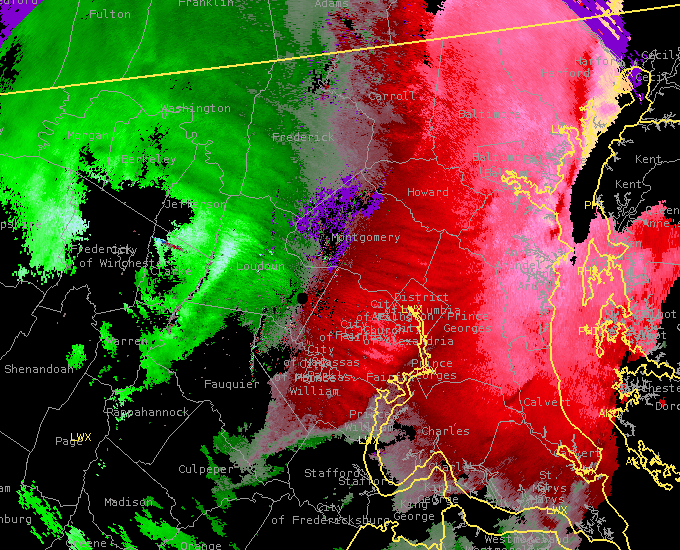
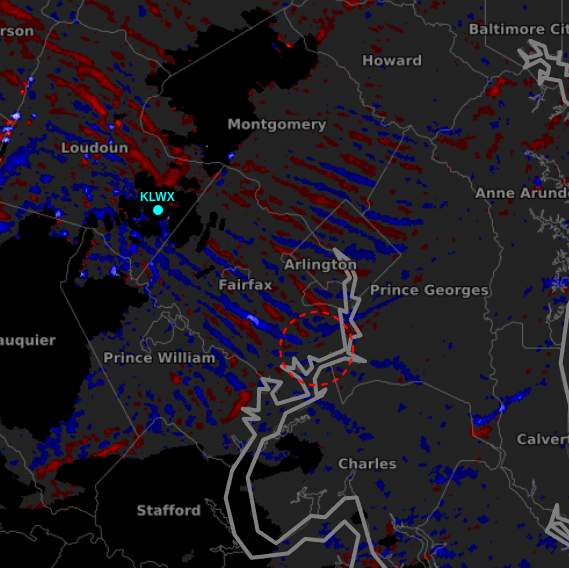
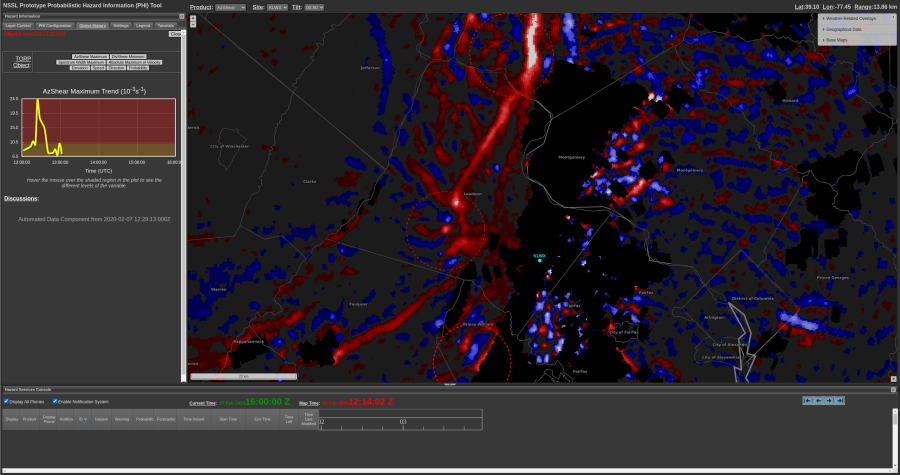
QLCS Spinups
This is a difficult case with the spin ups nearly perpendicular to the radial where most of the damage occurred. TORP wouldn’t have provided much lead time as it very quickly jumped from 21-76% in one volume scan after the couplet had already developed. There was a well-defined velocity signature at the 1217z scan from KLWX.  AzShear started to light up at 1214z. Given the environment, it would have been difficult to lean on AzShear and make a tornado warning decision before any signature developed on radar, but in hindsight some lead time may have been possible using that 1214z AzShear signature. -newt