
In my pursuit to find strange cases with TORP, AzShear, and DivShear, I stumbled across a large number of single digit TORP probability values along a line of meager convection. As I cycled through the different TORP objects, most looked to have short life spans with low values (as expected) but one looked to extend out over an hour back with sharp spikes in probability up to 74%.
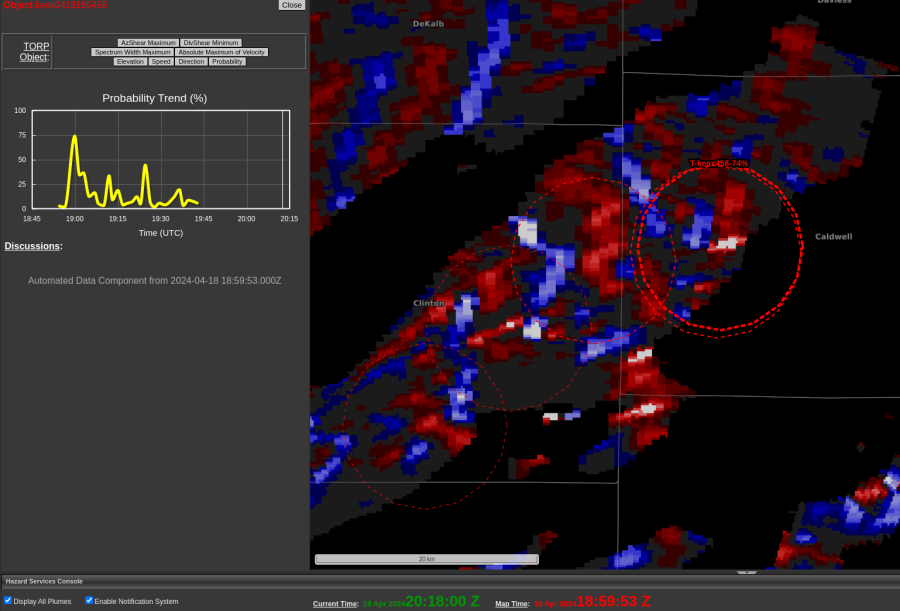
Intrigued, I stepped back to interrogate the storm data, expecting to see a possible tornado in its wake. In reality, it seemingly caused by erroneous velocity data (displayed with reflectivity below).
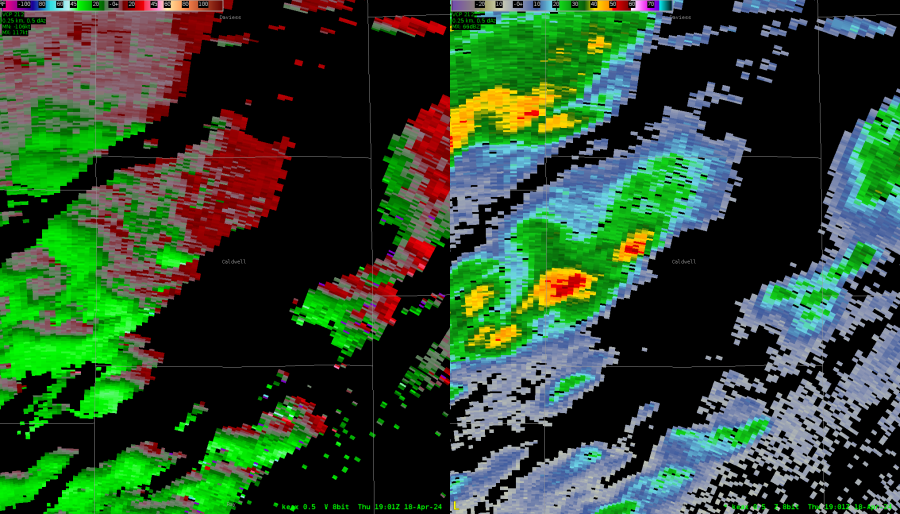
This was a little disappointing both because TORP seemed to have done alright with the line otherwise and this feels like something QC could catch and delete (not that I would necessarily know how). The overdone AzShear looks to explain this outlying detection, but I figured it would be worth also checking DivShear now that we had access to it. What I found was not what I was expecting.
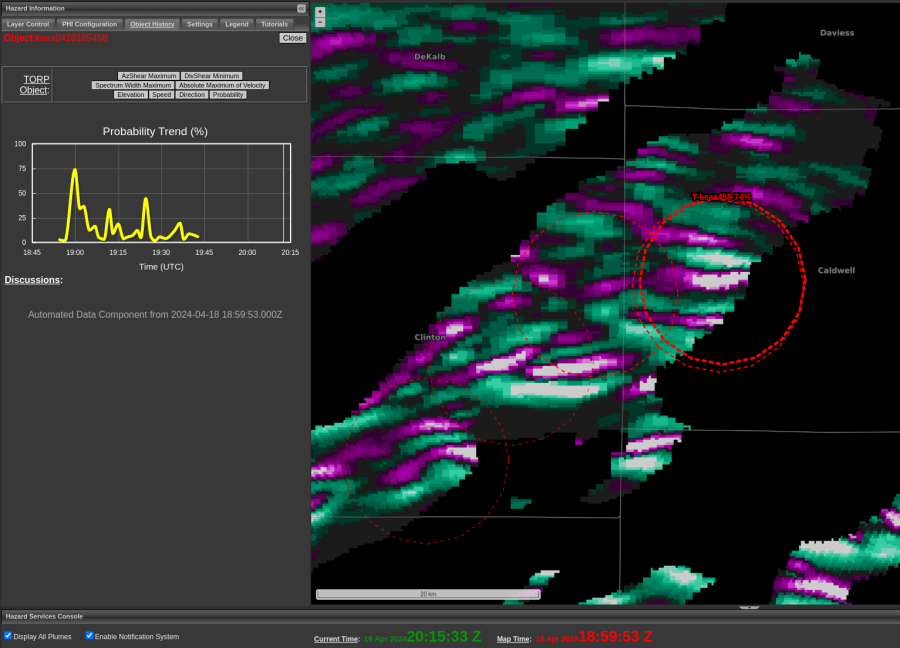
When we have good data for a robust supercell, we would expect a sort of clover formation centered about the max AzShear couplet. Instead we have these long ribbons and convergent and divergent signatures. Pleasing to the eyes, but again not what we want to see if we expect a tornado touching down.
-Wx Warlock