

The below image shows GOES-16 day cloud convection (DCC) beneath GLM Minimum Flash Area (MFA). Point F is a DSS event. DCC shows clouds glaciating a county upstream of our DSS event, with the storm becoming electrified shortly after glaciation per MFA. This prompted a call to the emergency manager providing support for the DSS event letting them know that lightning was imminent.
ENI total lightning also shows lightning (white points), but the point data fails to show the extent of the lightning, which may lead decision makers to think that they have more time to react to the approaching lightning than they actually do. Sandor Clegane
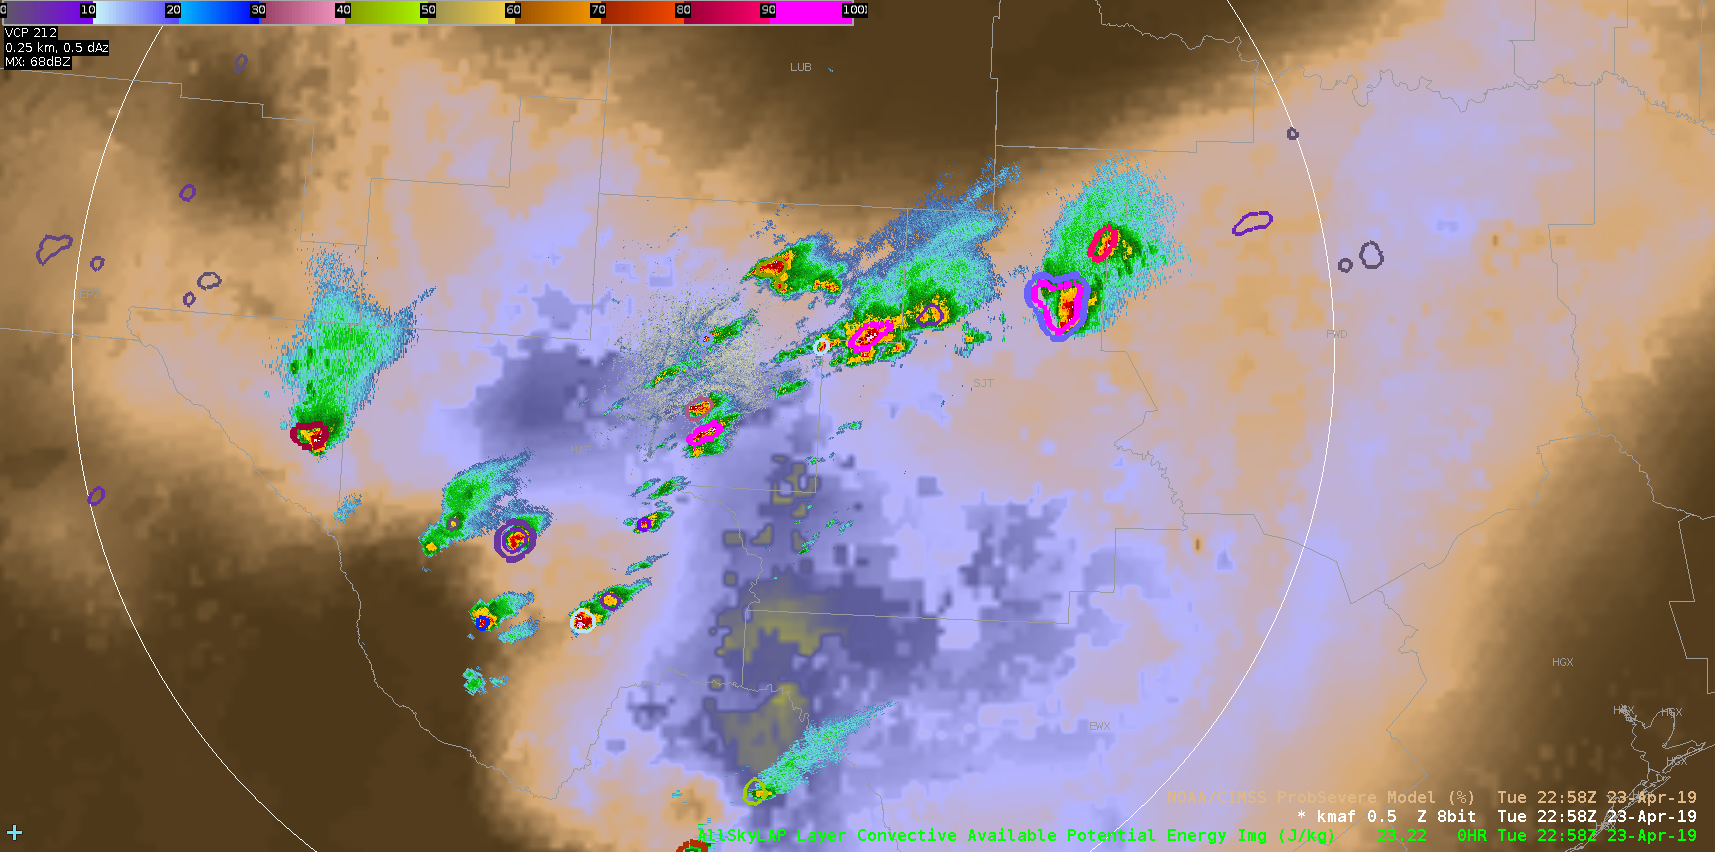
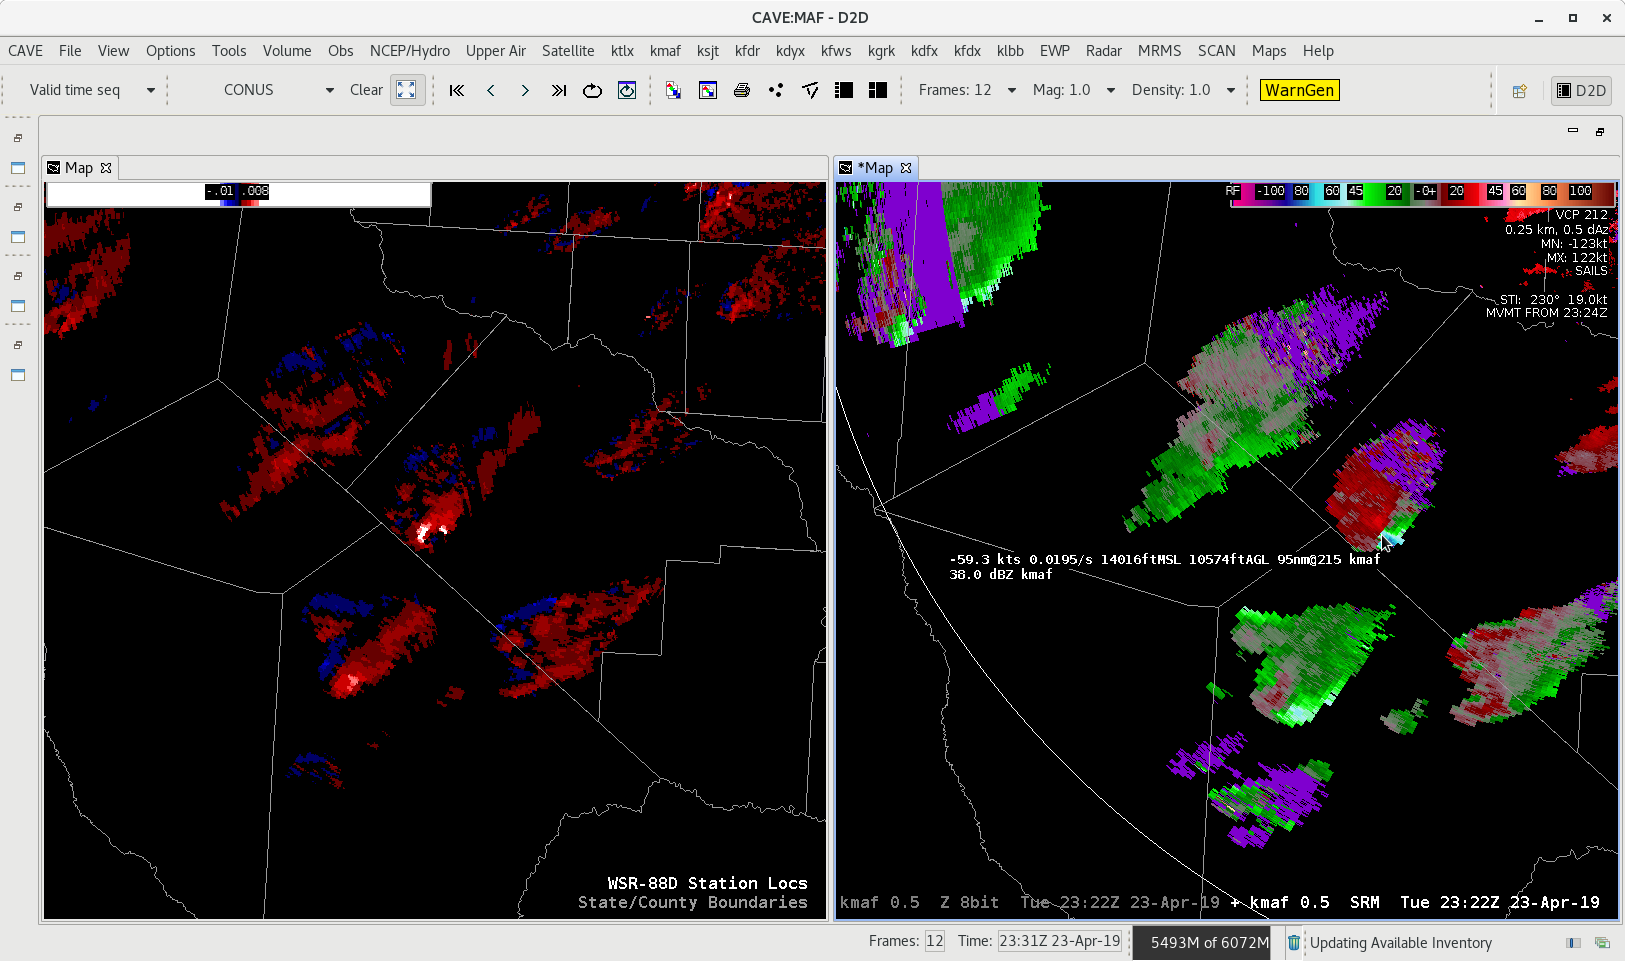
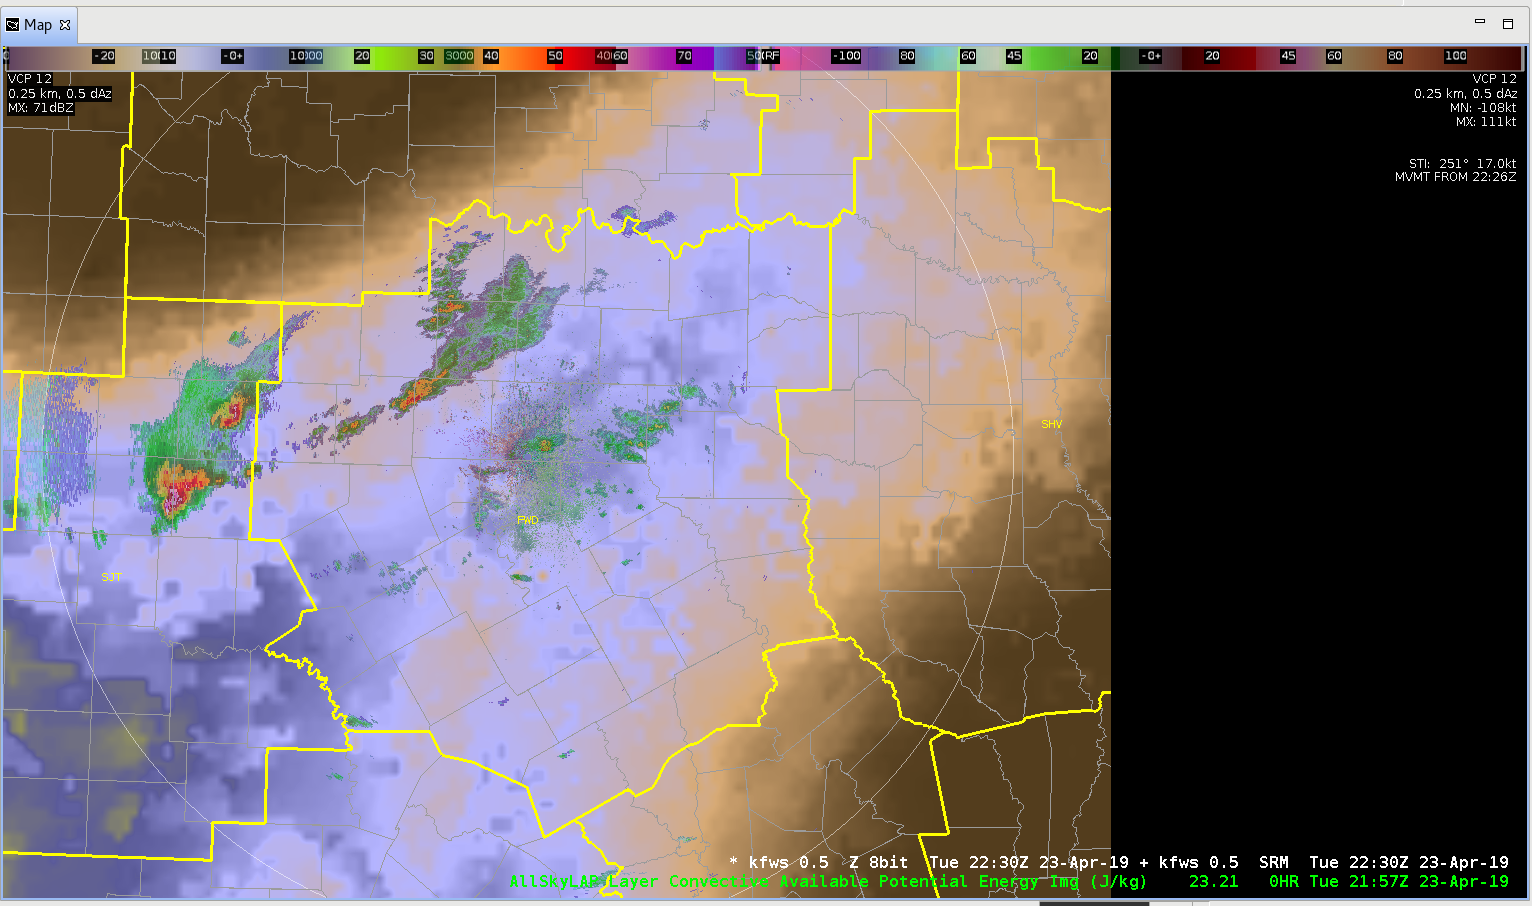
 Minimum Flash Area showed some utility in boosting lead time for storm re-generation. The storm in the center of the first image had started to weaken a bit after moving off of the outflow boundary that initiated it.
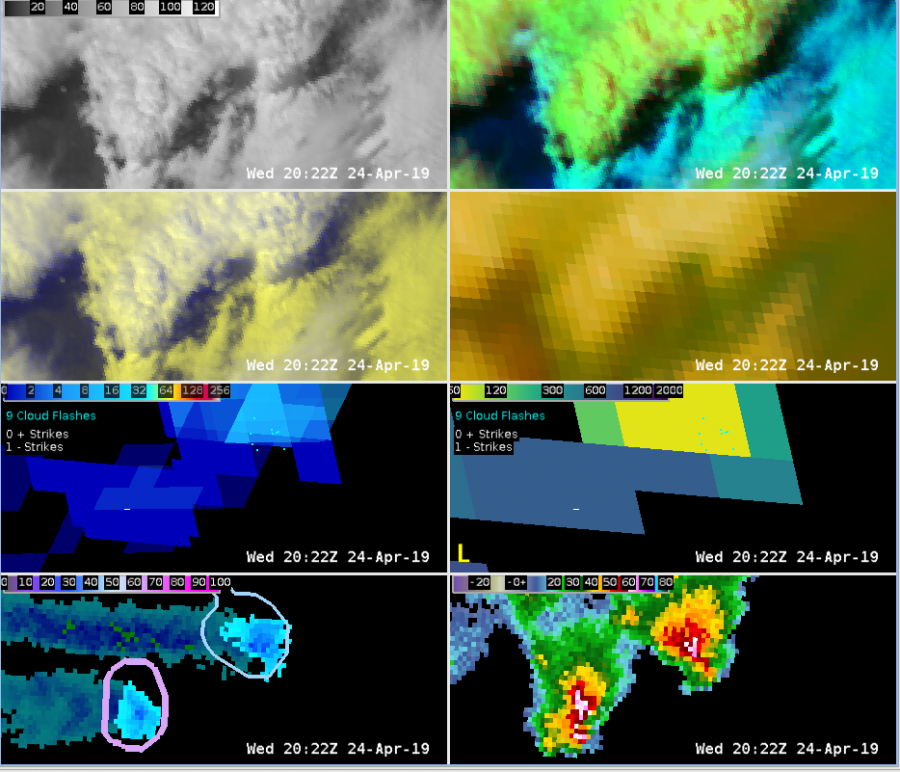

 Sandor Clegane


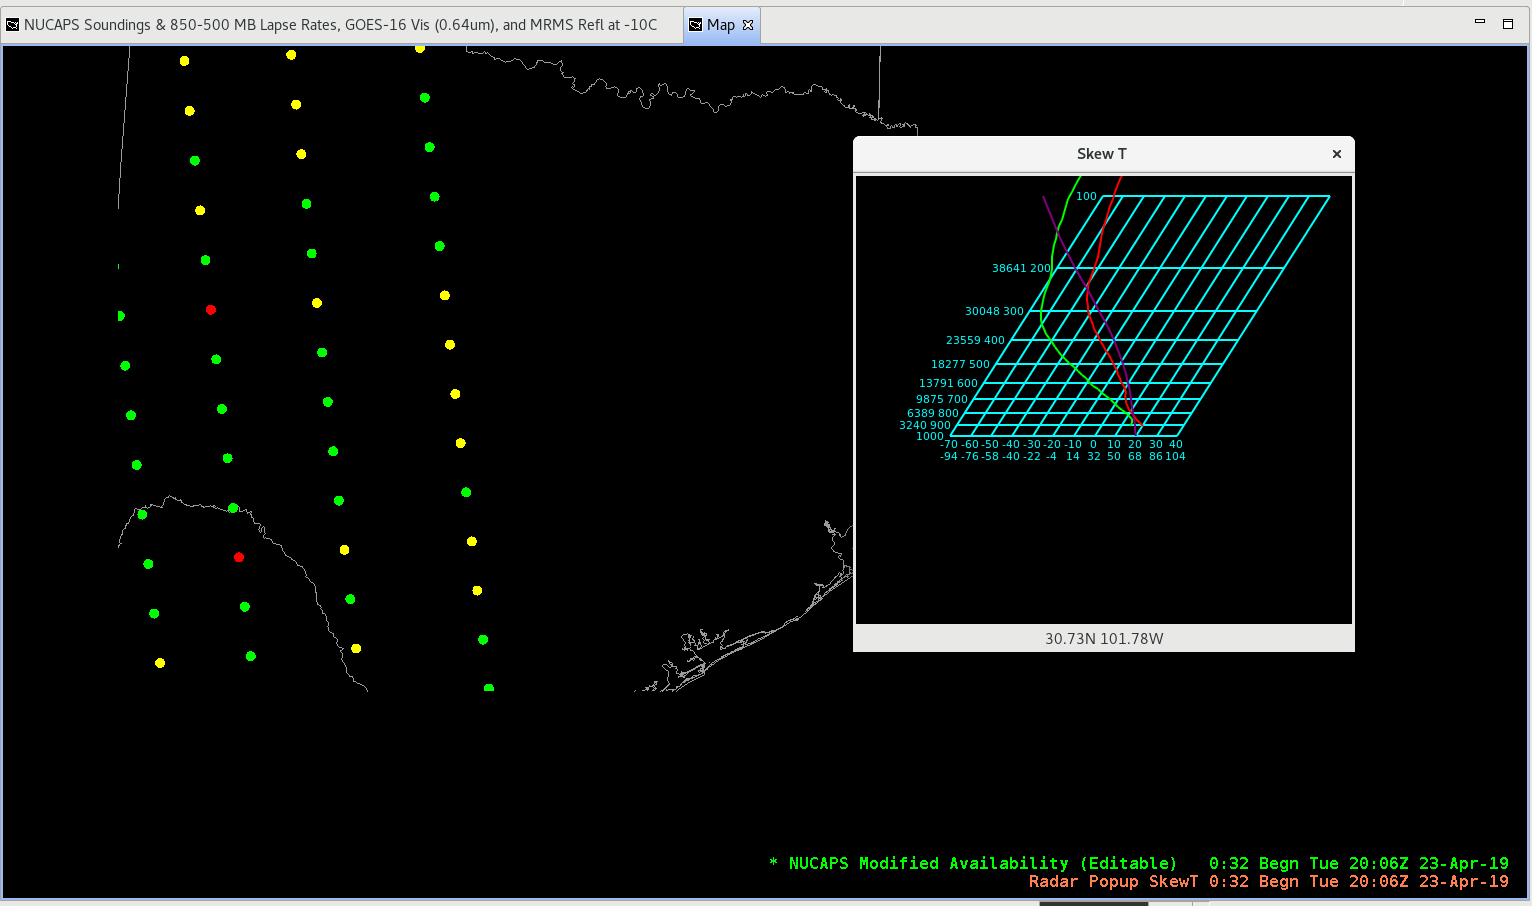
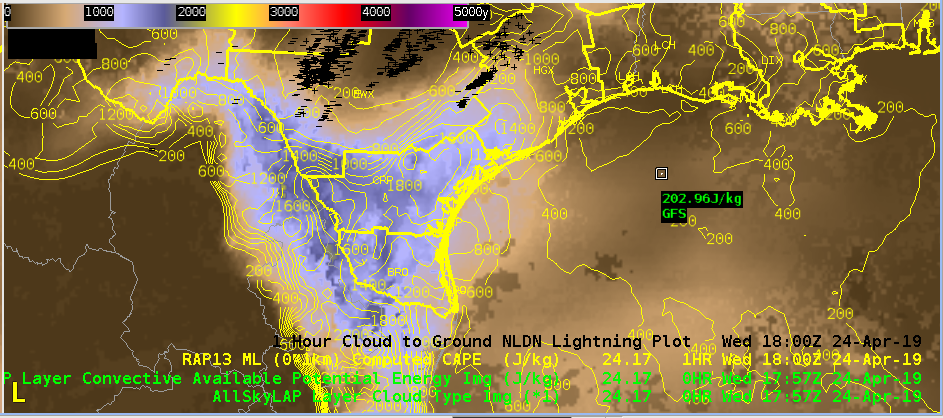
 After a quick adjustment to the lowest points on the sounding, this clearly looks like a severe weather sounding. I’m hesitant to rely on CAPE estimates given the dependency on the boundary layer, but indicies more reliant on mid level obs (LI) are still indicative of strong to severe storms. This compares well to all-sky LAPS retrievals (above, right).
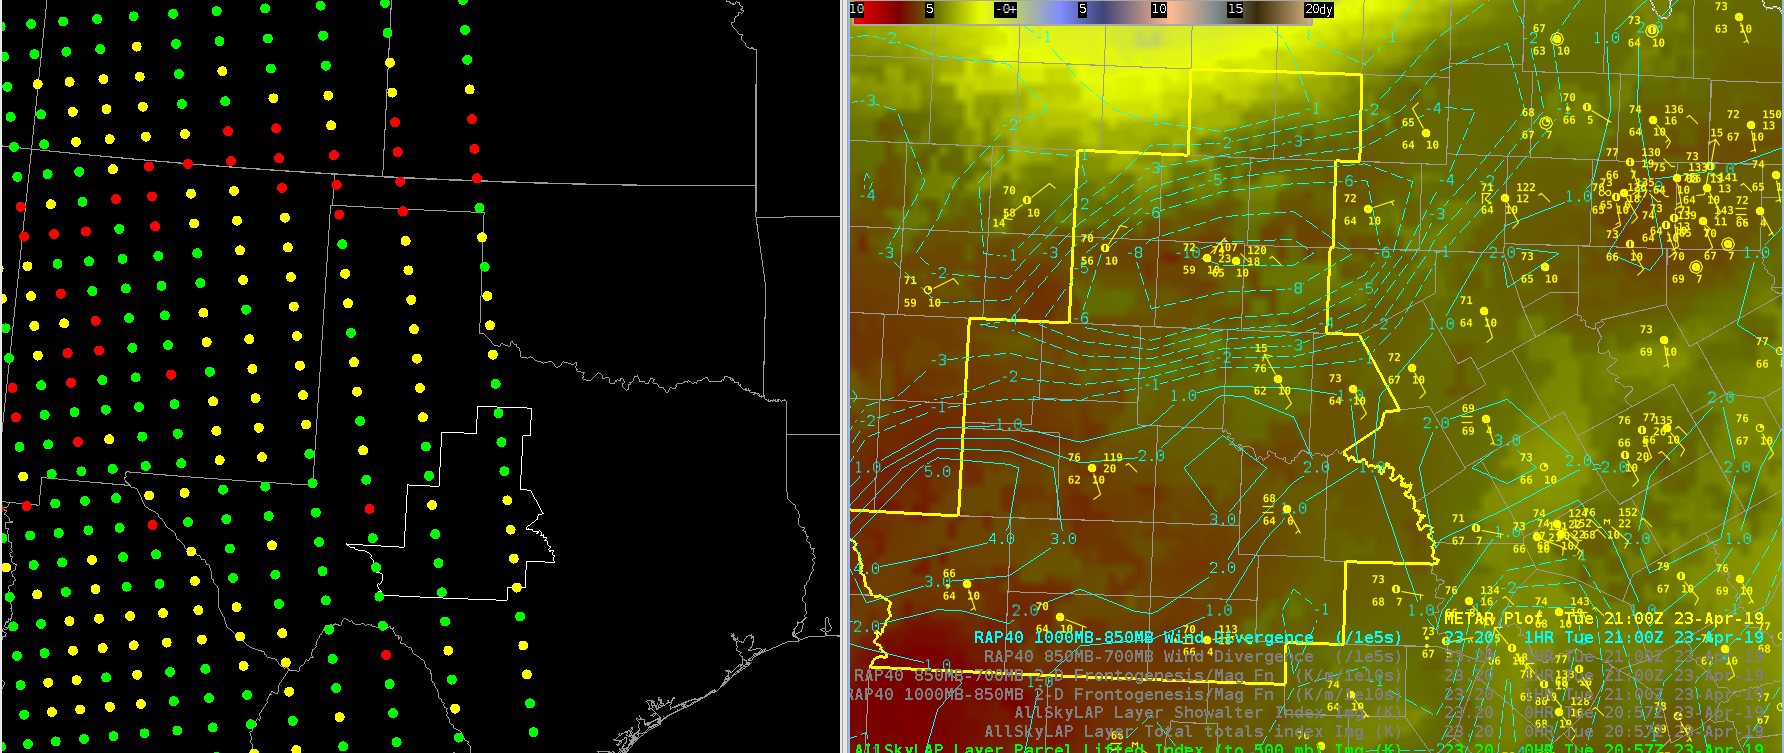
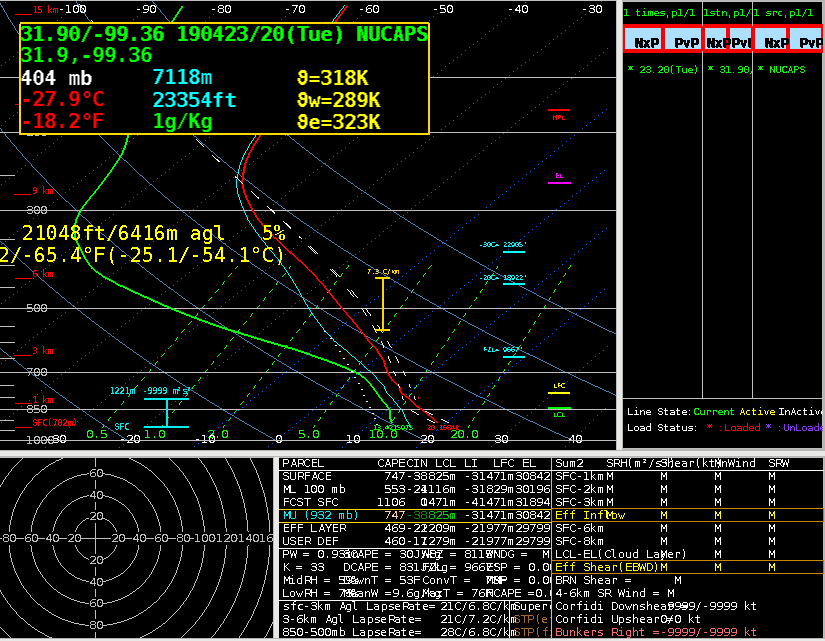 In typical operations in which I do not have access to these products, I would rely on the SPC mesoanalysis (below) to estimate instability. The NUCAPS and LAPS All Sky retrievals do somewhat increase my confidence that the mesoanalysis is close to reality. However, Given my conceptual model of how the atmosphere should be behaving, I was already highly confident that the atmosphere is quite unstable in the warm sector, so the increase in confidence from NUCAPS/LAPS is somewhat limited.
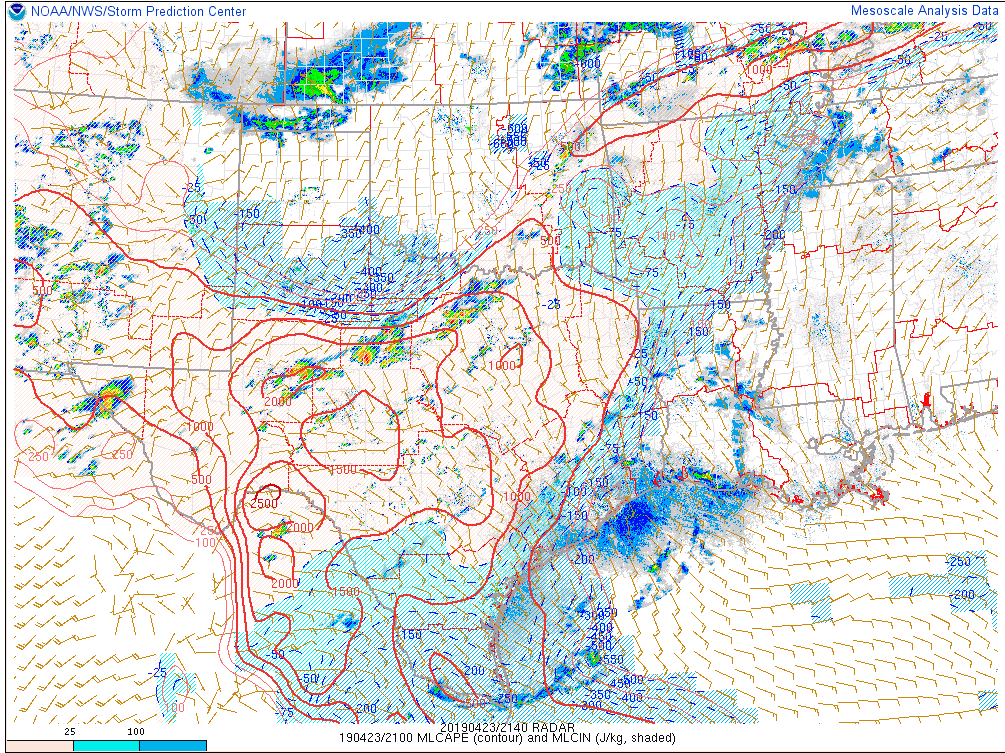 Sandor Clegane