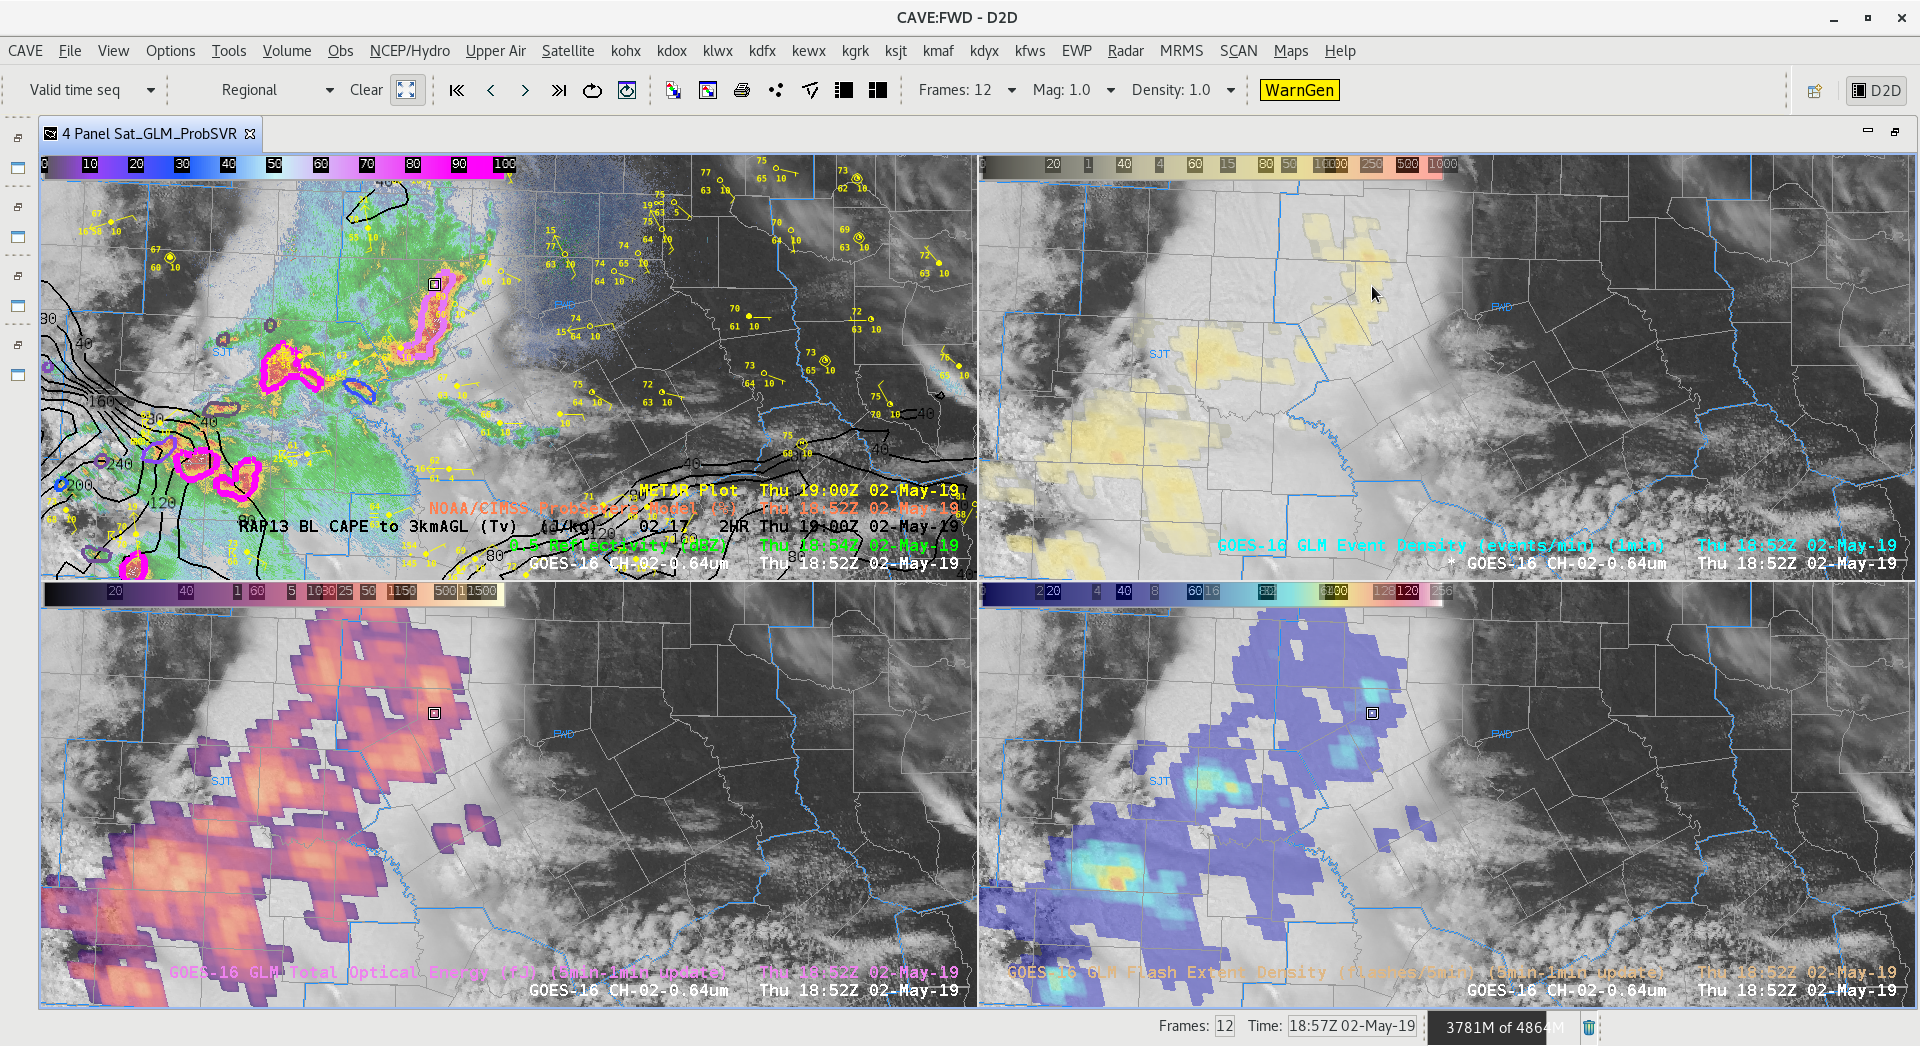
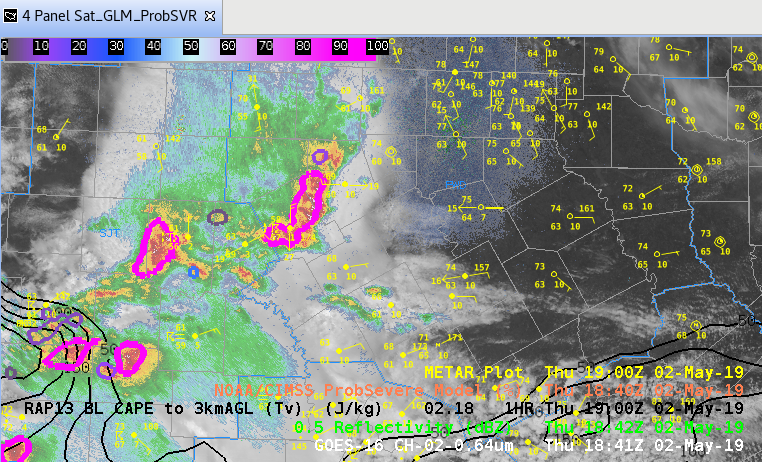
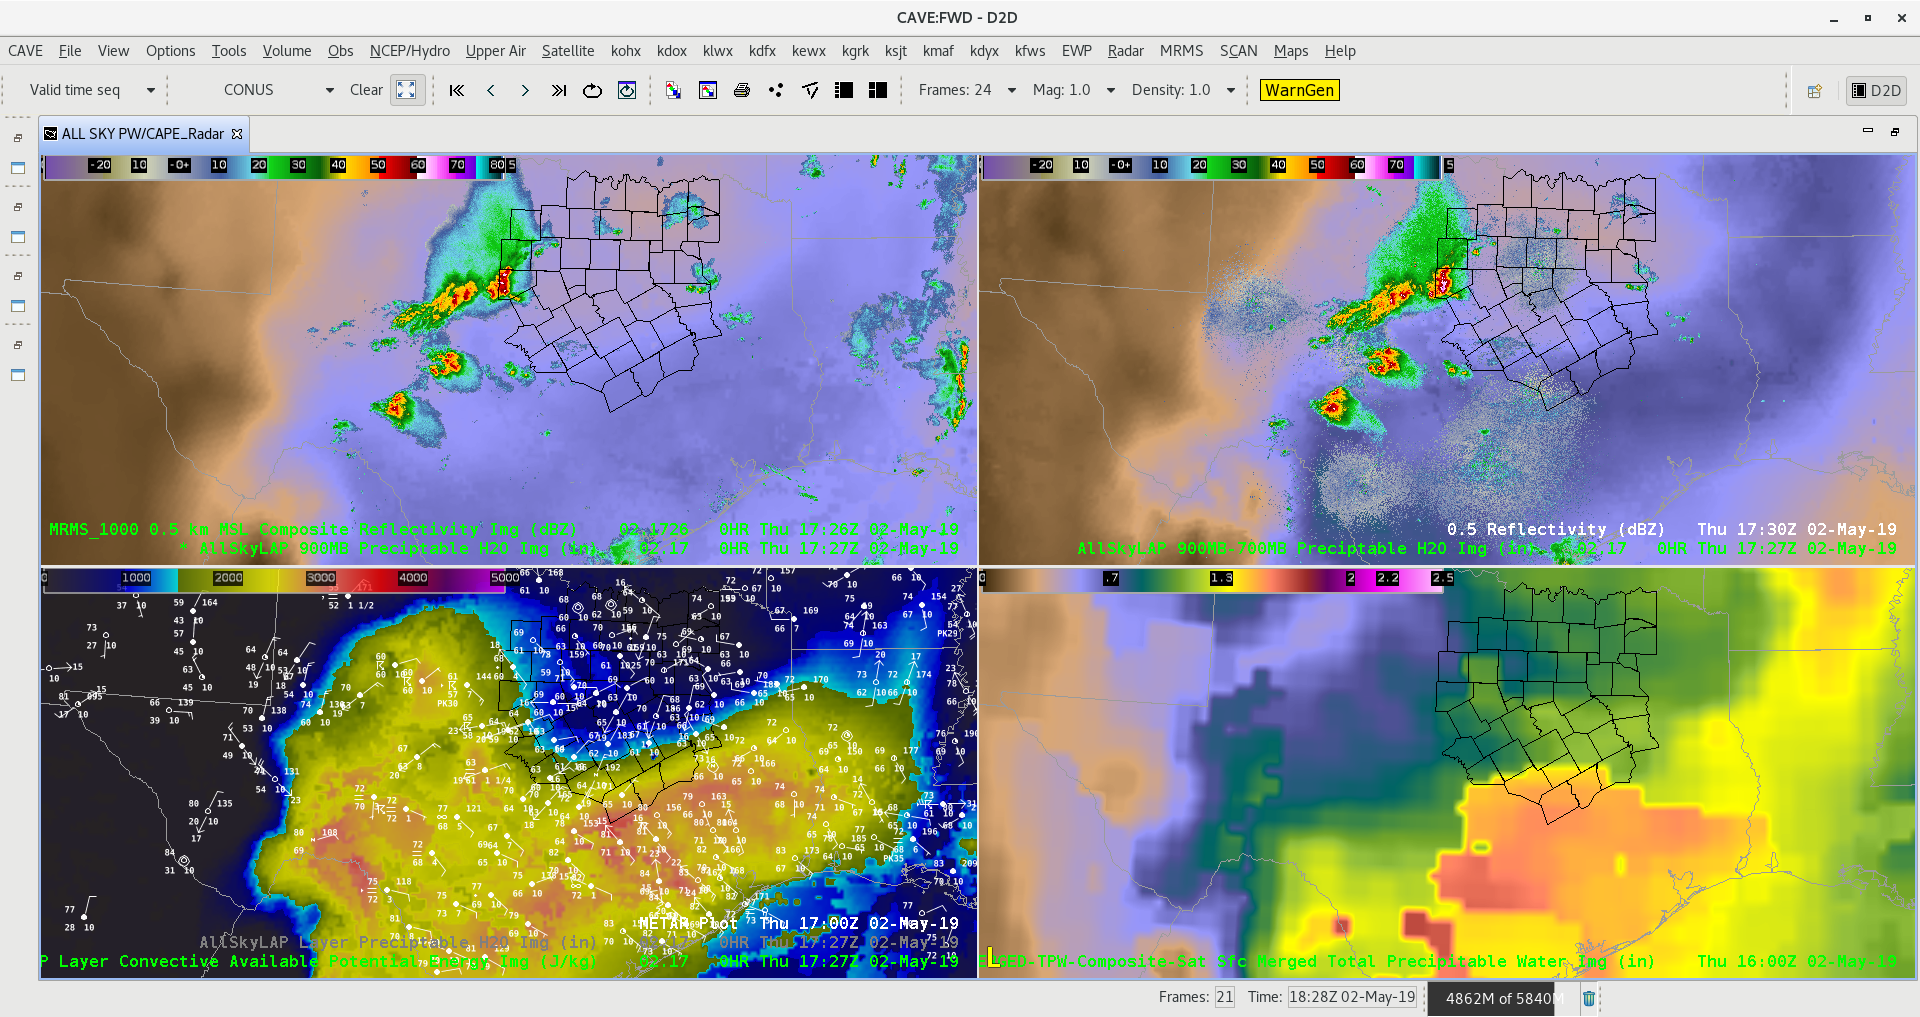
For the first time this week, finally got a chance to examine CI using GLM data. I built a 4 panel that worked well for me (ENTLN CG and cloud flashes on each panel):
top L: 1 minute visible with flash extent density (FED) and event density (ED)
top R: 1 minute Vis/IR sandwich with 1 minute total optical energy (TOE)
bottom L: 1 minute Day Cloud Phase Distinction/Day Convection RGBs with average flash area (AFA)
bottom R: MRMS -10C reflectivity with minimum flash area (MFA)
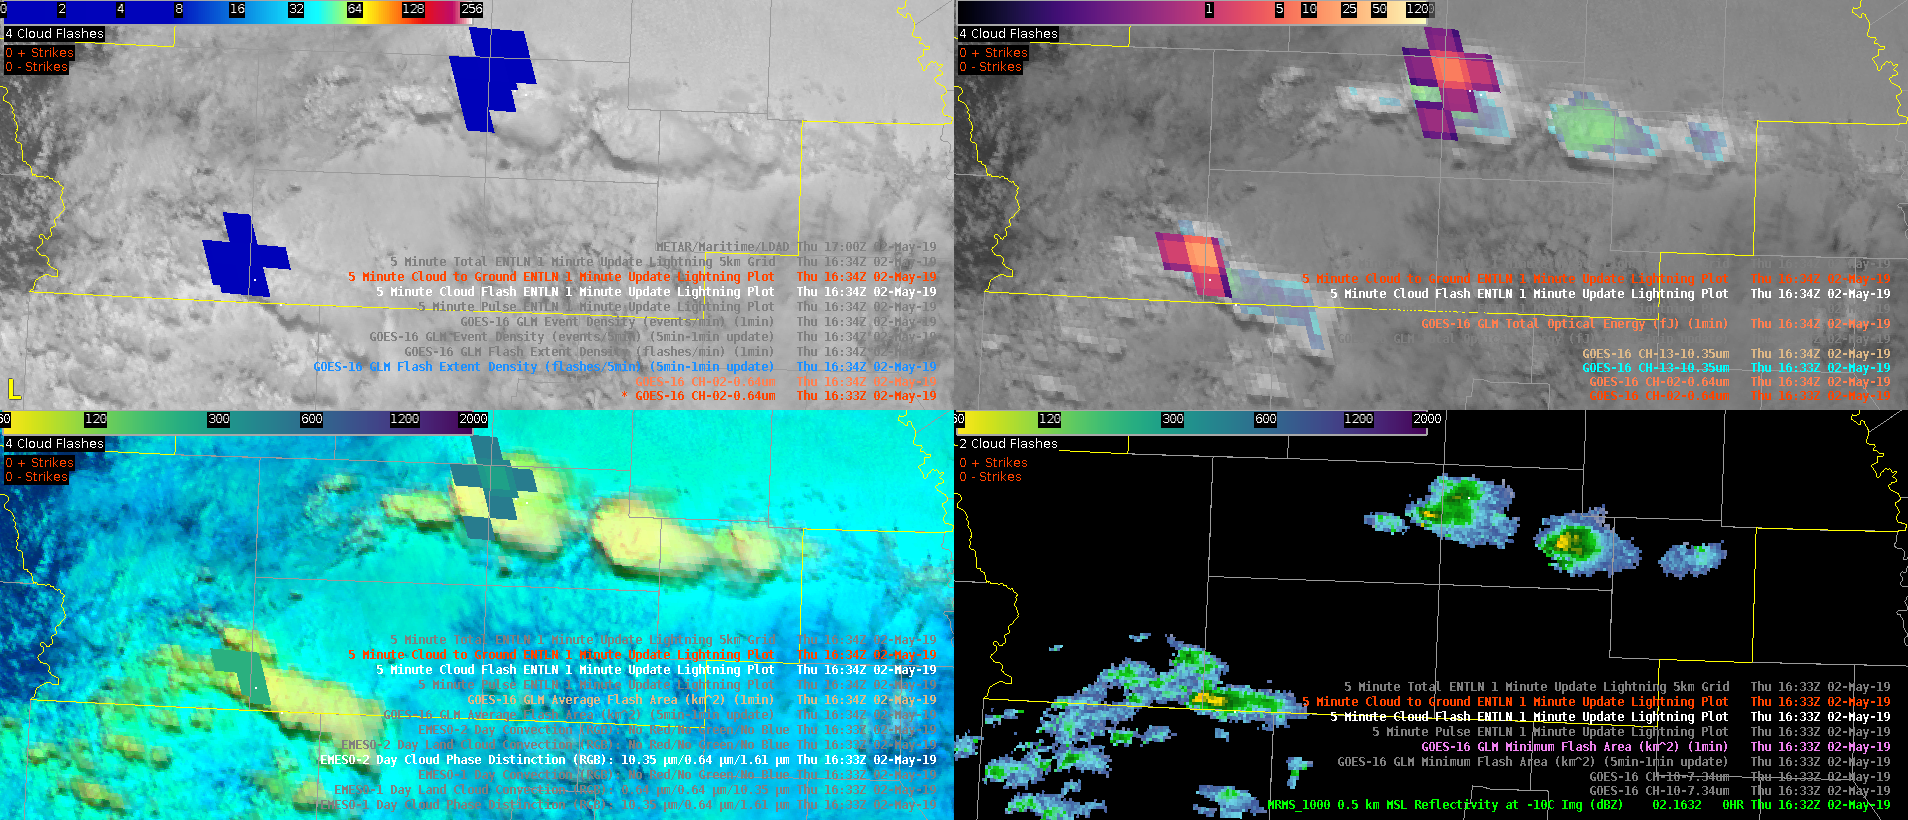
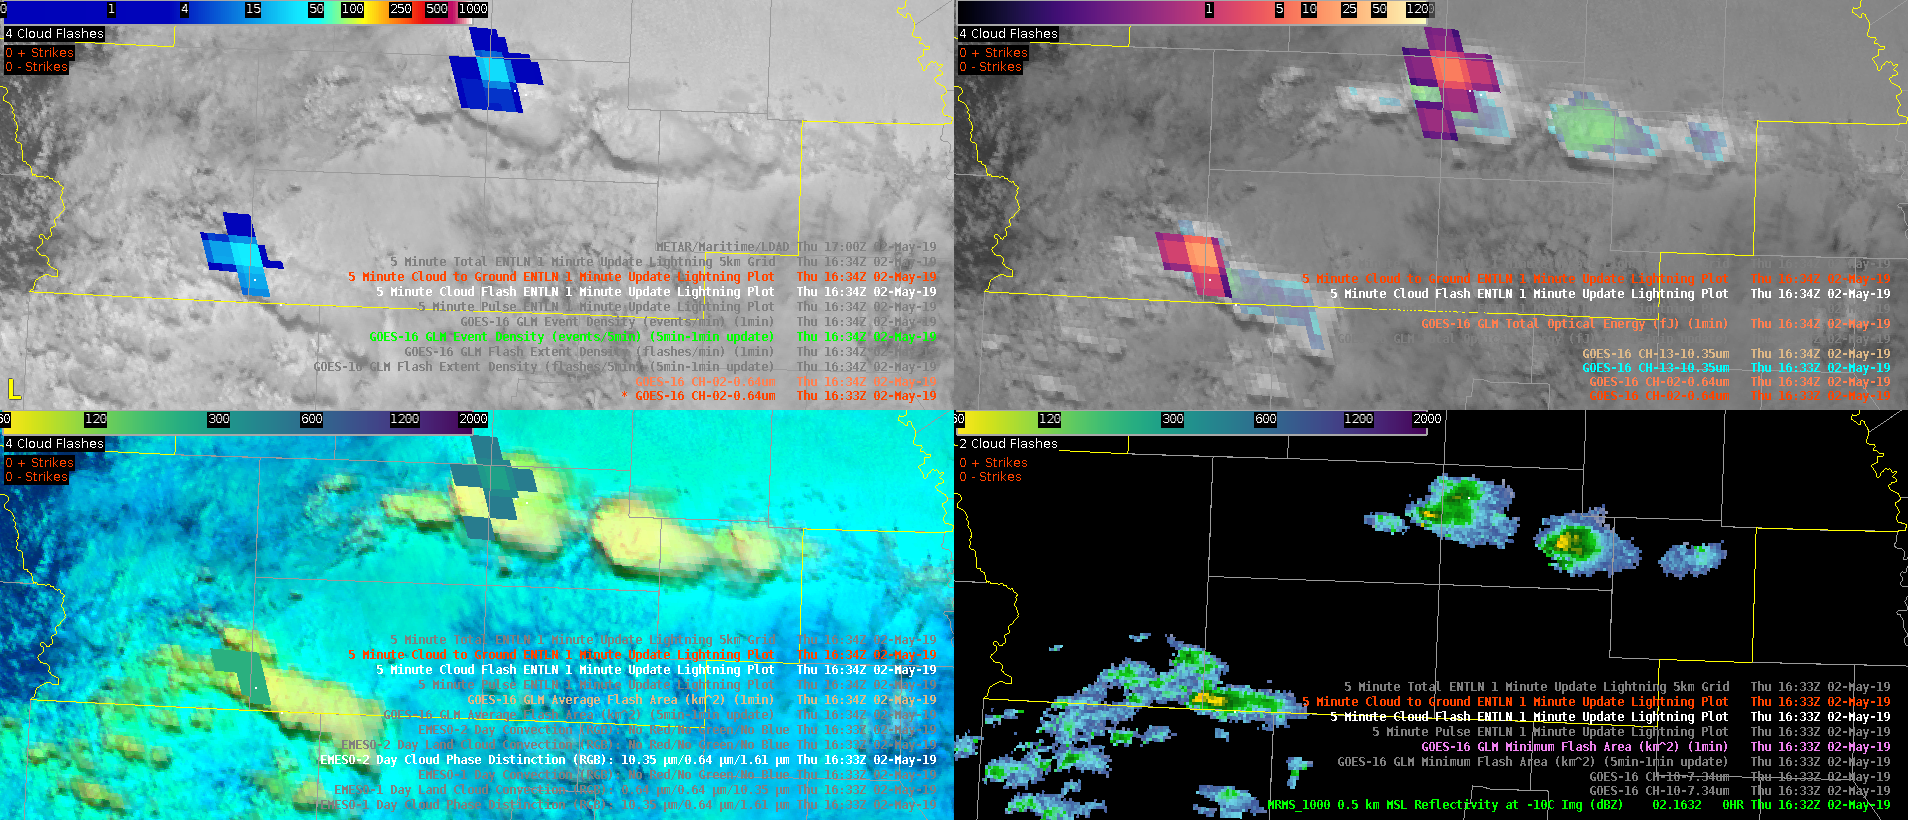
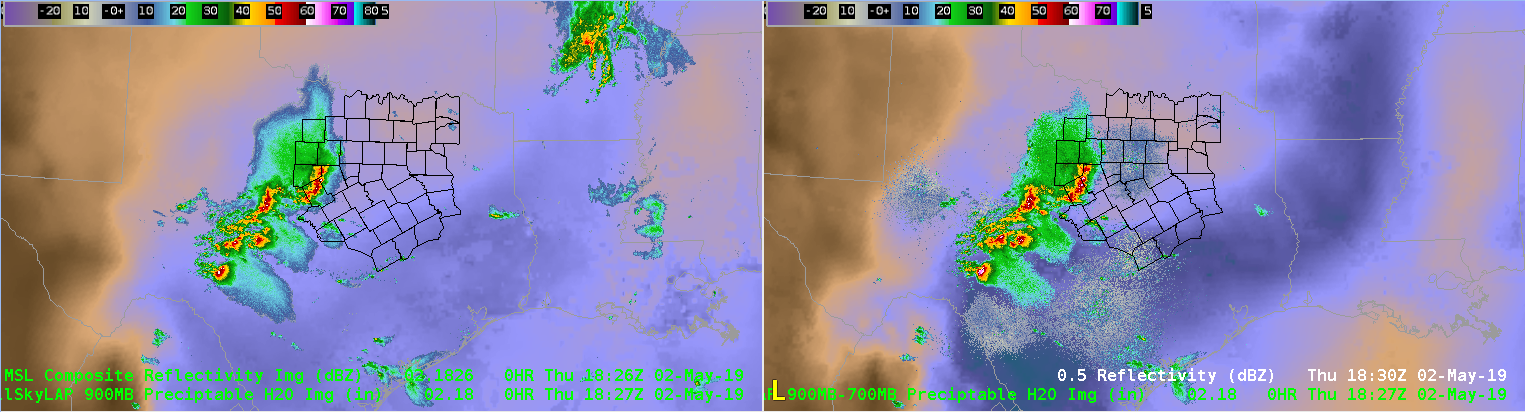
Agitated cu developed just prior to this image at 1634z. These two images highlight the differences between FED (upper L of the top image) and ED (upper L of the bottom image). You’ll notice that the flash extent density is much more muted than the event density. You can really hone in on the strongest initial convective cores with the ED and TOE compared to the FED.
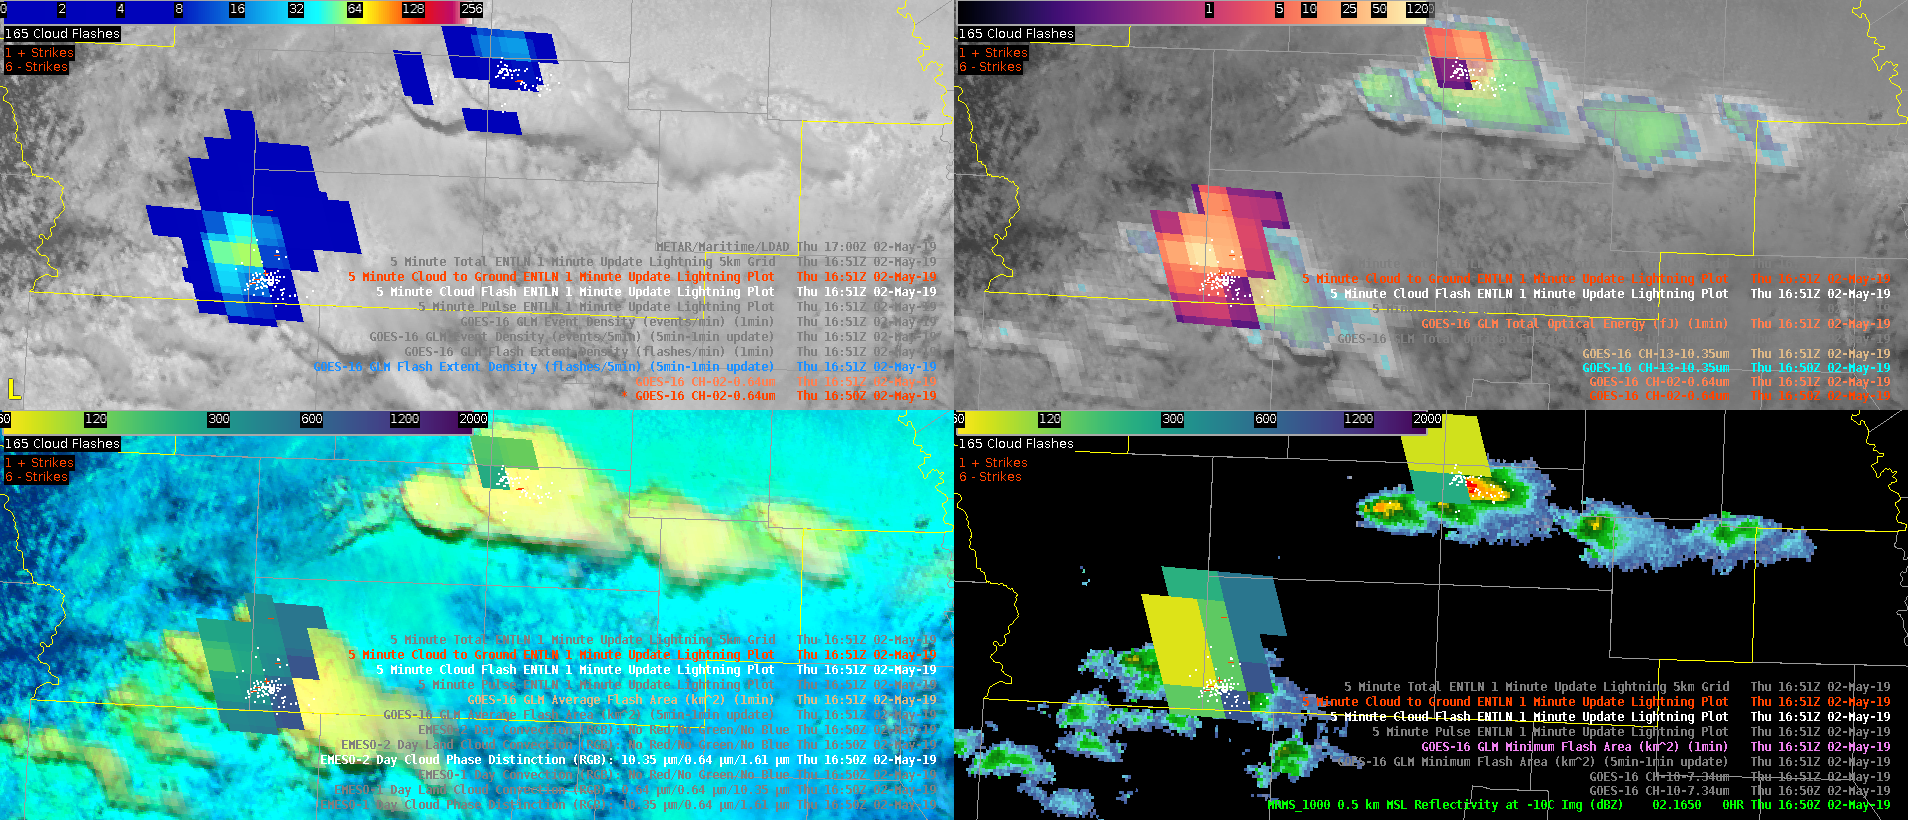
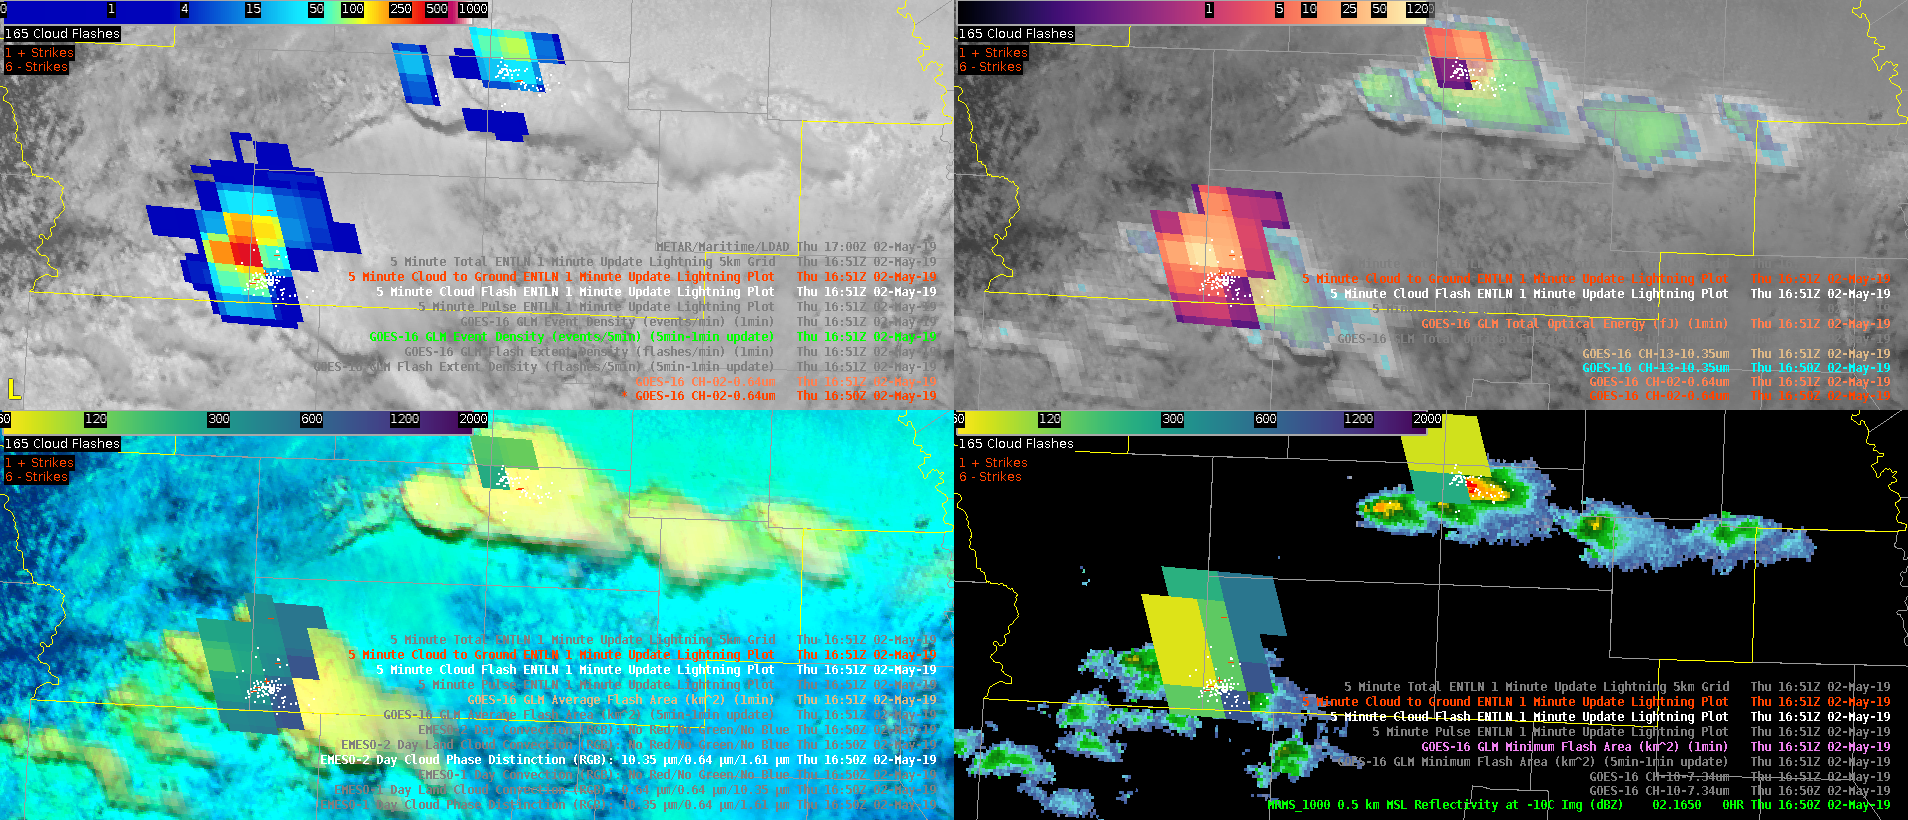
Next two images are at 1651z with FED highlighted in the top image and ED in the bottom. Again, your eye is immediately drawn to the event density vs. the flash extent density. Also, your total optical energy corroborates with high values on the southern cell (at least with respect to electrical activity…radar showed both cores with similar 50 dBZ heights).
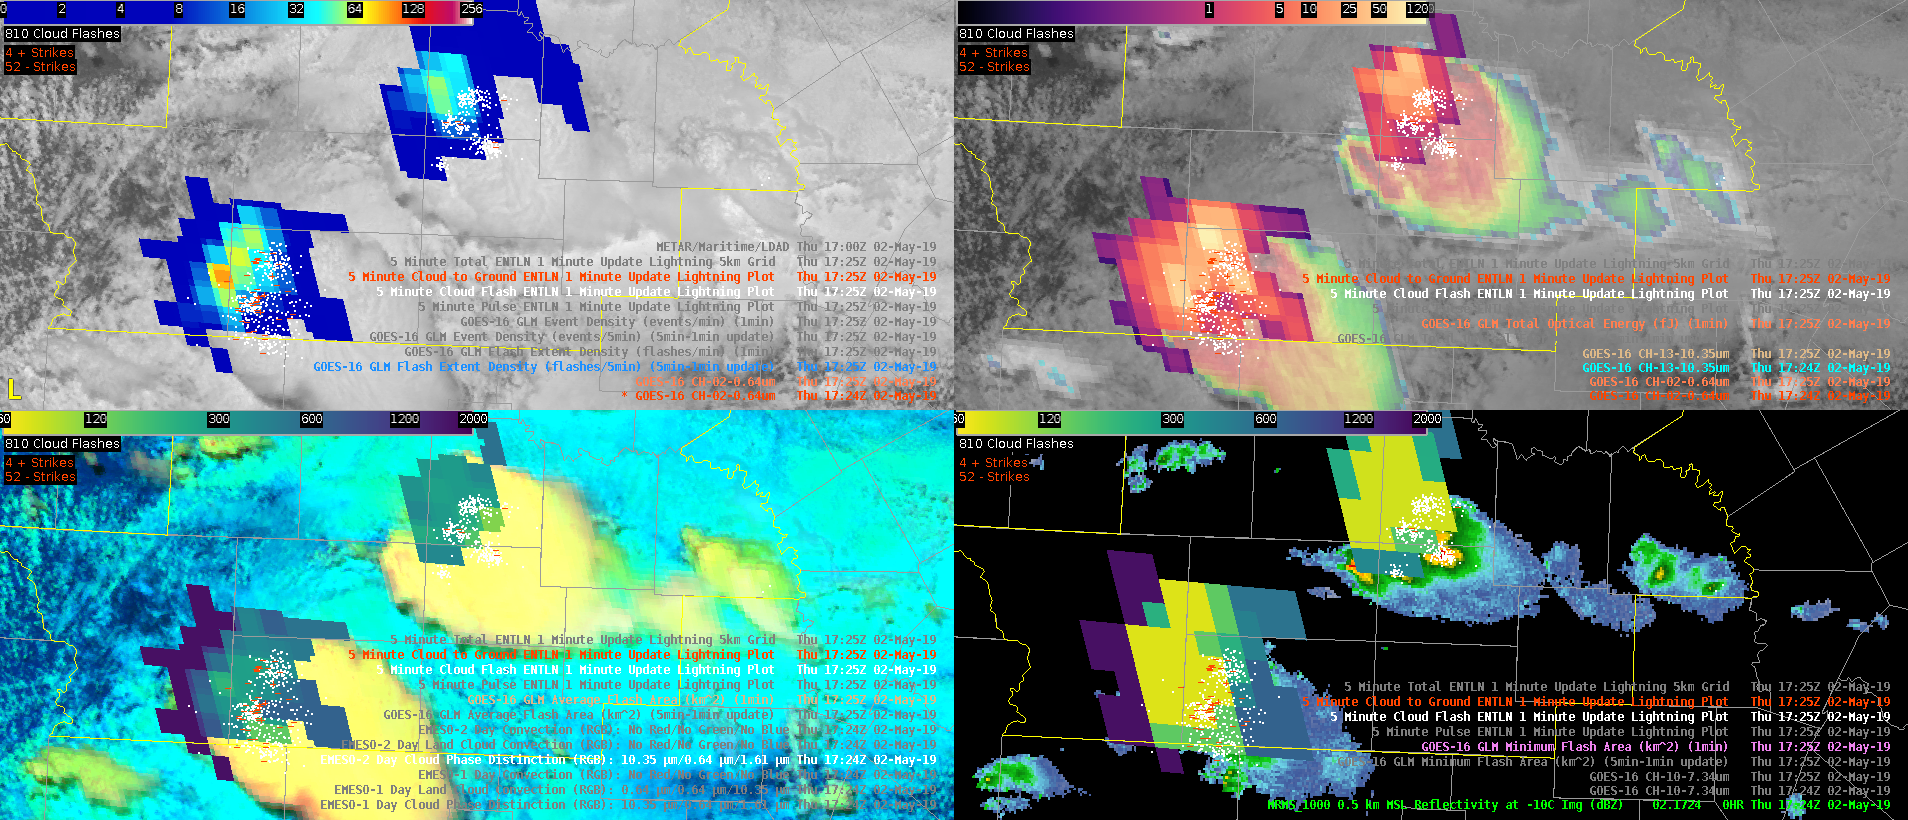
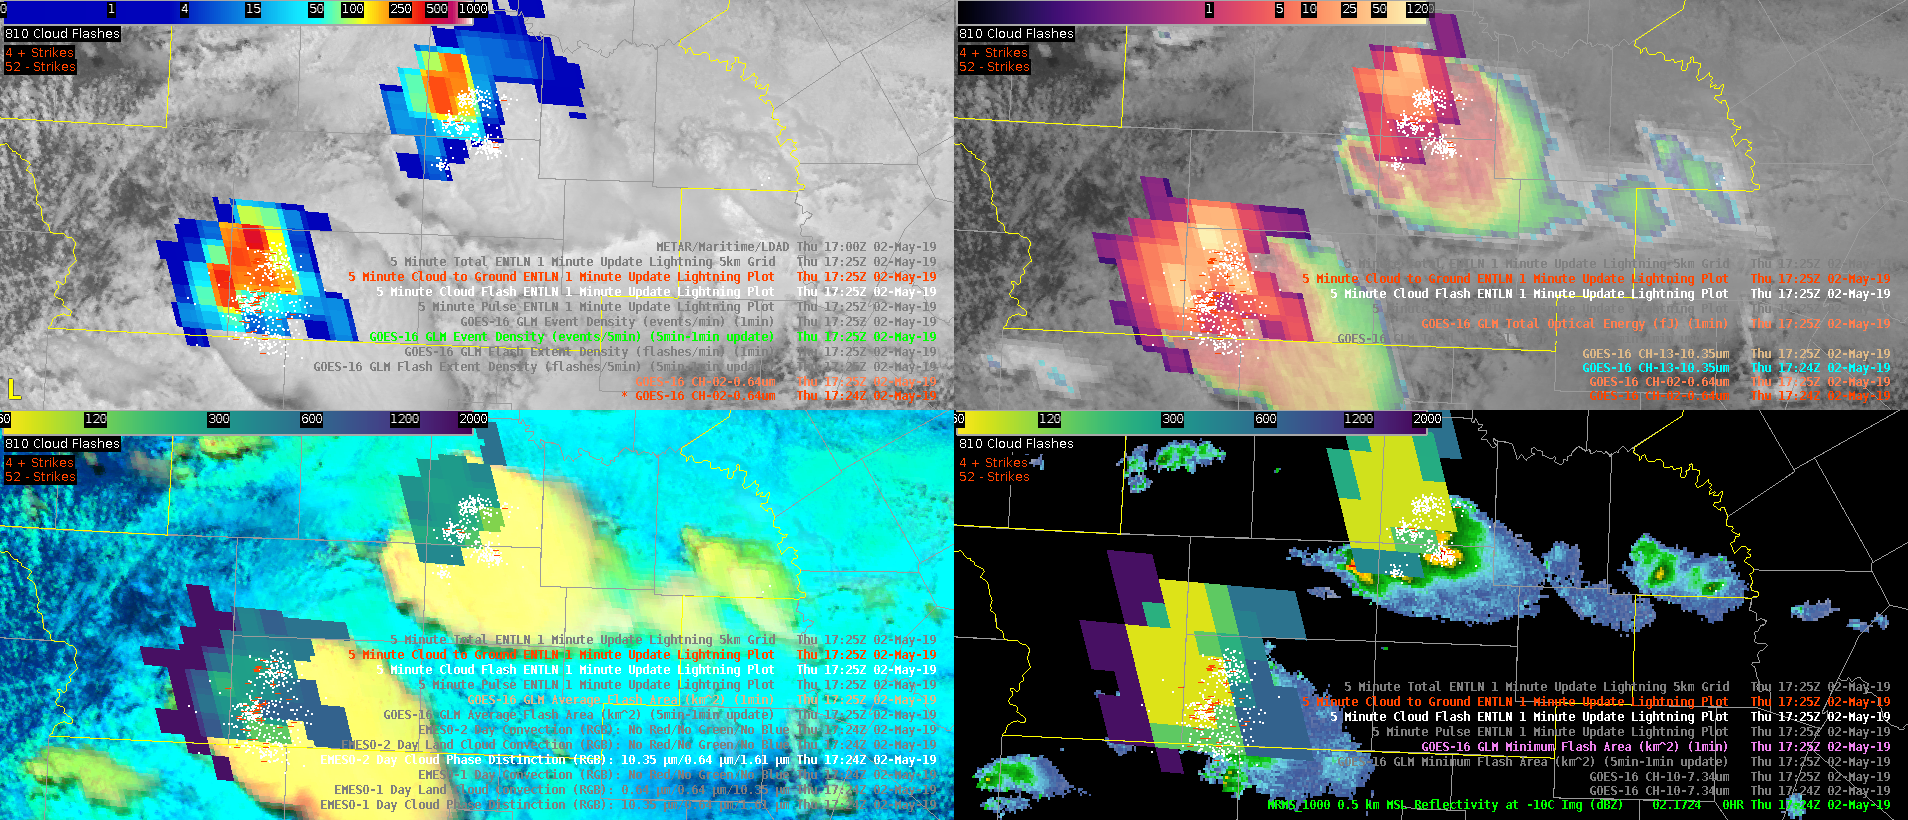
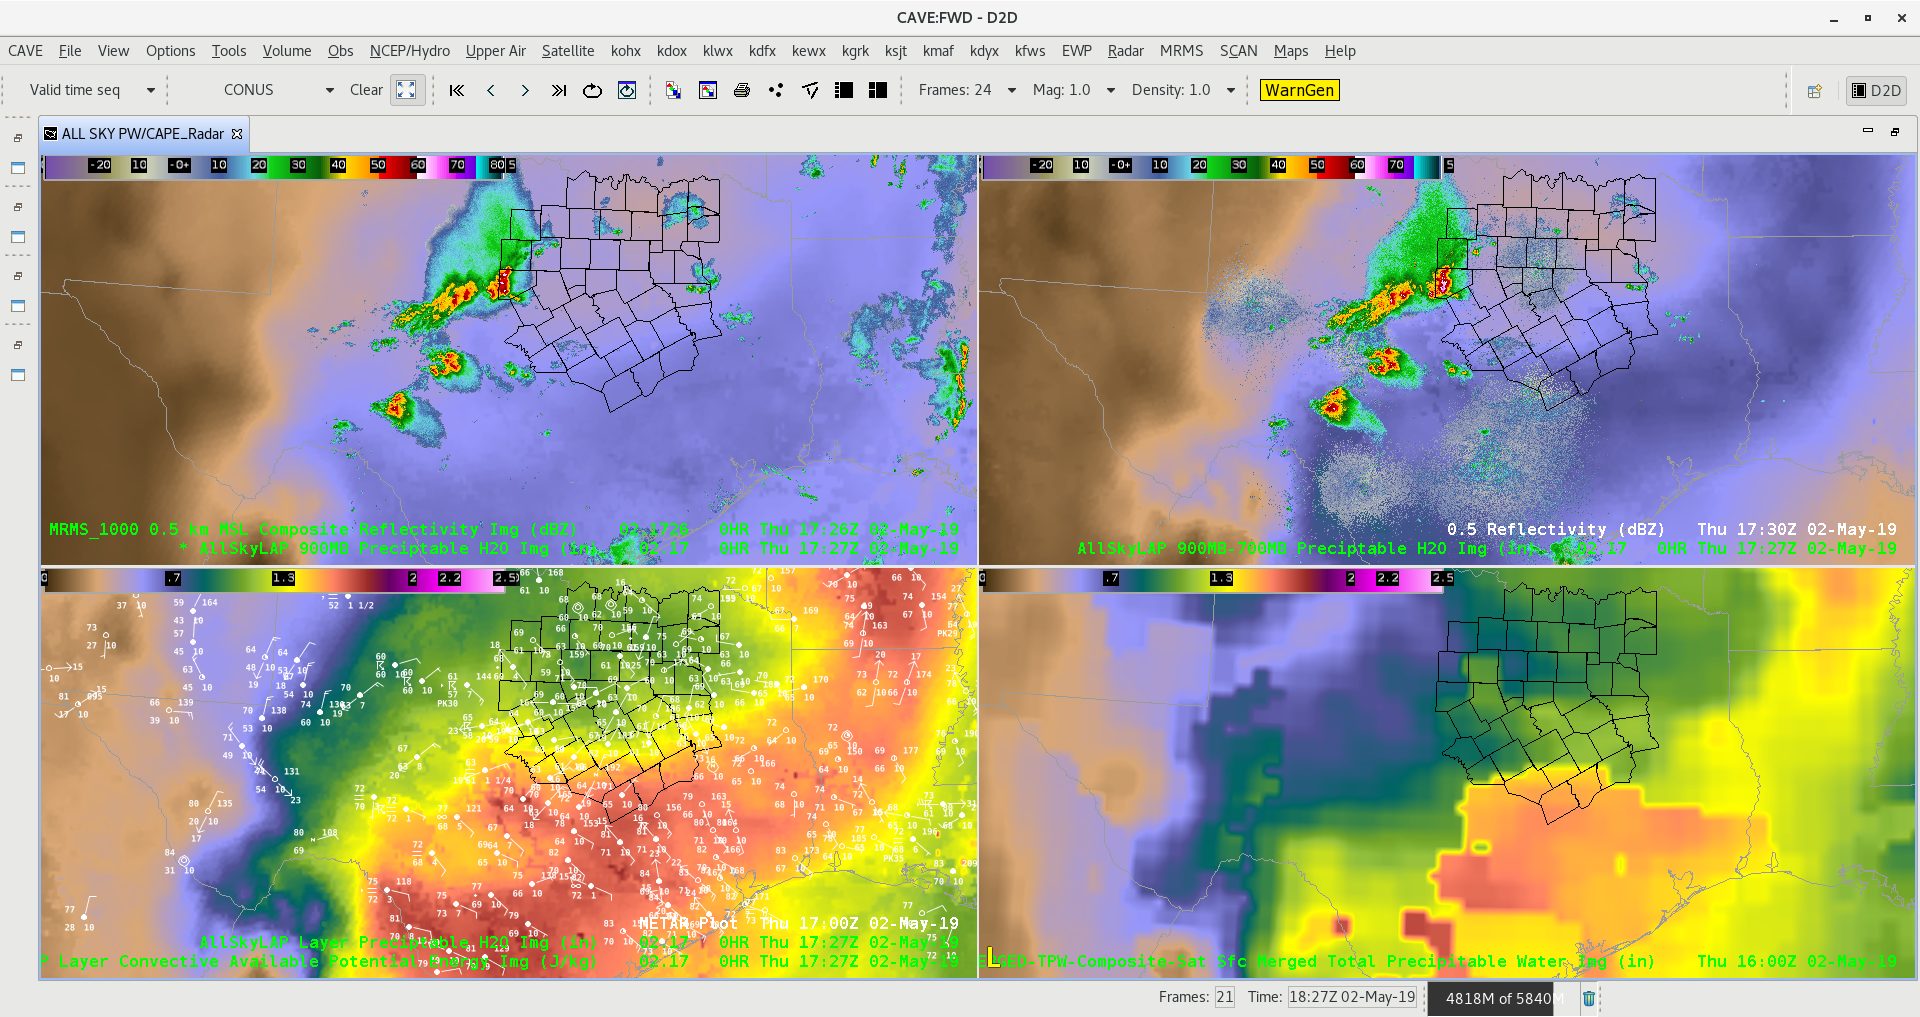
By 1725z, both event density and total optical energy are beginning to overwhelm and lose granularity. At this point, flash extent density highlights the more active cores. ED and TOE are both still useful, but the distinct advantages they showed earlier in convective evolution have degraded as convection has matured.
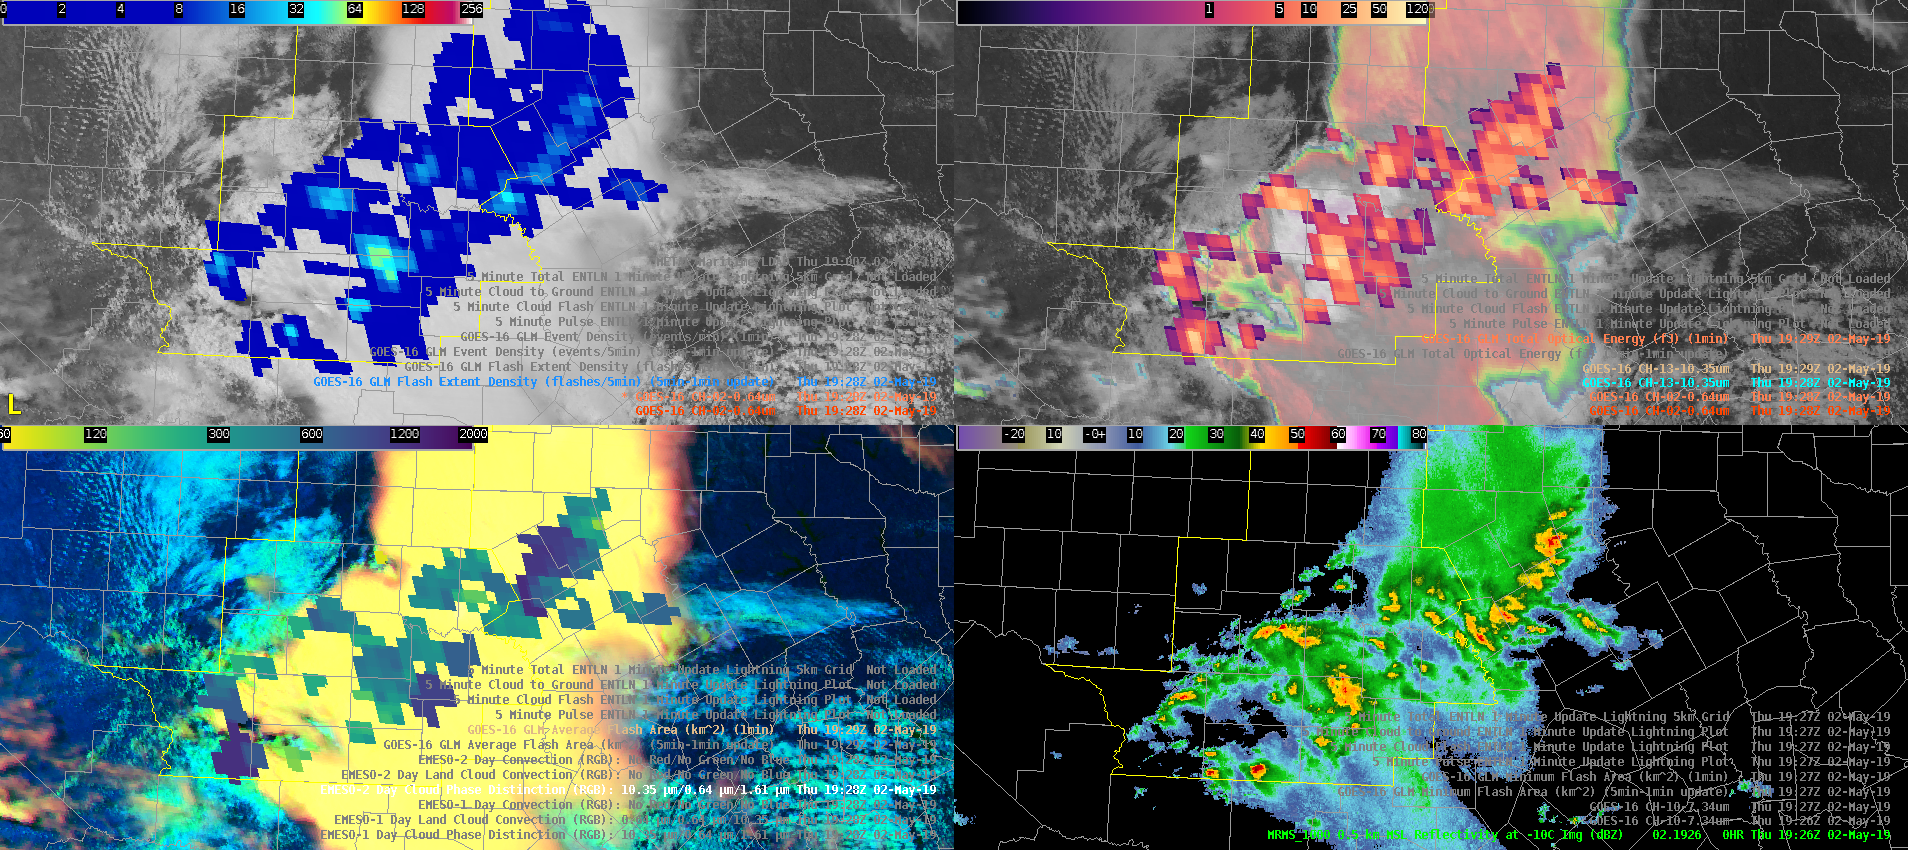
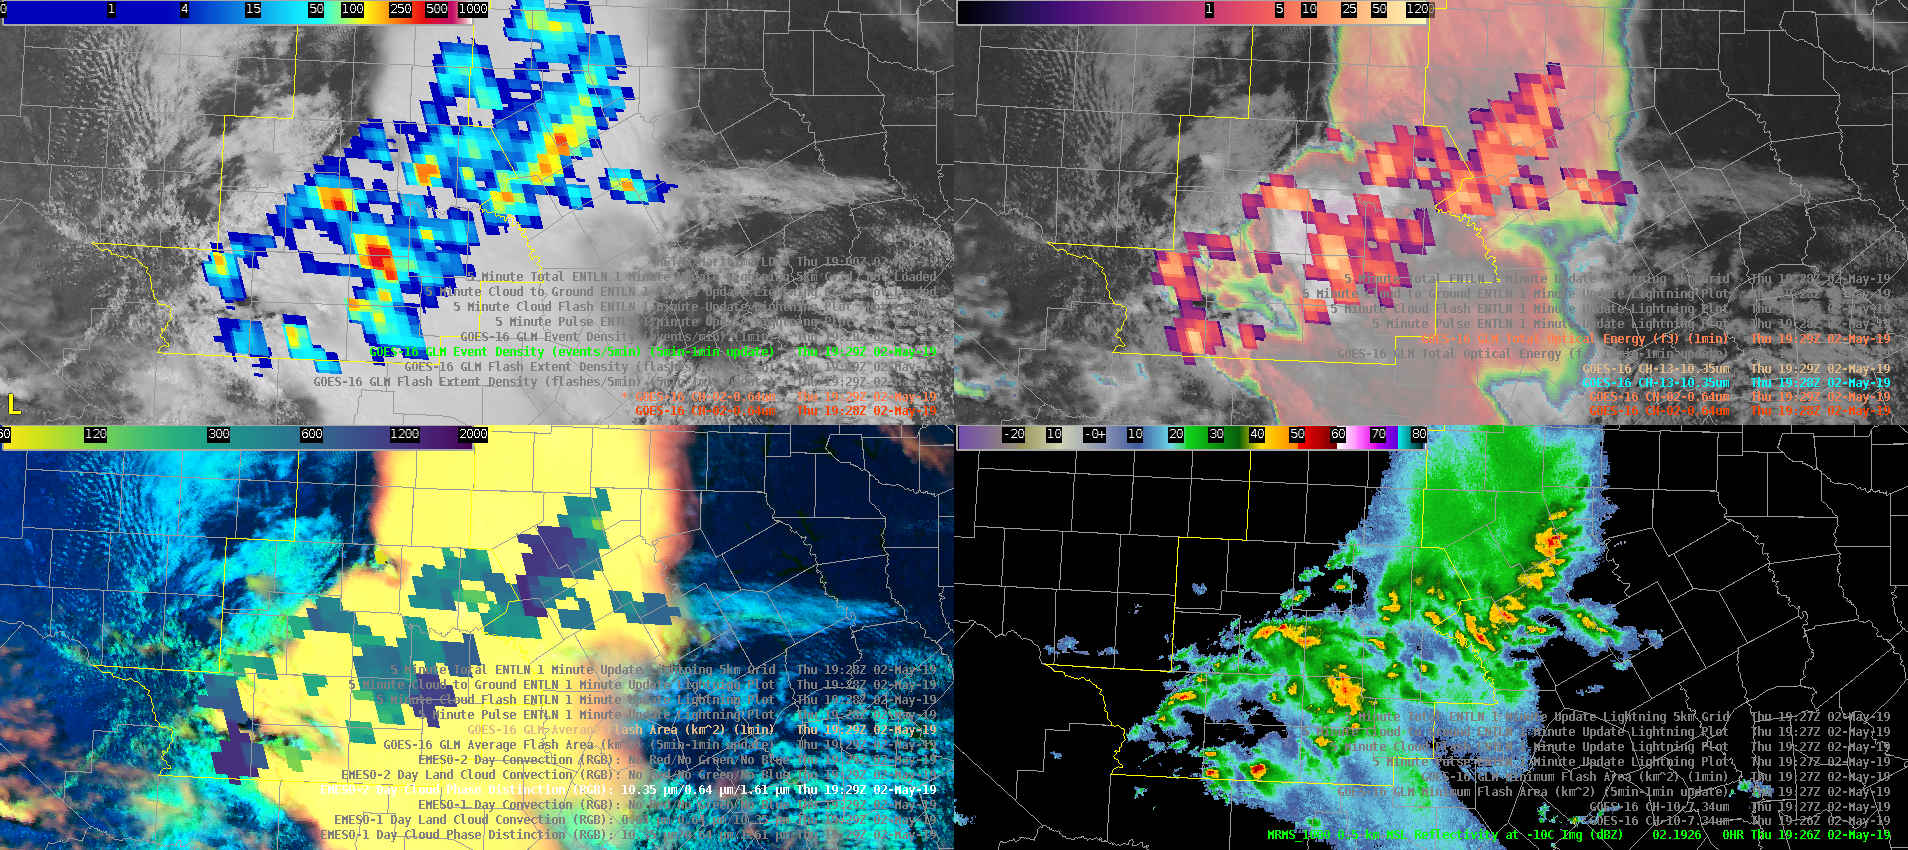
by 1929z, it’s fairly obvious that the advantage TOE had in highlighting distinct cores early is no longer. While you can see smaller areas of enhanced optical energy, it is far noisier. We’ve noticed this throughout the week that TOE’s usefulness seems to wane as convection matures and storms are extremely electrically active. Flash extent density seems to be a better choice at this point compared to event density, as was the case at 1725z.
A few of the biggest takeaways…Total optical energy (1 minute) serves a very useful purpose for CI as it can highlight areas of new updraft growth, but loses impact as storms become mature and lightning becomes well established across the area. Event density would seem to be a better choice for CI compared to flash extent density as well.
The four panel that I built I’ve found very useful for CI or subsequent new updraft development by combining the best of visible imagery, RGBs (are utilized to diagnose glaciation within clouds), and the MRMS -10C reflectivity. Time for more coffee.
–Stanley Cupp

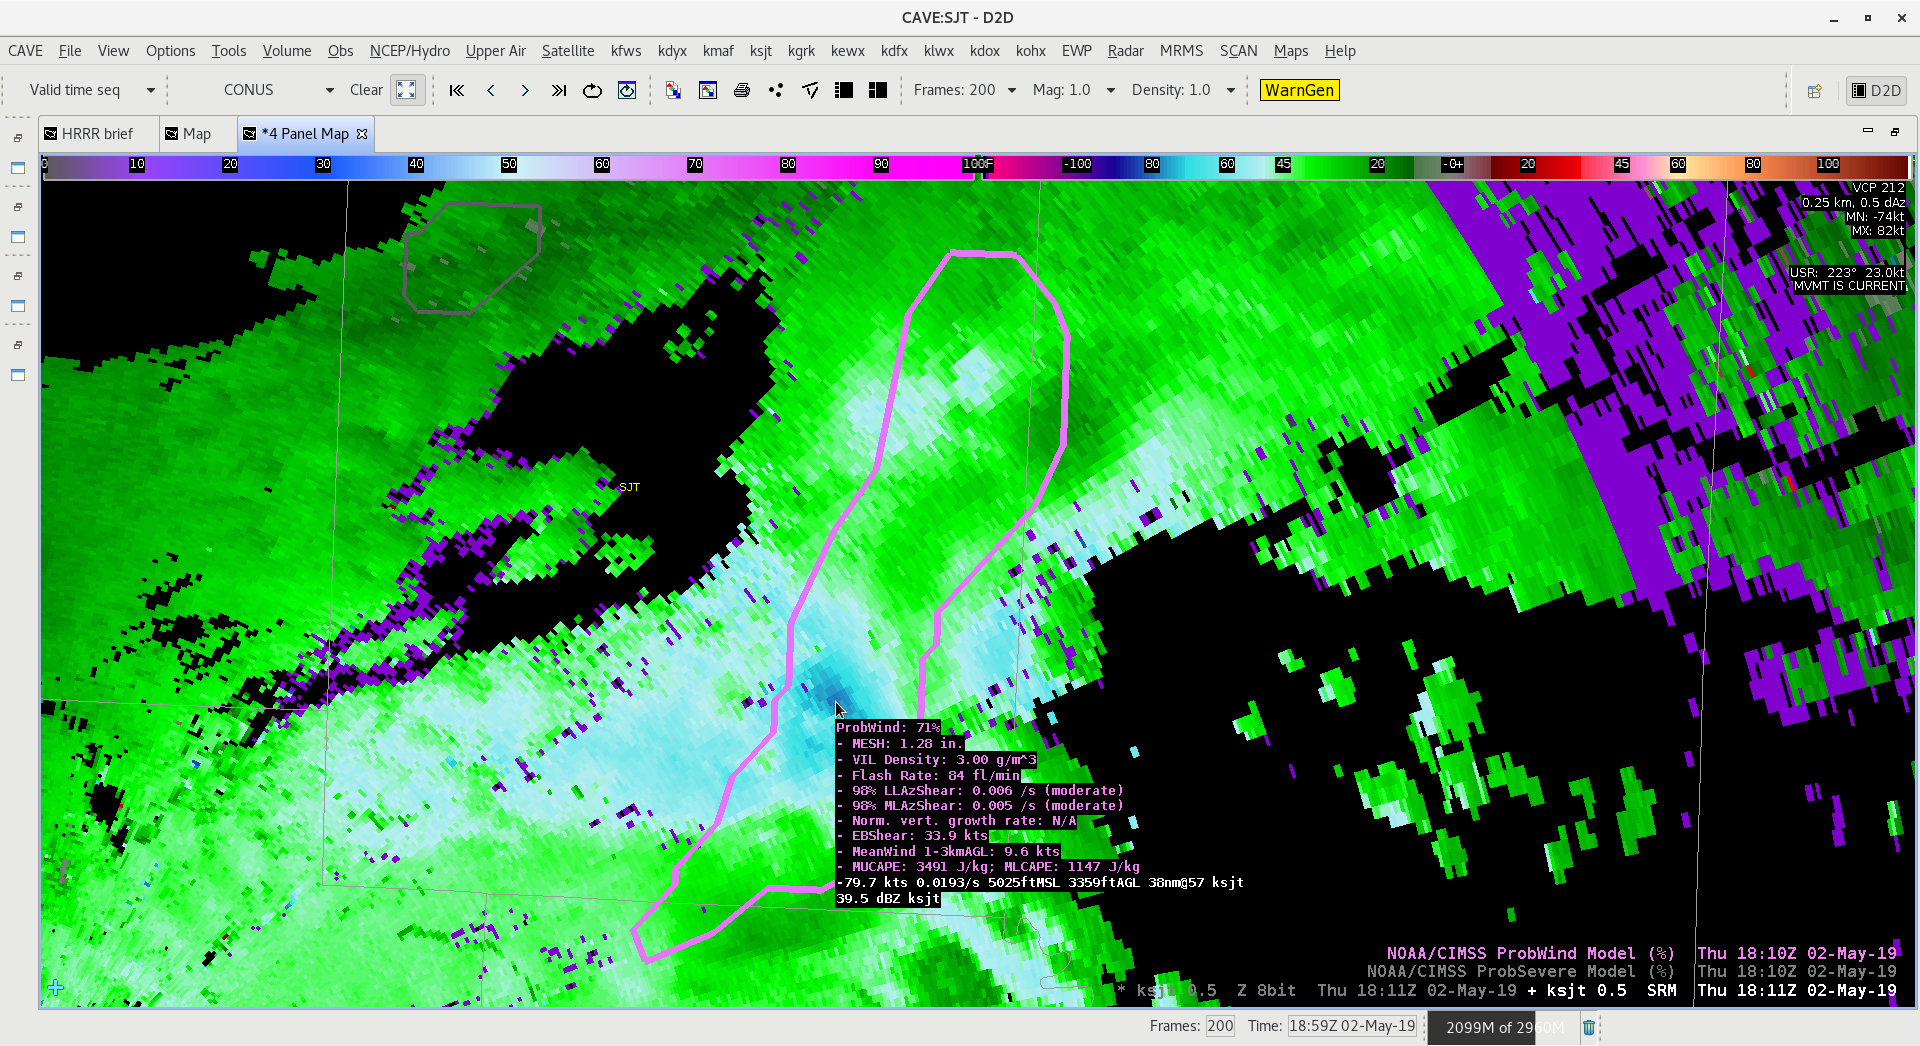 Here are two cases where ProbWind produced surprising results. In the case above, a very strong wind signature descended from a linear storm segment. BV data near 80 knots in the lower 3 scans, however ProbWind was only at 71%. I would have likely issued a warning here without ProbWind, however the ProbWind data made me question mid-level winds within the thunderstorm complex.
 Day cloud phase 1 min of the same storm. Does not get much better than this!
 This example shows a supercell early in its lifecycle. The cell split and produced a tornado near the county boundary in the loop. In past examples, the AzShear product featured numerous time matching issues from multiple radar site’s data. In this case, cell motion was slower, possibly contributing to the less cluttered and more useful AzShear data.
 Same loop as above this time with V data. AzShear did anticipate possible tornadogenesis with upticks in values several scans before the tornado. On the bottom left, CPTI is shown for the 175mph threshold. Values for this threshold remained low.
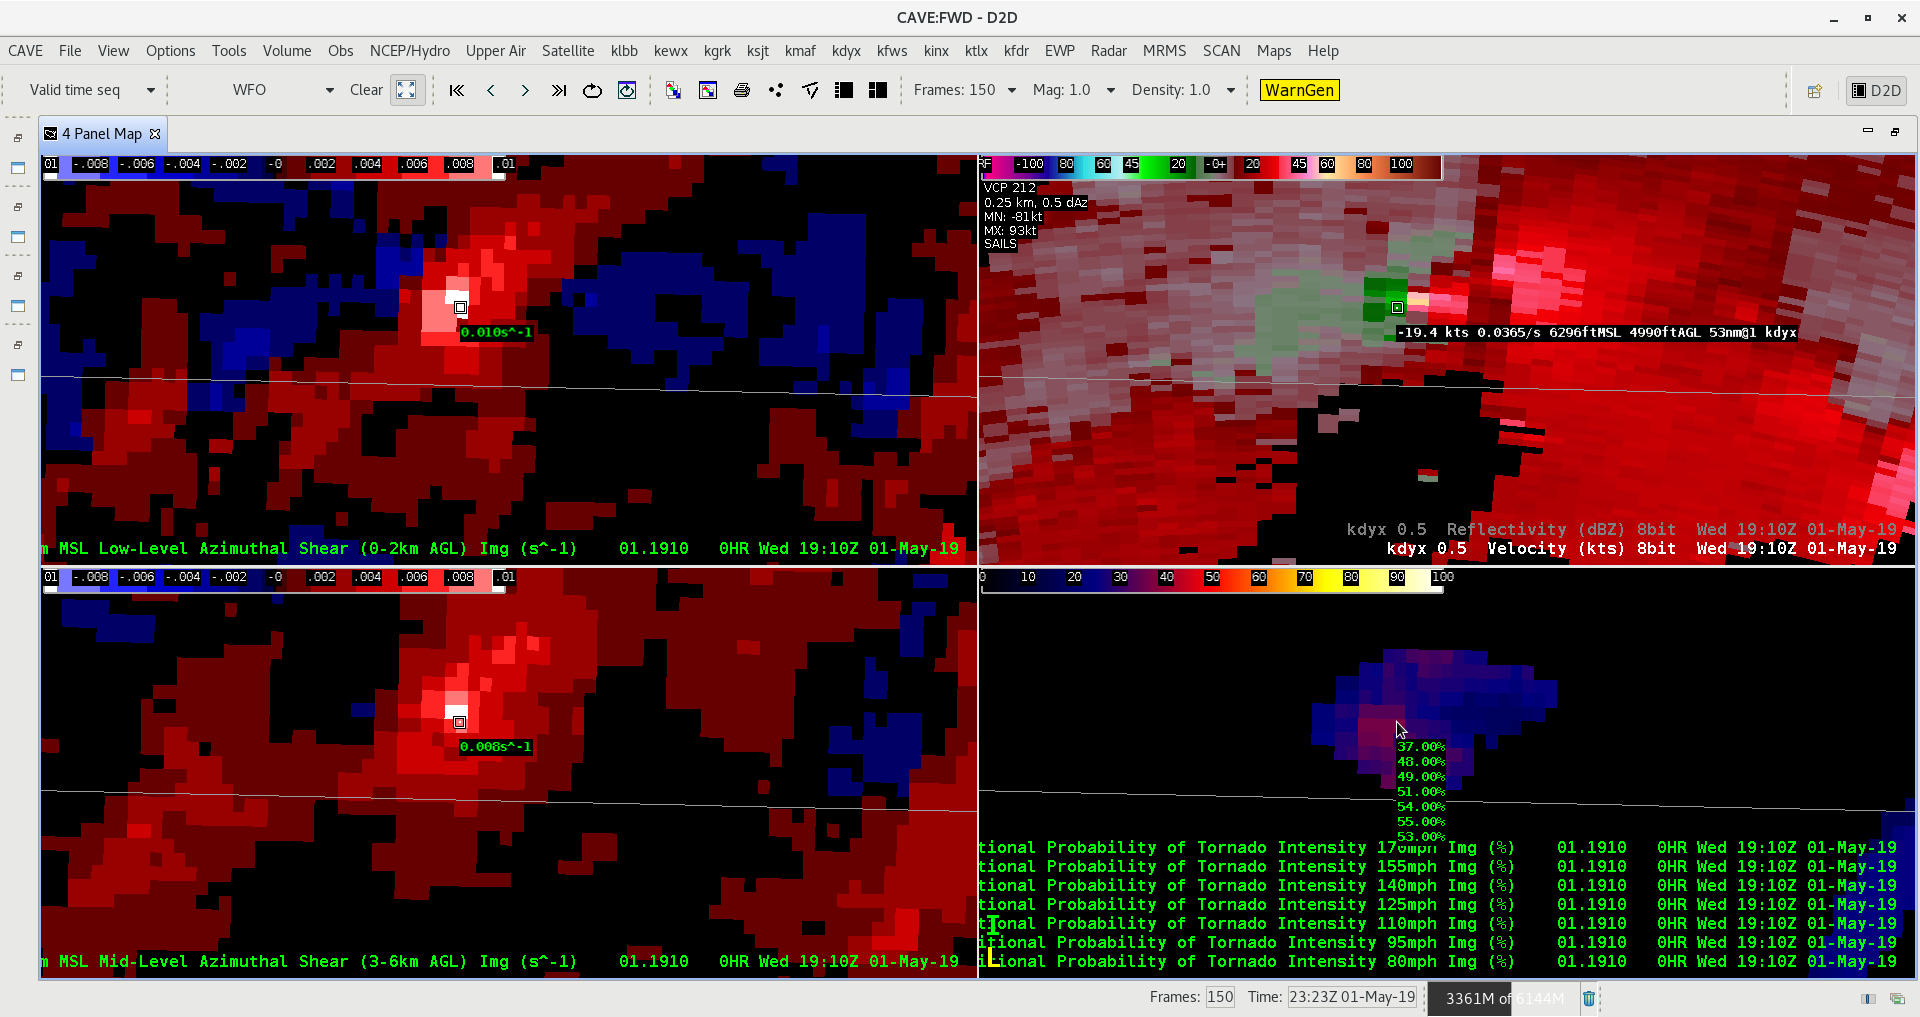 Values readout for the CPTI product on the bottom left at the time of strongest V couplet. Values ranged from 37 for 175 up to 48 for 155, but then did not show much of a change once again between 155mph down to 95 mph. In this range, the probability only rose from 48 to 55 percent between 155 to 95. Then, strangely enough, the prob dropped back down to 53 percent for 80mph.
 This later example shows another case of multiple sampling issues with AzShear