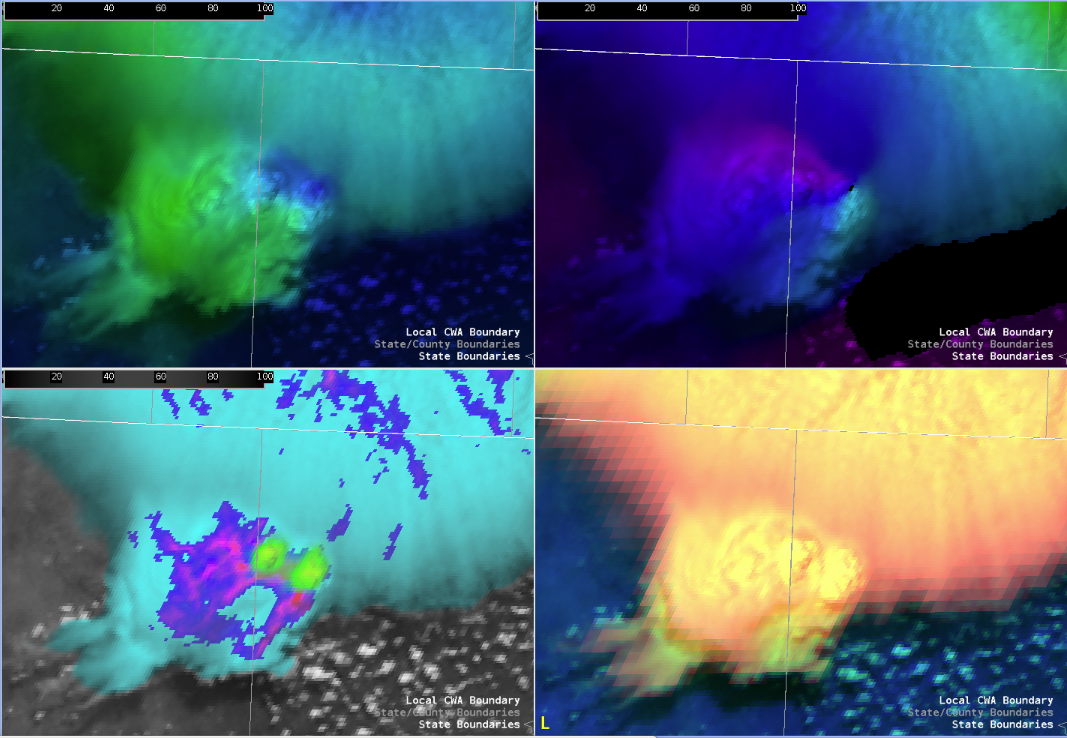
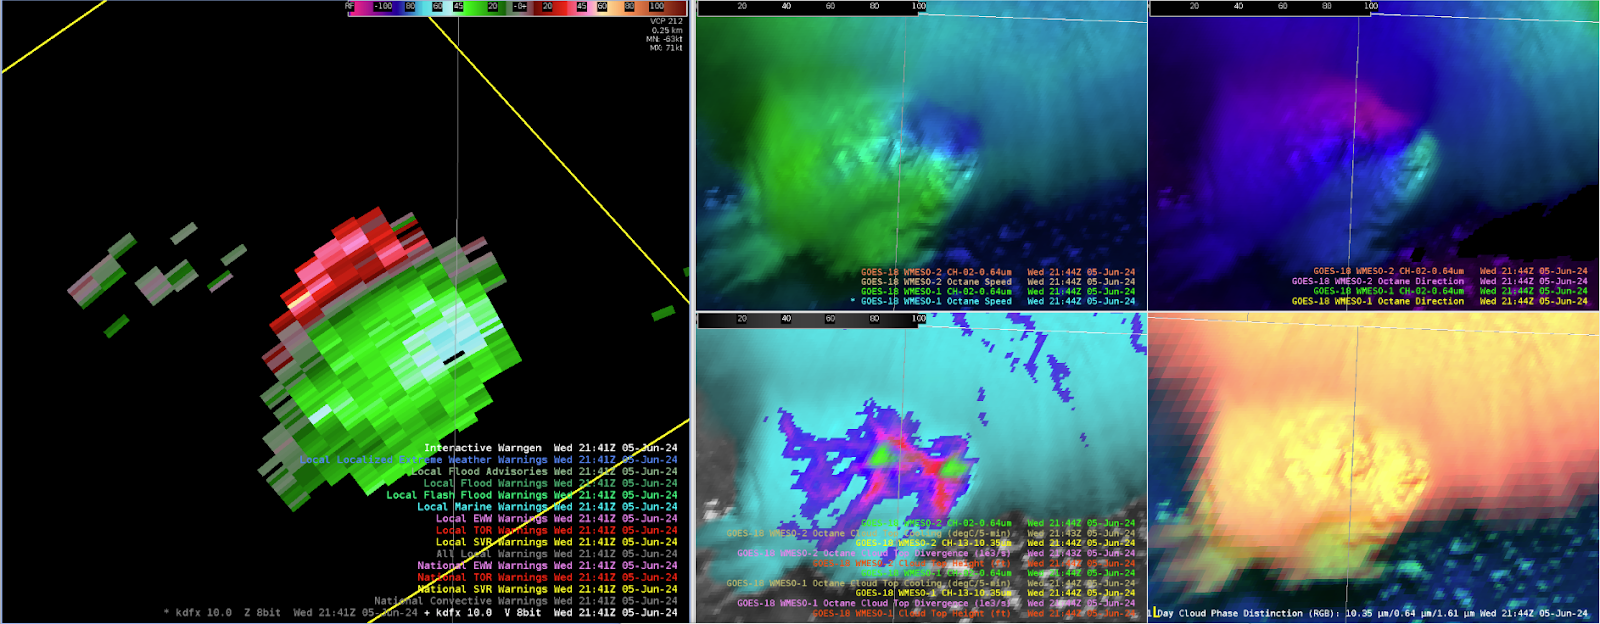
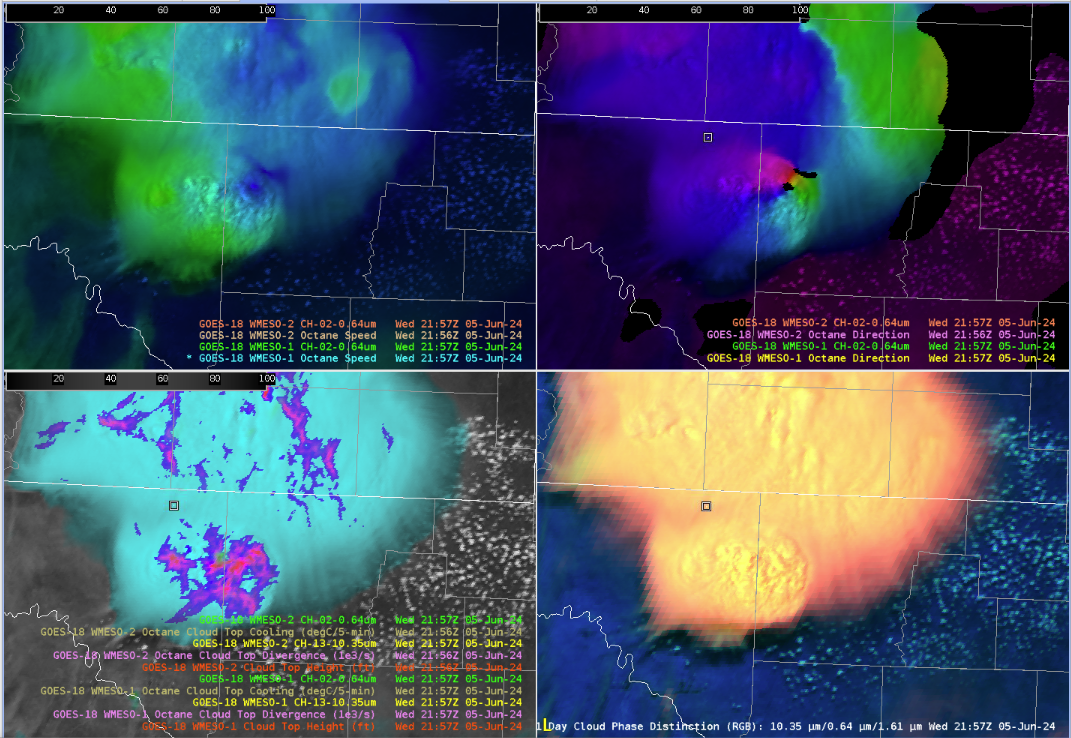
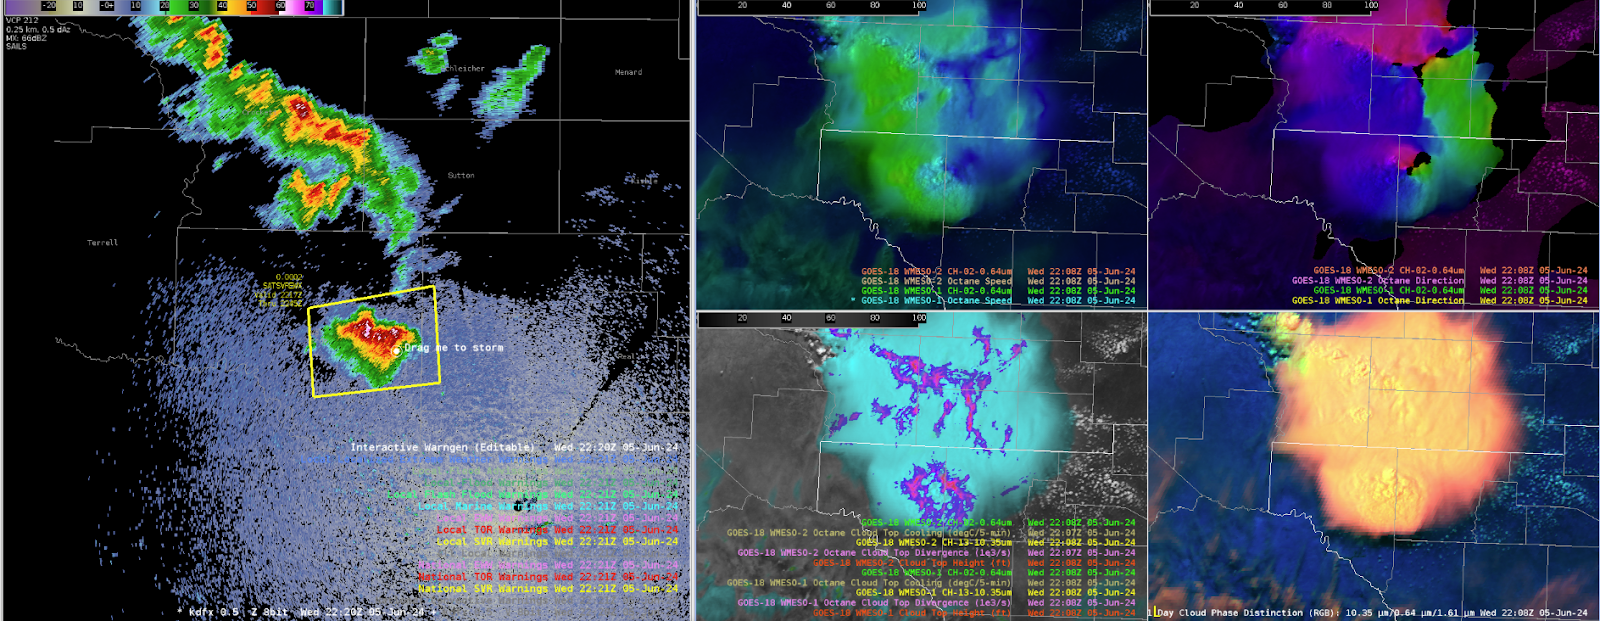
Tracking convection across DLH CWA with Octane, LightningCast, and GREMLIN

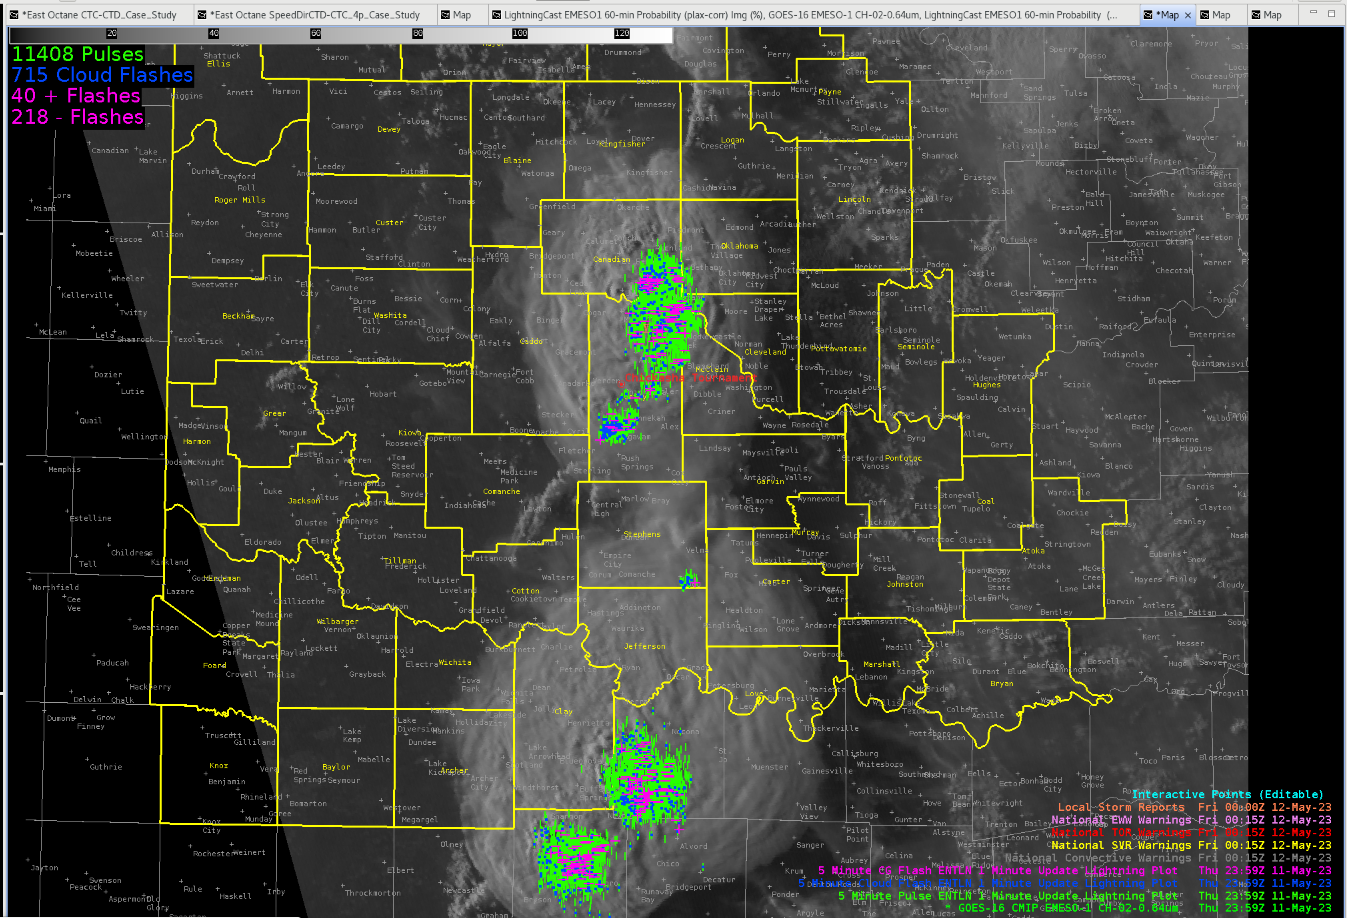
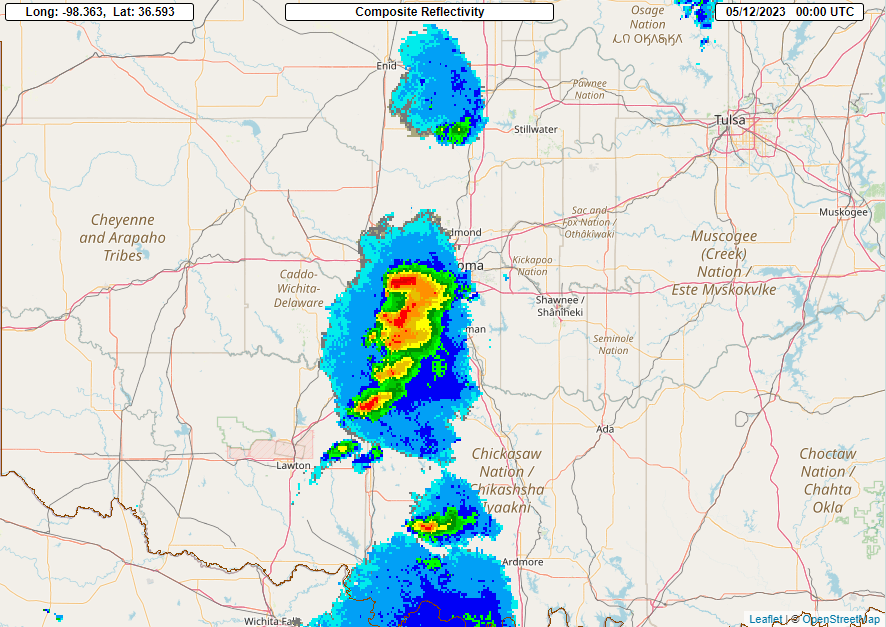
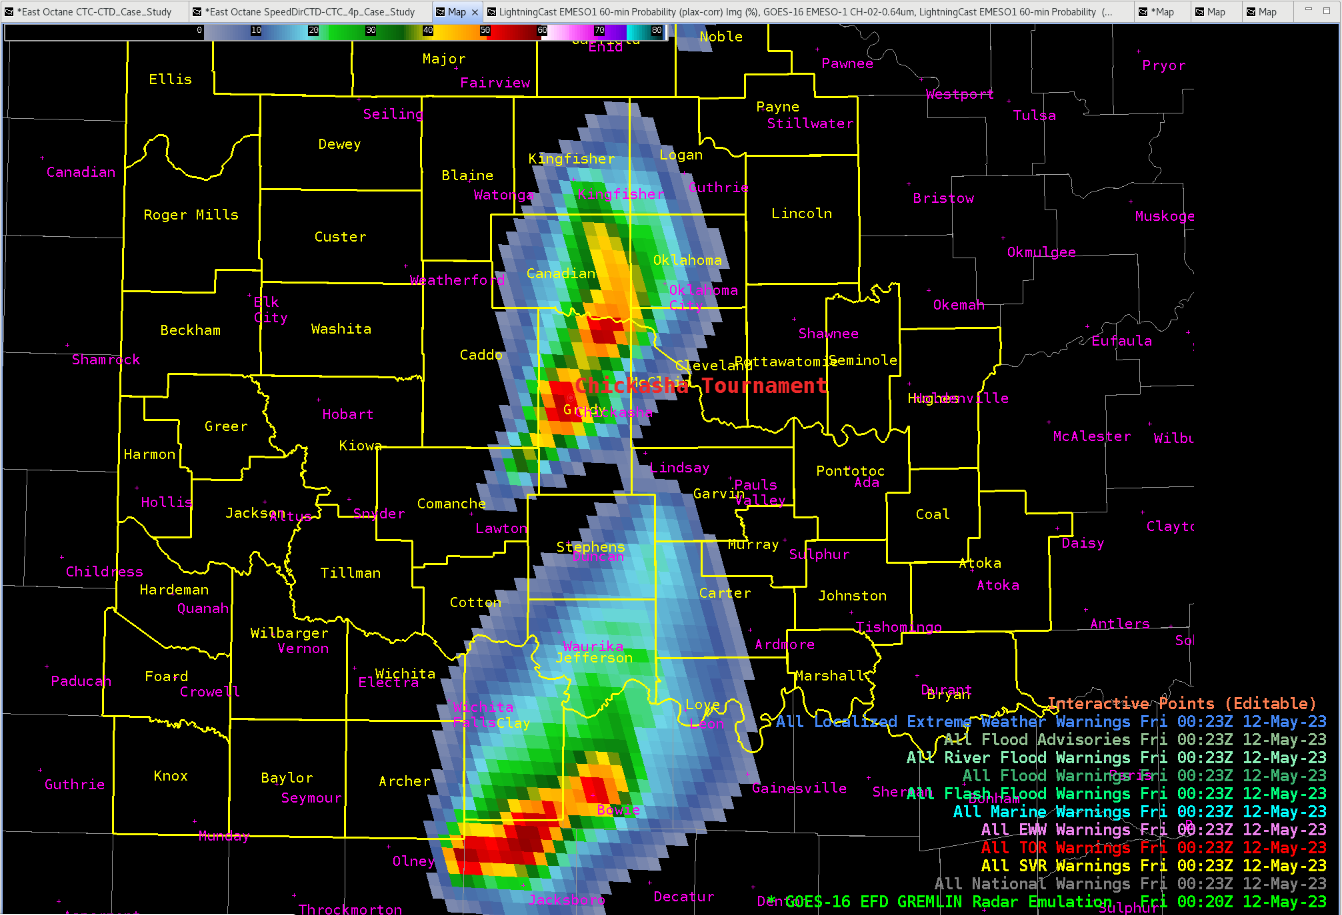
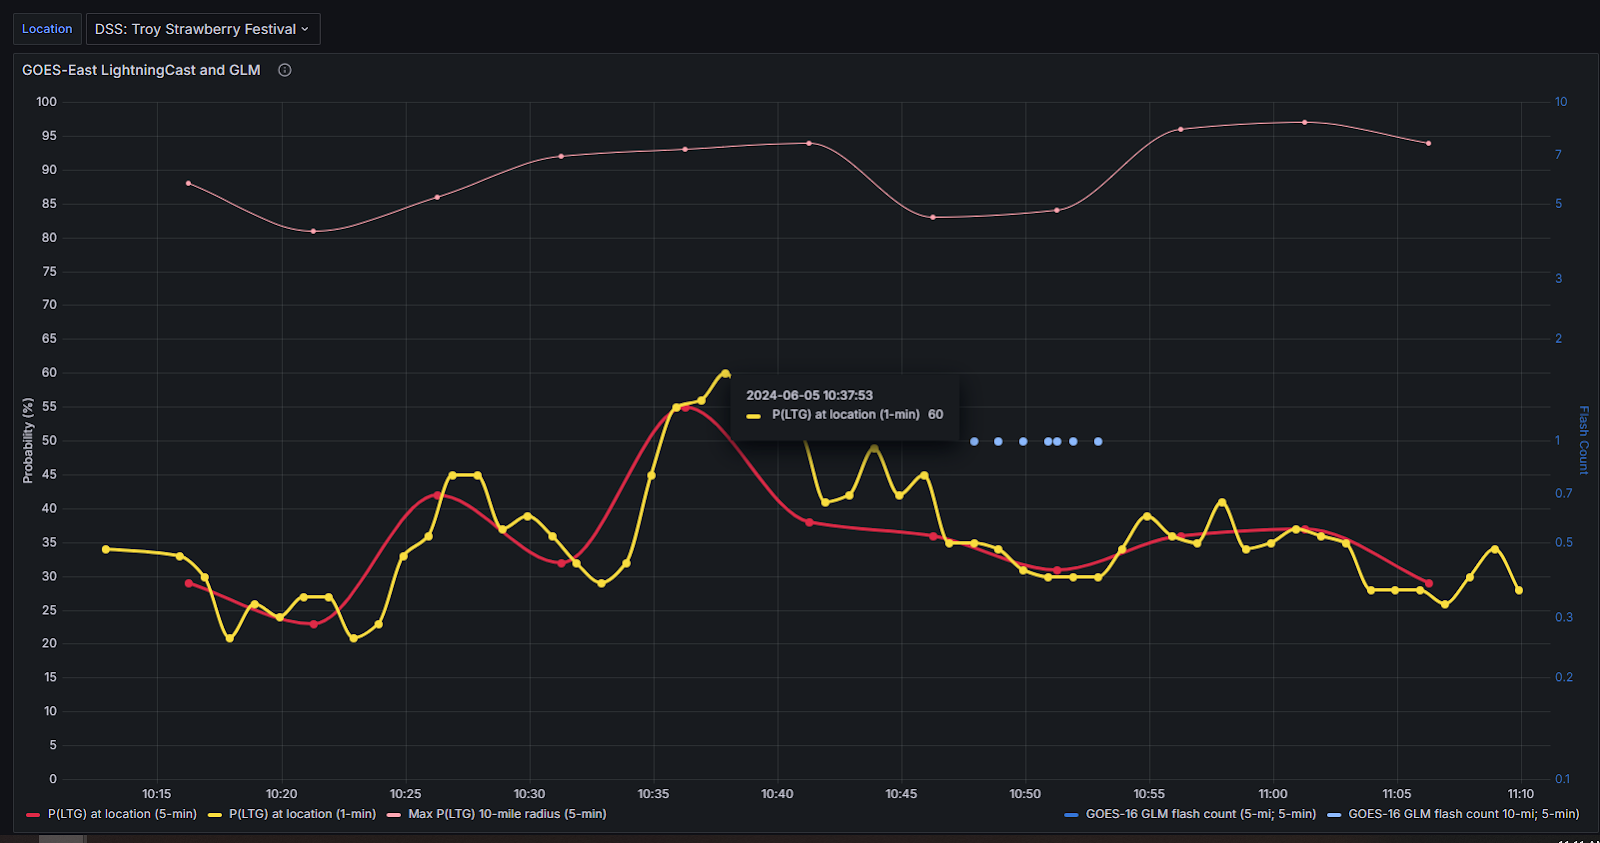
Forecasting in DLH today was challenging due to the radar being made unavailable. However, some of the satellite convective products were able to create accurate forecasts regarding the location of storms and lightning. Firstly, looking at Lightningcast there were gradients of ~25% appearing 1 hour out around the DSS point indicating the possibility of lightning developing within the next hour. This was also supported by Octane, which was showing storms initiating to the south with early signals of cloud top cooling and divergence occurring. Around 1 hour later this seemed to mostly come to fruition, which can be seen on the 4 panel image with GRMLN data on it. Lightning seemed to be mainly concentrated east of the DSS point which was shown in lightningcast. Also these storms originated from the south which Octane began to hint on early out. Overall, it looks as if all three of these satellite convective products did a good job in forecasting possible convection without the use of a radar.

-Sven The Puffin

Tags: None

RADAR DOWN IN DULUTH CWA

Without the use of radar out of Duluth more reliance was given to Satellite derived observations and satellite derived output.

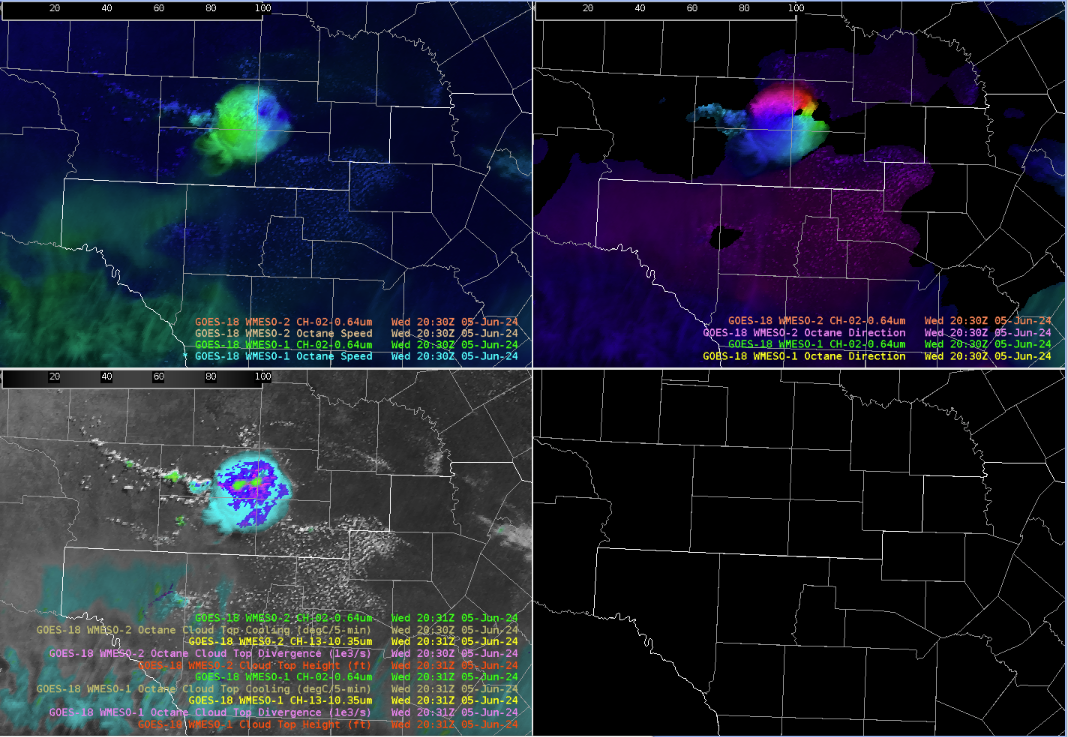
Below is the OCTANE cloud top cooling and cloud top divergence product.  You may notice in an area of moderate but increasing instability there is convective initiation ahead of the main line of convection.  However, you can notice early in the loop that there is convective cooling indicated in the south-central portion of the CWA and the far SE portion of the CWA.  Notice how in the far SE portion of the CWA there is the purple shading indicating cloud top divergence.  And in south central portions there are “hotter” yellow and tiny red(s) (may be hard to notice due to scale) pixels indicating cooling cloud tops, but with no purple shading and thus no meaningful divergence at the cloud top.  This is indicative of orphan anvils. The moral of the story here is that without radar the OCTANE product heightens your attention to the cells in the far SE portion of the CWA, and this would be where to consider SVR or SPS product release, with the activity across South Central portions of the CWA failing to produce significant convection at this point in time despite moderate to strong instability.

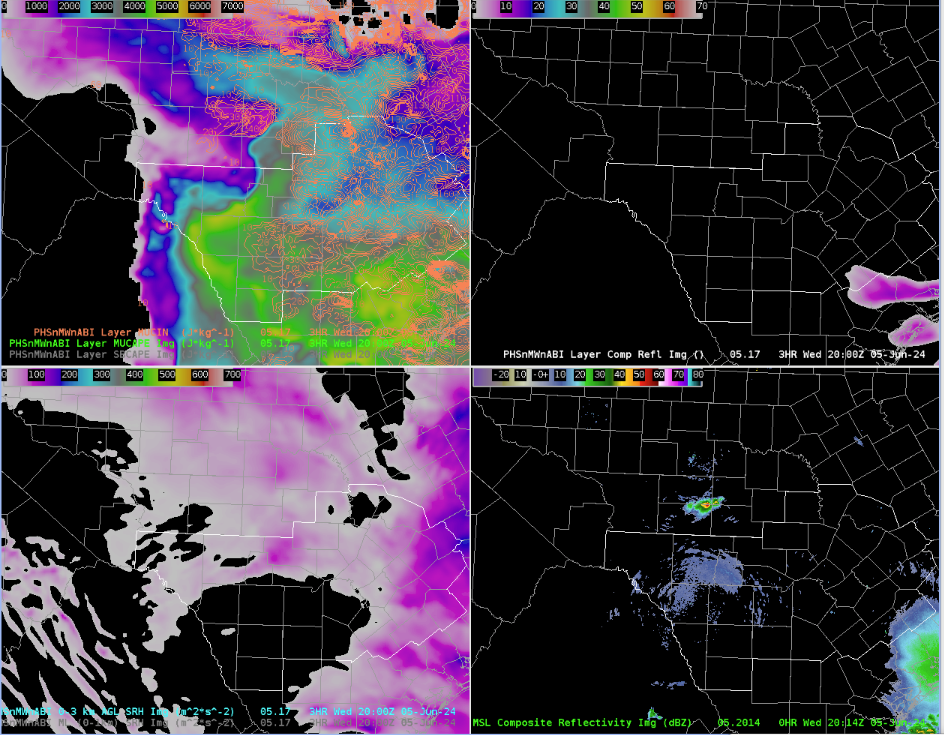
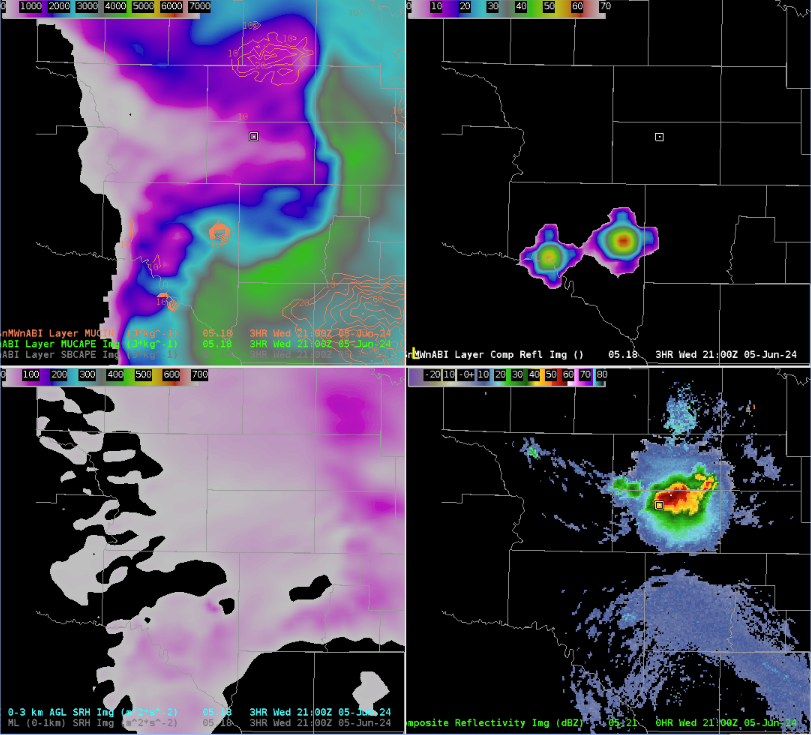
Further southeast however notice that there is stronger instability over SE portions of the CWA, thus the OCTANE product is giving you a result which coincides with where there is higher instability (higher MLCAPE – see SPC mesoanalysis).

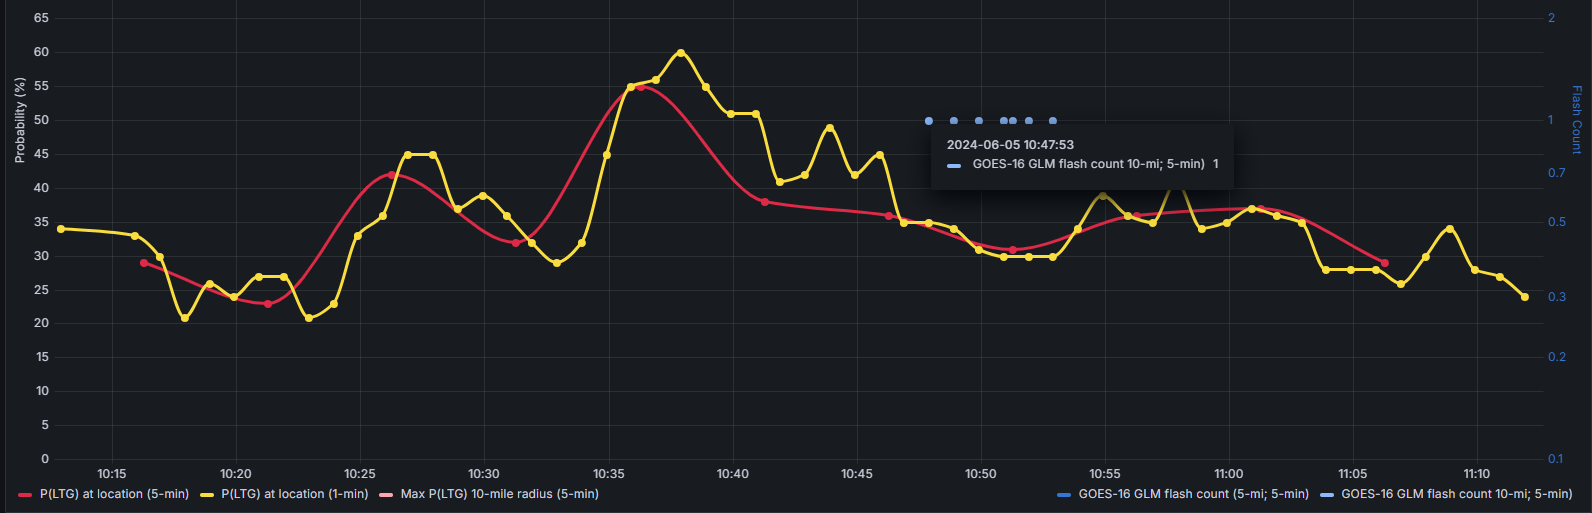
Lightning Cast continued to show high confidence of lightning over the next 60 min with the linear MCS moving into western portions of the CWA.  This lead to high confidence in forecasting lightning for a DSS location (Solana State Forest) during this event.

Steady behavior with the greater than or equal to 10 flashes in the next hour.

High probability of 1 flash of lightning in the next hour, increasing then holding steady

Here (below) is the Lightning Cast and GLM dashboard output comparing the forecast to the GLM flash count.  Note: the dashboard was down initially but came back online

Thus we were able to give a high confidence lightning forecast for DSS.

Here is the GLM Flash Extent Density at the time of the Lightning Cast 1 hour forecast.

– 5454wx

Tags: None

High Confidence in Progressive/Weak MCS

KSHV radar trends illustrate a cold-pool dominated, weak MCS approaching the NW corner of the CWA. Many satellite products illustrated a consistent mainly sub-severe weather episode unfolding giving increasing confidence in the near-term forecast and expected impacts. Focus would be on any stronger individual updrafts for potential isolated severe thunderstorm warnings.

Overall, there was high confidence in approaching thunderstorms per radar and LightningCast data pinpointed the ongoing widespread nature of the convection, given several embedded impulses of GLM spikes behind the leading southeastward surging outflow boundary:

East Octane SpeedDirCTD-CTD_4Pan procedure provides more calculated parameters on top of RGB and ABI products to quickly diagnose convective strength/intensity.

The top 3 panels below (OCTANE speed, direction and Cloud-top Cooling and Divergence) identify a large-scale cirrus canopy with embedded updraft impulses.

Situational awareness was enhanced by adding on local KSHV and KLZK radar which helped to identify a SSW to NNE boundary and associated CI ahead of the main line, which OCTANE products began to illustrate (see center of each product, identifying increasing speed/directional divergence colocated to the convection along the boundary)

Given the environmental parameters, this would have been a location to examine for the potential of a severe thunderstorm warning, especially if associated radar trends (RIJ via radial velocity) indicate increasing downdraft wind potential.

– RED11248

Tags: None

High Confidence in Lightning activity:

There is high confidence in lightning activity with the storms moving across southern Wisconsin this afternoon into this evening.  Based on the lightningcast product shown below, there is a greater than 90% chance of lightning within the orange outlines over the next hour.

As you can see on the image below, this is a point forecast for Camp Randall Stadium, showing the same results.

-ULMCUBMAN

Tags: None

A Tale of Two Thunderstorms

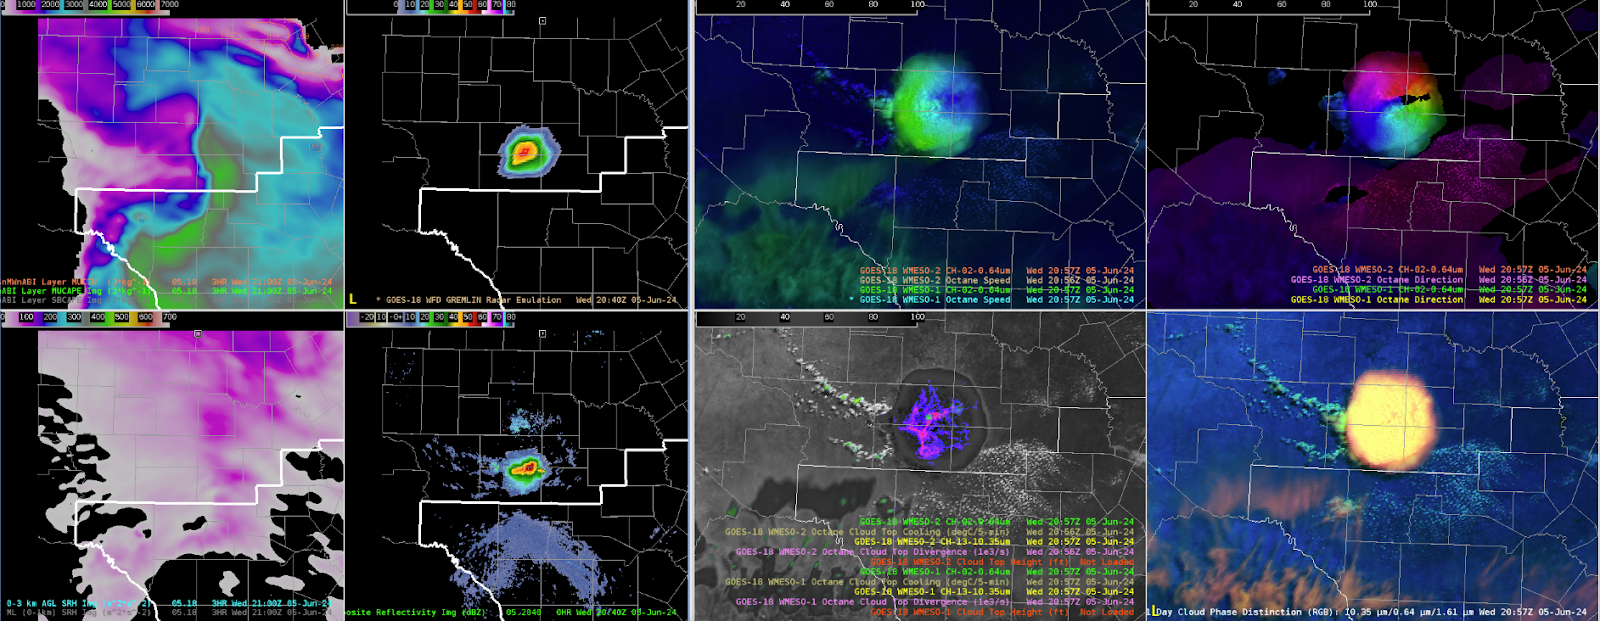
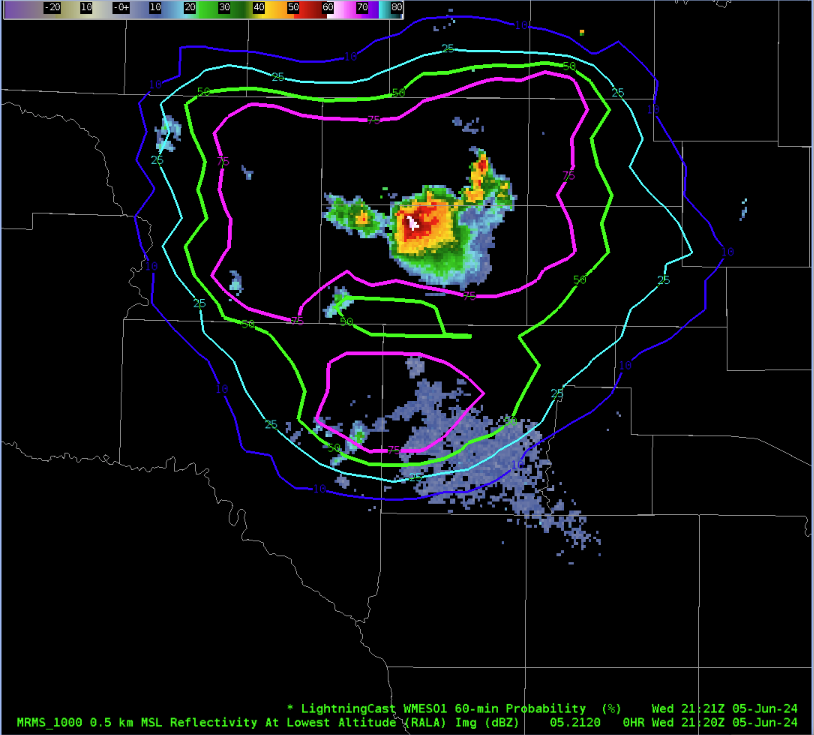
Two thunderstorms developed with mixed signals between the variety of tools available. Satellite tools would’ve suggested that the southern storm was the area of interest, but the radar signature was much better for the northern storm. GREMLIN is shown below, with the GOES West on the left and GOES East on the right. LightningCast is contoured, and the probability of 10 flashes mainly favored the northern storm. The appearance on GREMLIN was much stronger for the southern storm.
When looking at the GLM RBG, the more frequent and shorter flashes were associated with the southern storm.

Looking at OCTANE, the southern storm appeared more impressive. Although towards the end, the northern storm began to exhibit stronger upper level divergence.


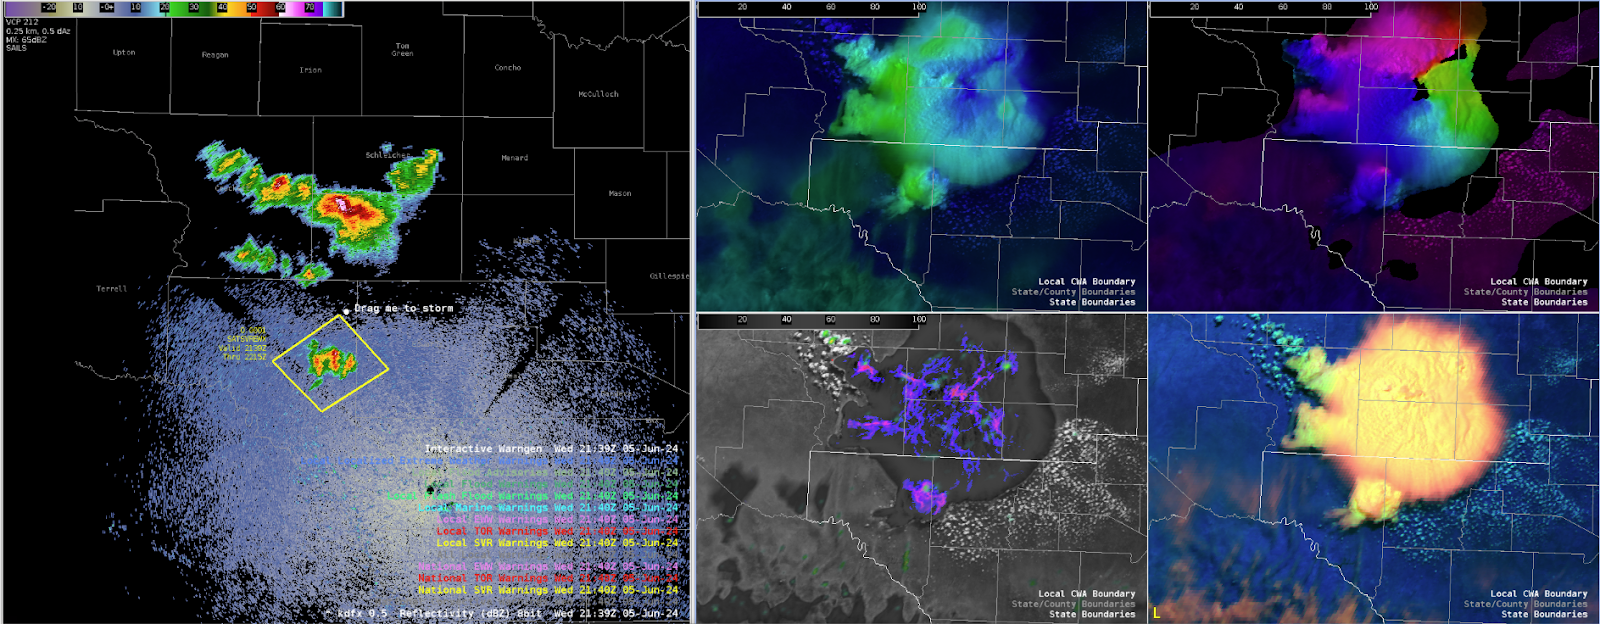
But again, if one were to look at radar, it would be readily apparent that the northern storm should be ranked as the biggest threat. In a situation involving satellite alone, I might have missed the event that did produce the severe event.

And of course remembering how significant parallax is. From GREMLIN with GOES West, my storms were neatly in their boxes, but from GOES East, it would’ve looked quite strange.


And despite the signal from satellite, the southern storm essentially collapsed in on itself. GREMLIN using GOES West does not seem to catch on to this fact, but GOES East has corrected to a stronger storm up north.


Kadic

Tags: None

A Tale of Two Storms From OCTANE, LightningCast, and GREMLIN


This is an interesting comparison of two storms that show two initially different satellite and LightningCast signals that produce very different results on radar. The southern cell shows an initially much more consistent cloud top divergence signal from OCTANE with a more robust looking anvil shield and an above anvil cirrus plume. That aside, the northern storm consistently had a higher probability of >10 GLM flashes from LightningCast and eventually developed a far stronger radar signature and eventual severe thunderstorm. The southern storm struggled to even develop a 40 dBZ core. The animation below shows the same progression but with the OCTANE speed and direction RGBs. In this case if a severe decision was to be made with just the satellite presentation, the wrong decision may have been made (at least initially).

-Joaq


Finally, here is how GREMLIN handled the southern storm, which it understandably initially intruduced high reflectivity to the southern storm.

-Joaq

Tags: None

Examining LightningCast Values Near Pierre SD

We have a Fishing Derby ongoing near Pierre, South Dakota. We observed some differences in the LightningCast probabilities within a 10 mile radius between the AWIPS contour plot and the dashboard.

Here’s an image from AWIPS at 2004Z (1504 local time), with the DSS point marked by a 10-mile radius near Pierre SD (white circle), and the LightningCast probabilities (60-min for 1 flash) contoured in blue and green.


Next, here is a look at the dashboard for the same DSS event. Of interest is the pink line, which shows the maximum probability for a flash within 10 miles of the DSS point within the last 5 minutes.

At the 1506 (local time) time slot on the dashboard, it shows the maximum probability of 47 percent. However, the AWIPS image above shows the greatest contour values within the DSS point radius for that same time minute span (at 1504 local time) and the value only barely exceeds 30 percent. It appears that the value on the dashboard is reading about 15% higher than the value that would be implied by the contour display in AWIPS.

Functionally, as long as the trends are consistent, this may not make much of an impact on messaging or forecasting for this DSS point. However, having the values more closely matching between the two sources is something that would likely increase forecaster confidence.

–Insolation

Tags: None

LightningCast and DSS

Monitoring convective development over the southwestern portion of the ABR CWA, where we are providing DSS support to a Fishing Derby (yellow range ring – 10 miles). From this data, I would be able to let an EM know that we’re noticing an uptick in lightning probabilities due to storm cells developing to the south/southeast of the Derby and moving northeast. These are not severe at this time and no lightning has been observed as of yet. However, currently, probabilities of lightning within 10 miles are between 40-50%. If I were to use LC while at an on-site deployment, I would have both the map view (first image/loop below) and the graph (second image below) up to show what I am looking at, but especially the map view to give context to the graph.

LightningCast in “map view” showing probabilities of one or more flashes (as an image, not contoured)
LightningCast Dashboard showing lightning probabilities at DSS point (Fishing Derby, Aberdeen, DS)

UPDATE # 1 – Lightning has been observed! From when the 10% contour (10% chance of 10 or more flashes) first popped up (red contour north of Lyman) at 2010Z, it was 10 minutes until GLM and the ground networks observed flashes. It was 5 minutes later when ground networks observed CGs.

LightningCast – time of first 10% contour (red) 2010Z


LightningCast – GLM and ground networks observe flashes 2020Z


LightningCast – Ground networks observe CGs 2025Z

In terms of lead time, I crafted a DSS message between 310-315pm (seen in the first paragraph above this update) and the first flashes were observed at 320p and CGs at 325p. Therefore, this gave a 10-15 minute lead time.

UPDATE #2 – Below is a snapshot of the LightningCast Dashboard showing the above mentioned GLM flashes within 10 miles.
Forecaster Cumulus
Tags: None

Analyzing Clusters, Anvils Carrying Charge North, Final Checkup on LightningCast

Working on the DSS for the PGA tournament, one of the more frustrating features was how thunderstorms well outside the range of the event produced lightning. About the time one DSS image was sent, there was a lightning flash that occurred well north of the primary cluster and near a very weak area of reflectivity.

However, this has been the story for much of the day, where intense convection has been to the south and weaker cells to the north are still managing to produce lightning. Below is the probability of exceeding 10 flashes on GLM, with GLM and MRMS at -10 C to highlight how weak the convection was to the north. The fact that reflectivity was barely at 25-35 dBZ would suggest little potential for lightning.


Analyzing the RGB channels for lightning, one can see this evolution well. With more intense updrafts producing several flashes on GLM, they appear yellow. To the north, where it appears the anvil is carrying charge north, the flashes are very long. From a DSS perspective, this can be frustrating when communicating the potential for high impact weather when all that one gets are sprinkles and rumbles of thunder. Still, the RGB channel can be very helpful in delineating these features, but would also be a helpful means to suggest that the northern convection may not develop quite as much. The 50dBZ echo tops are intended to help highlight the stronger storms. Note how a few pixels of 50dBZ echo tops at best appear in the blue, while the larger cluster of taller storms have the younger convection. This also helped me consider parallax as well. Overall, I really like the potential for lightning characteristics divided into this RGB would be helpful in pulse convection.
And then later, the LightningCast began to behave a bit more oddly. Perhaps these situations cause it to become bouncy. Although, you can almost see these dips in the flashes on the chart as well. At this stage, I feel like I could tell the poor folks playing above par at the PGA tournament and taking forever that they can pack up their clubs and head home, because at this stage, the lightning is here to stay.
Outside of the one flash of lightning that took place over the event about when values crept upwards towards 50 percent, there was a flash. However, values had been hovering around 30-40 percent for much of the day. Values crept even higher, and yet there were no flashes nearby. It seems whatever convective debris left the region, and then the forecast became better overall.
Kadic
Tags: None

LightningCast Imagery Over Vis Satellite

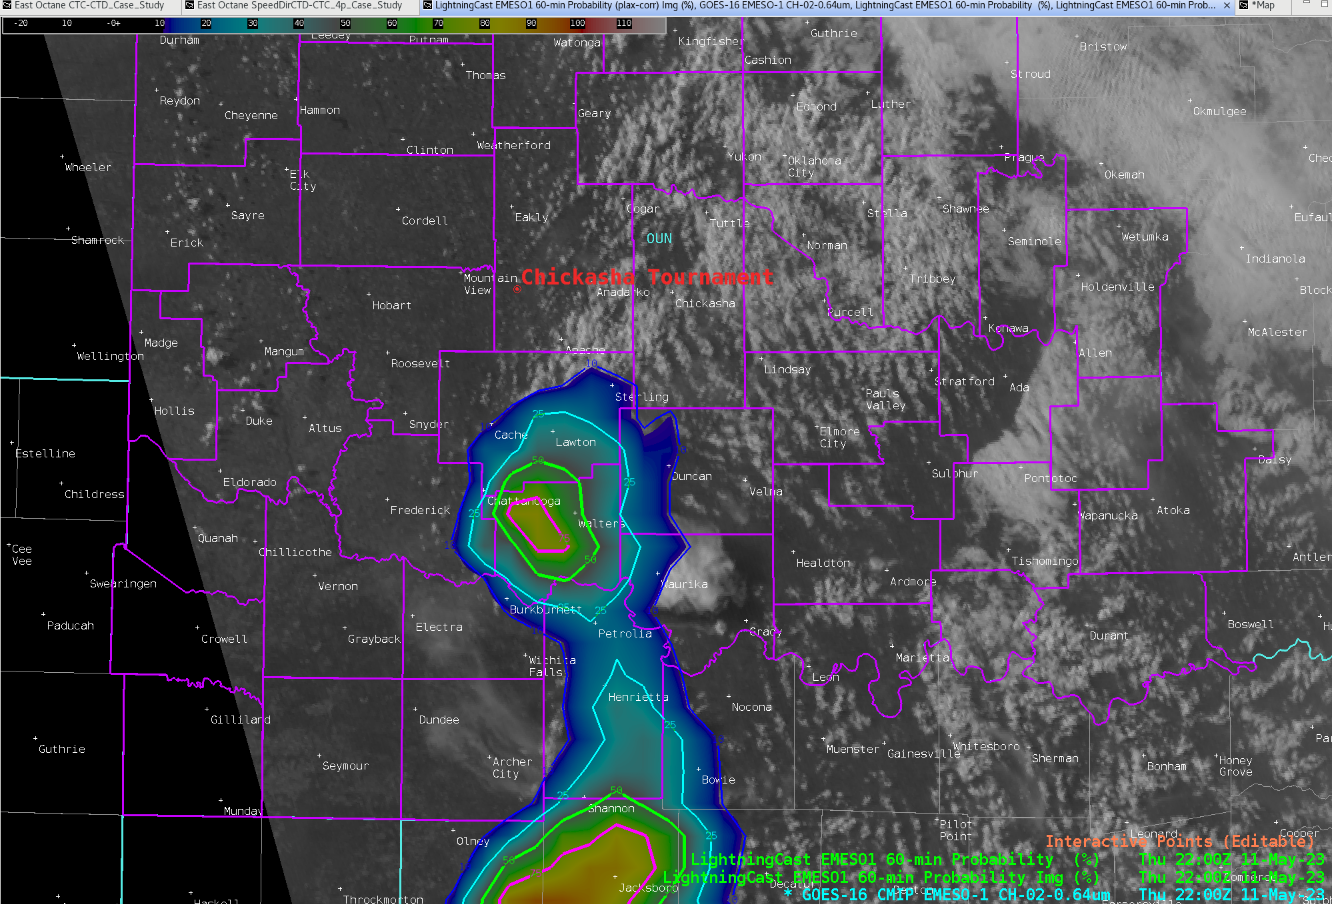
One option that was experimented with for viewing LightningCast data was to use an image overlay on to of visible satellite imagery. Here is an example.


The underlying image is GOES-E meso sector visible imagery (channel 2). The overlaid image is LightningCast East probability of 10 flashes.

To get the image to look like this, the following changes were made to the LightningCast image.

1) In “Edit colors”, fill everything up to about 3% with zero. This ensures that there is no overlay to areas where LightningCast probabilities are very low, and the underlying visible imagery shows through cleanly.

2) In “Imaging”, change the Alpha value to about 25%-30%, and select “Interpolate Image”. I also liked increasing the brightness from 50% to around 60%-65%.

The end result is a display that draws your eyes to the convection with the greatest lightning probabilities, without being as busy as the contours. You could easily overlay extra information over this image, such as GLM, ground-based lightning, or environmental parameters.

–Insolation

Tags: None