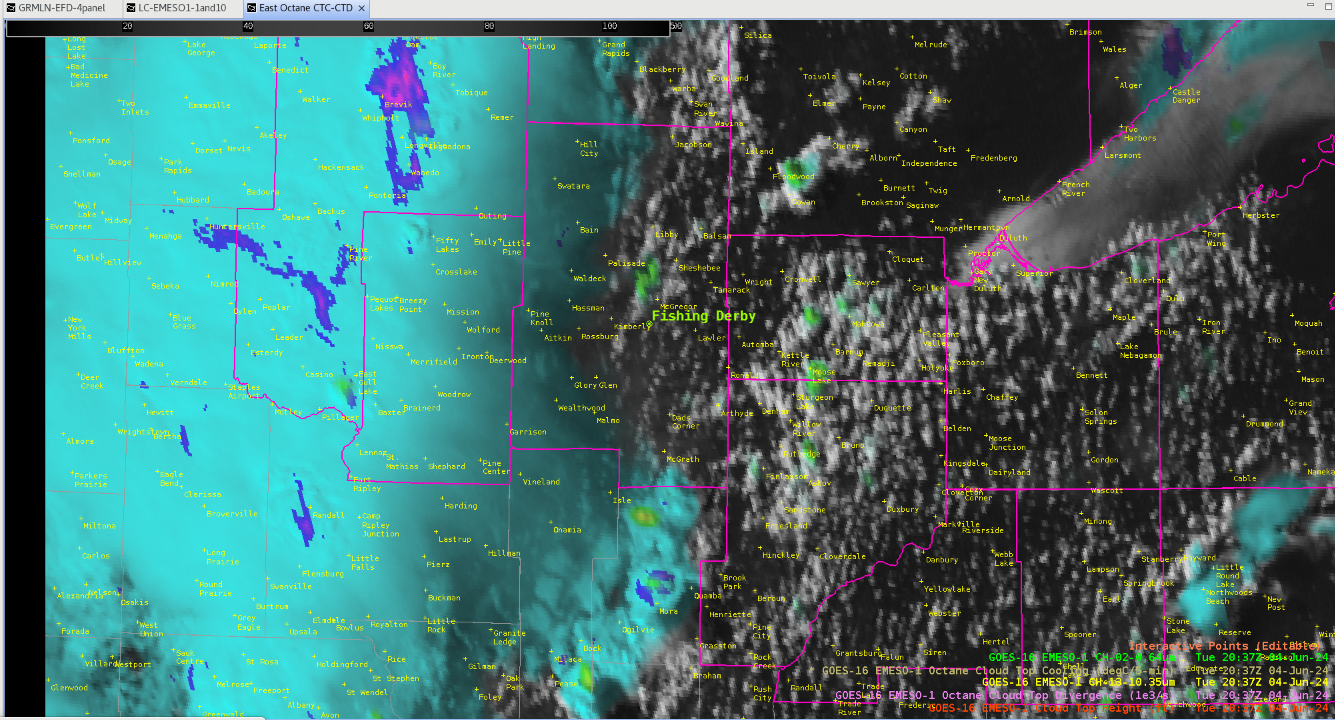
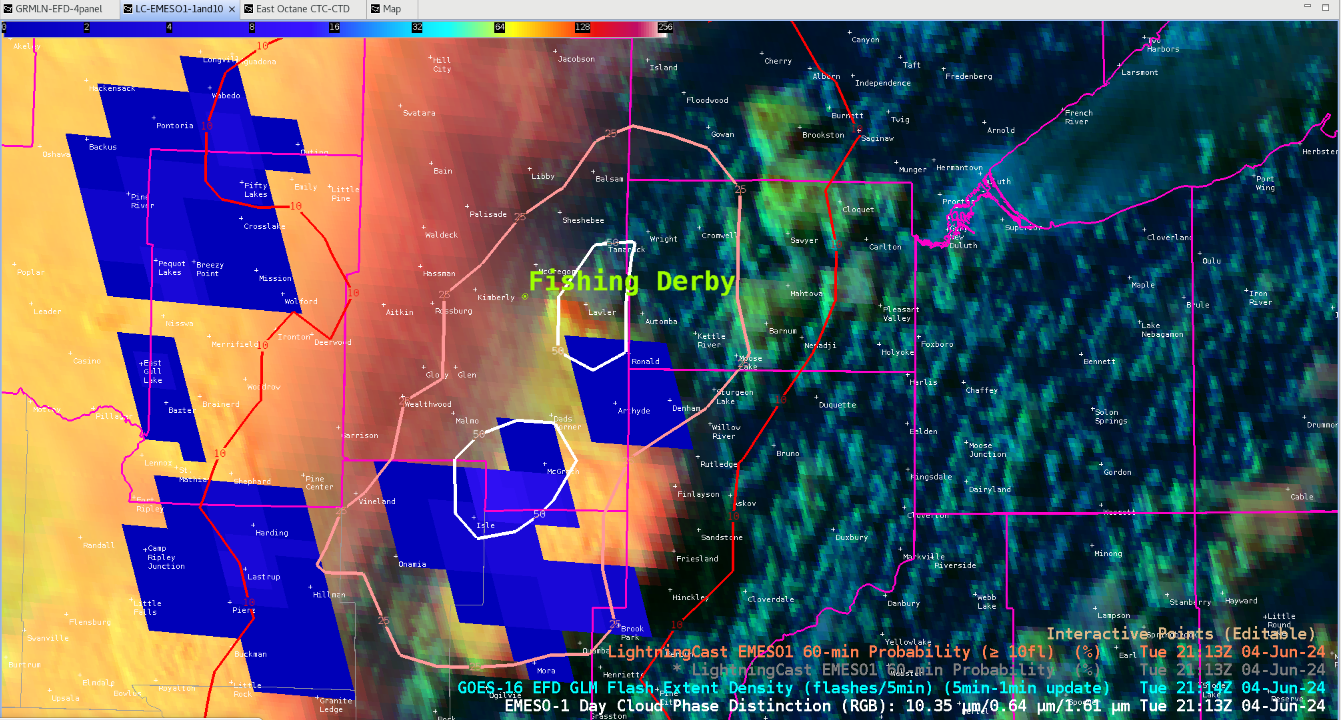
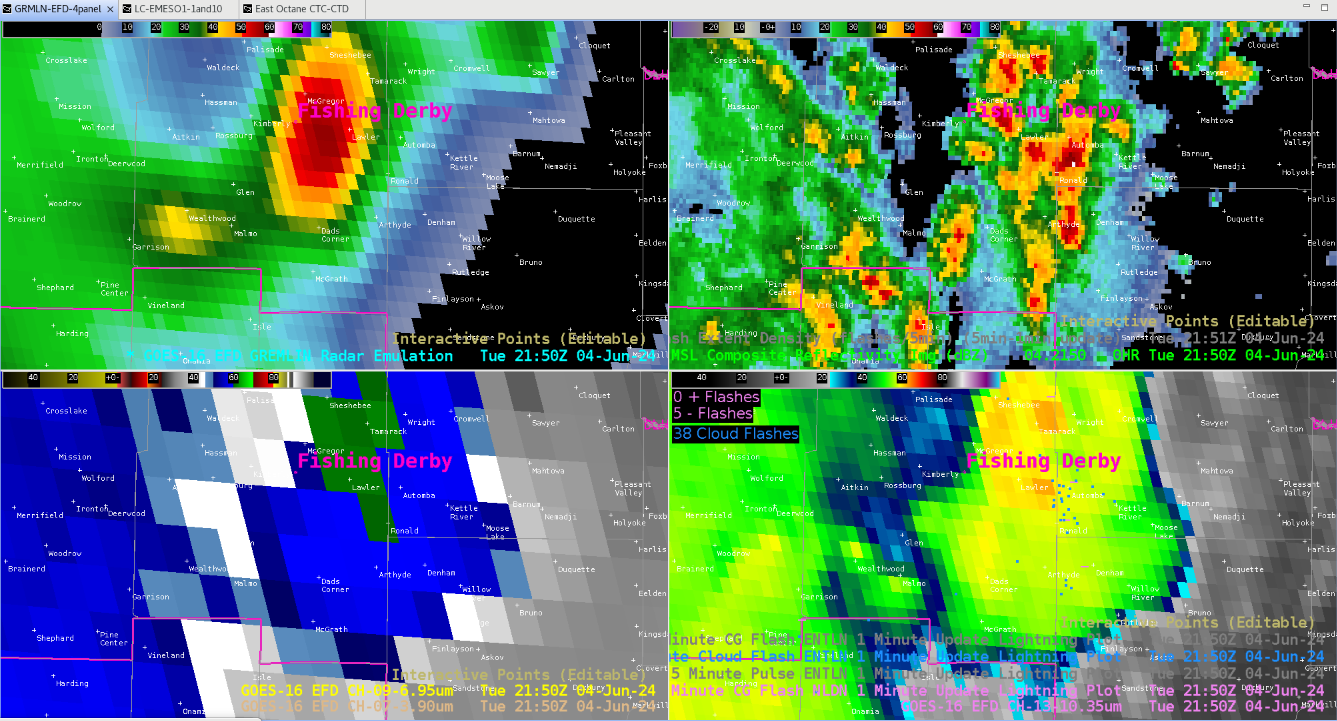
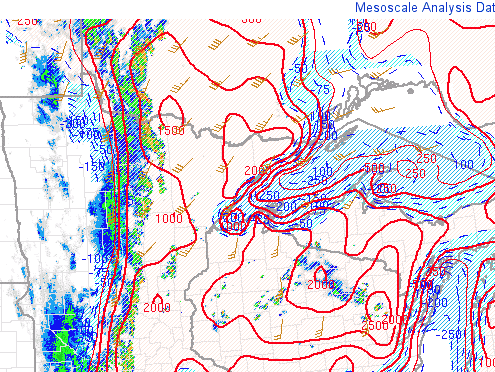
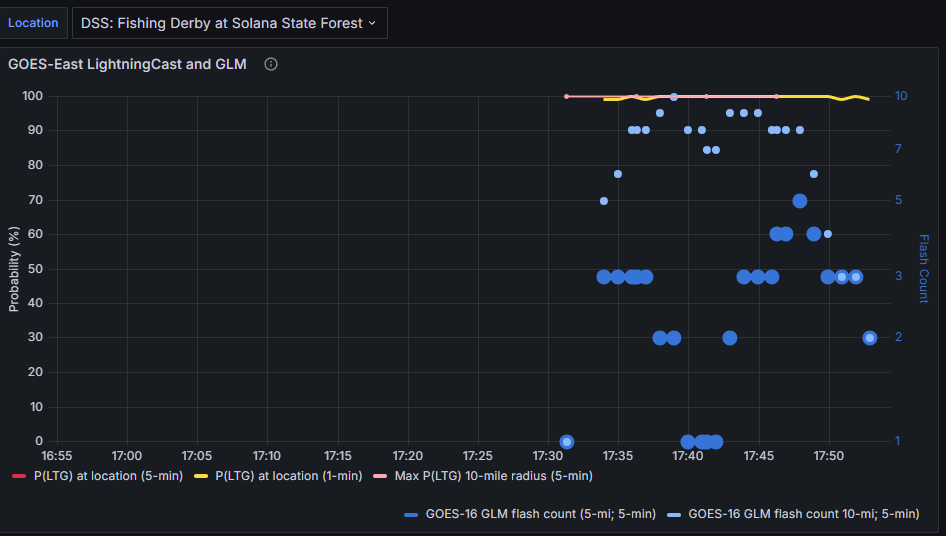
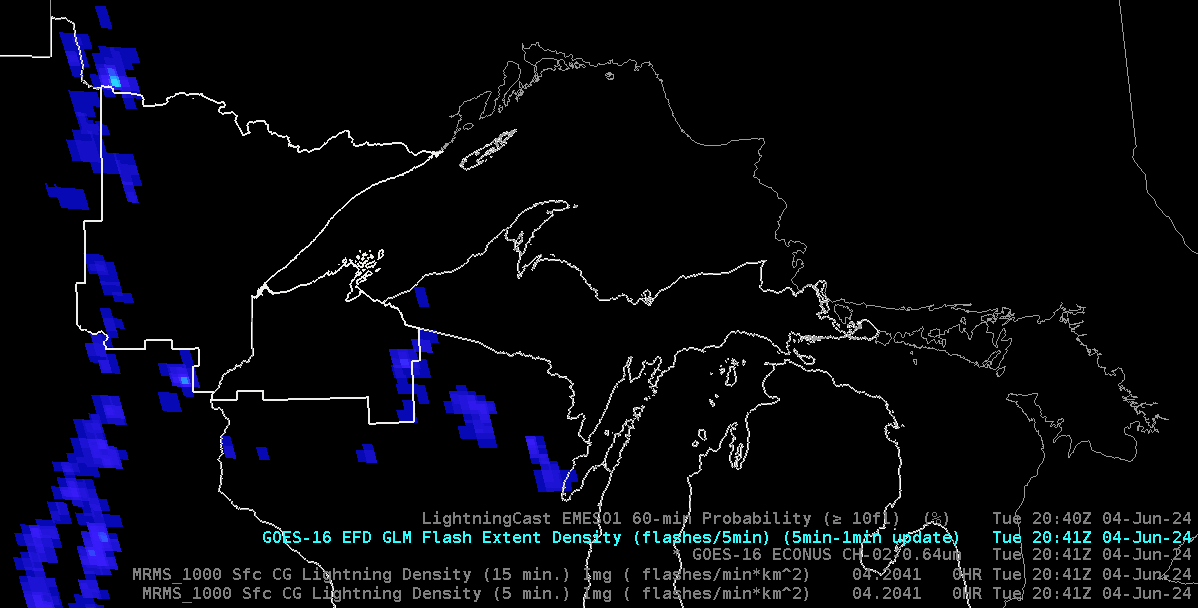
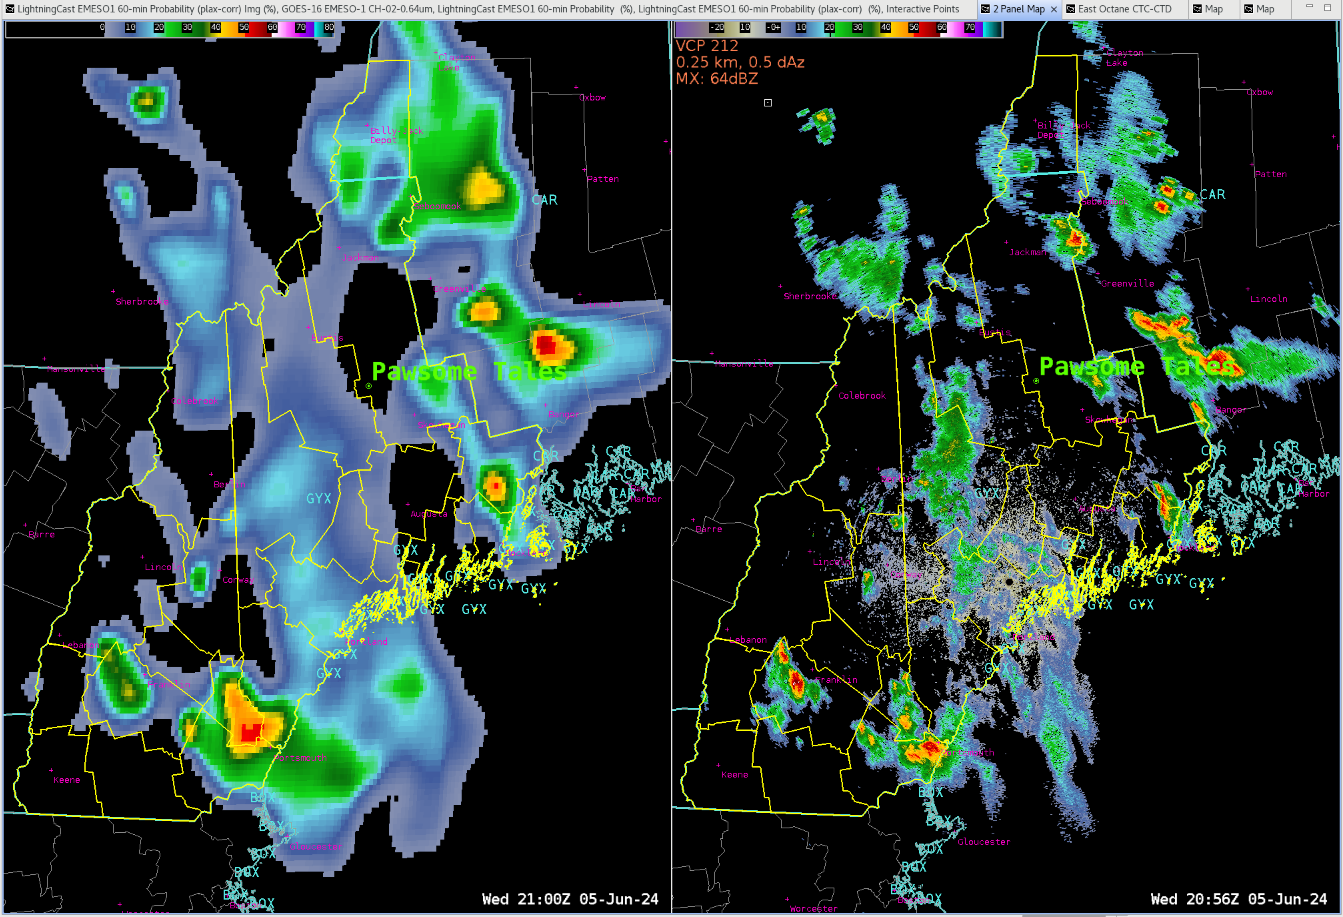
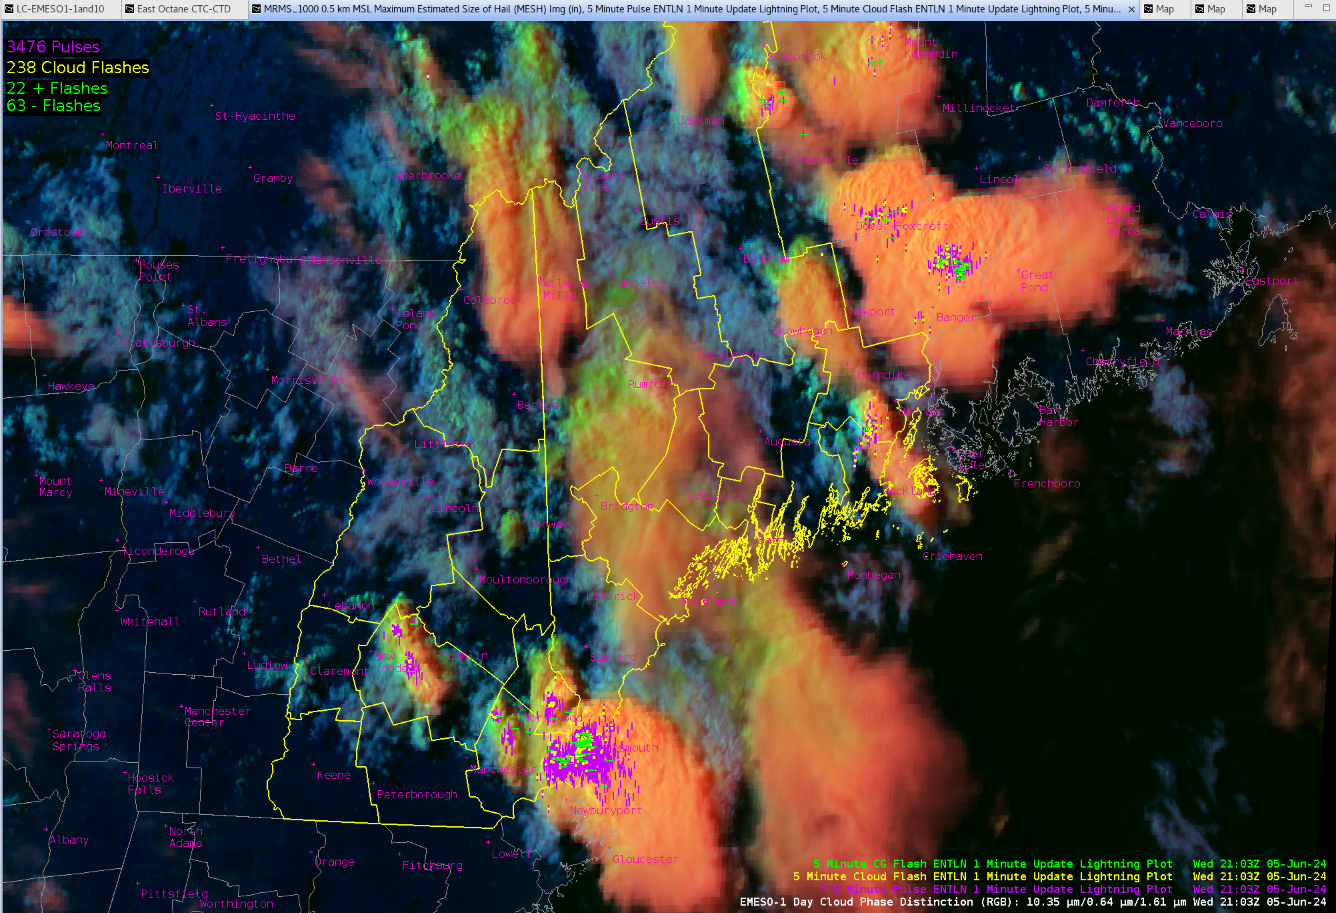
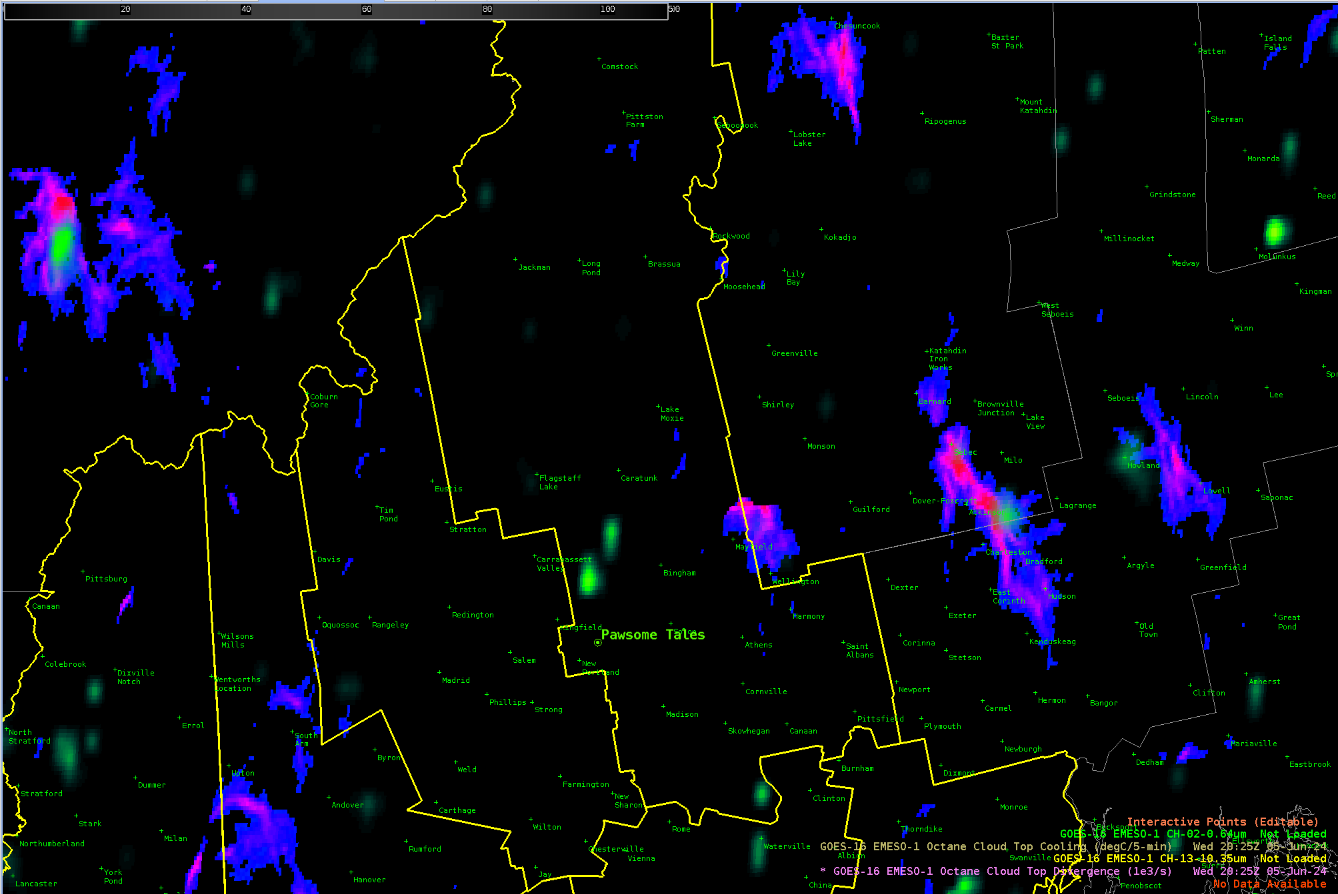
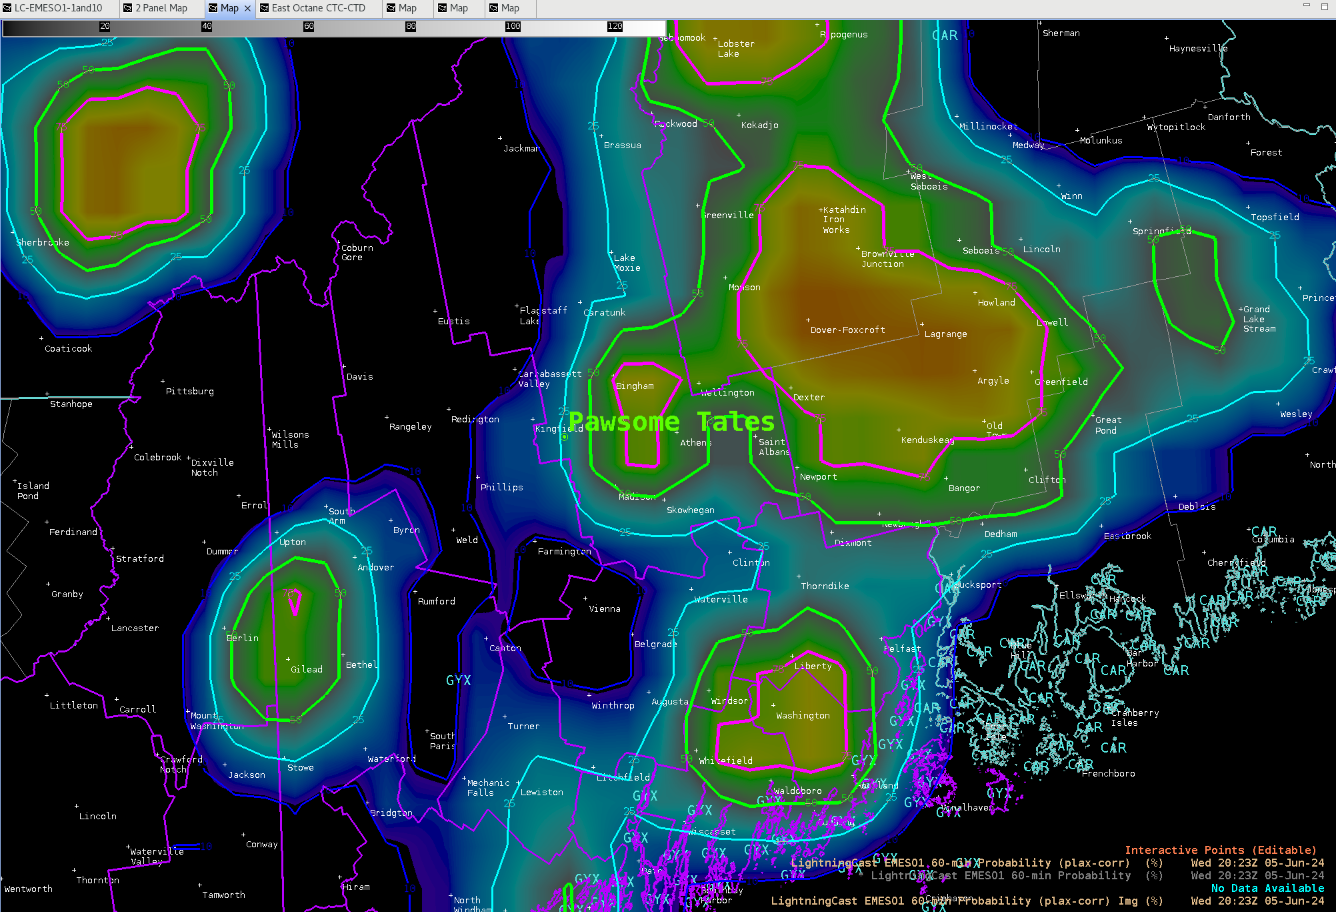
LightningCast and DSS

Viewing CI and LightningCast (LC). LC probabilities on the SW portion of the storm (in the center) at 1958Z ranged between 70-75%. Just before GLM signatures pop up at 2007Z, LC probabilities jump up to around 82%. Not included in the animation, but at 1951Z, LC probabilities were around 50%. The overall trend upward would give me confidence that I can use this product to tell an emergency manager the potential for lightning is medium to high within the next 10-20 minutes (using this case, hypothetically starting at 1951Z).

Lightning Cast product overlaid on Cloud Phase Distinction on the left and radar reflectivity on the right. 20 May 2024

Forecaster Cumulus

Tags: None

Waiting For Convection To Go

While looking for thunderstorm initiation, my eyes are turned towards anything that informs me whether convection will develop further or decay. There have been several things to note while waiting for instability to move into the region.

The main forecast challenge is the favorable ingredients to produce severe convection has to be advected into the region. The WRF with PHS data demonstrates that initial convection intensifies later in the day as better instability arrives across the region on the bottom right panel. This also corresponds with better dynamics noted across the others entering eastern Colorado. Model reflectivity on the bottom right increases as a result of better forcing over time. Until then, it’s monitoring at what point things actually start turning the corner and using the new tools available to find that point.


And so far, the things found have been what it’s not. So here are some things being observed in this period of waiting. At the beginning of the day, one of the things I noticed was related to the OCTANE detecting warming and cooling. As clouds moved off snowy foothills, it was apparent on the viewer where water clouds appeared warmer than the snow surface, and caused a pocket of cooling to appear on the eastern foothills once satellite could see the frozen snow, and warming whenever a cloud layer shifted overhead obscuring the snow. In the middle of convection, this would probably be irrelevant, but just a thing to note while we wait.


I like the idea of mashing together several products that we’re testing at once. So, I’ve applied the LightningCast, WRF with PHS CAPE, and GLM. The idea will be to monitor how the storm is pulsing compared to with what information is provided from PHS. It’ll also help track in what area LightningCast is lighting up and whether it is heading towards a favorable or unfavorable environment. With LightningCast aiming for detection within an hour, it began highlight a cell that corresponded with favorable instability. The combination of these two helped me hone in on this cell as being more likely to produce lightning than a similar LightningCast to the northwest. The 10% contour formed just before 20z, and steadily increased leading up to the first flashes on GLM roughly 30-40 minutes later. Nicely done!
While waiting, a small cell caught my eye. The area was almost completely clear, and showed very dark on visible imagery, to being cloud covered near Palmer. This made it appear this was about to blow up, but then you can see the OCTANE tool quickly reverse course once it becomes clear it will not develop and it begins to come down on visible.
Off to our west, there were a couple cells. Analyzing the tool on GREMLIN, the southern cell was less intense on GREMLIN compared to MRMS, and reversed for the storm to the north. However, neither are particularly intense, but it does indicate to keep a watchful eye and use other products like GLM to assess intensity.
As we move past 22Z and how the WRF with PHS data, it has done an excellent job forming the convection near the Denver Airport, but by Shamrock/Leader/Adena, that cell has not formed. This is creating a region of spurious data due to convective feedback. Some of the model appears to drive convection by the cold pool from this storm meeting instability advecting in from the east. It then focuses on this cell over the others, but this appears unlikely to verify at this point given how it is performing so far. By 00z, the 0-3km SRH bullseye creeps above 1600 m2/s2 moving towards Fremont. I won’t put the image of the new cycle that just came in, but the bullseye got more dramatic over 2000 m2/s2. Not sure if how much those magnitudes are in the realm of possibility.
One of the interesting behaviors lately has been a few storms forming in the cold pool as we approach 23Z. There has been convection developing on the western side of decaying cells. This has me thinking about how this would look for backbuilding precipitation. Would it have this look of the cool purples remain anchored in place while reds for new convection continuously appear to upstream that rides atop the areas of divergence? The signals may not appear robust, since there may not be fast storm motions.
Looking back at LightningCast, I have noted the known limitation of the forecast trying to bridge separate pieces of convection. The gap seems quite large though, and I wonder if there may be other means to QC the LightningCast with existing radar without making it slow to process. Or we can trust that the human eye is capable of noting that radar will confirm the lack of reflectivity at -10 C or higher.

That’s all I have today!

Kadic
Tags: None

GLM Probabilities of 10 Flashes Followed By More Intense Convection

While more intense convection has been slow to develop in southeastern, the LightningCast probability for >10fl started to increase as synoptic forcing improved. About 13 minutes later (image below), the GLM flash extent density increased to around 30 flashes per 5 minutes, which was well signaled by LightningCast. While the probability depicted by LightningCast wasn’t terribly high (to around 15 percent initially), the upward trend in probability did signal the potential.


-Joaq

Tags: None

LightningCast Good For A DSS Heads Up…Dashboard Needs Some Work

Storms off the the west in New Mexico approaching our DSS location in far NW Texas were a great way to test the LightningCast and the associated LightningCast Dashboard. Our DSS location was focused on the “Rita Fire” that was along Hwy 385 between Dalhart, TX and Boise City, OK and partners wanted notice of a 50% probability of lightning within one hour within a 25 nm radius around the fire. Convection was ongoing across NE New Mexico one storm showing deviant motion. This storm was warned on at 2043Z for 1.5″ hail and winds of 60 mph based primarily on radar; however, Octane was being used to monitor the storm as it tracked southeastwards towards the CWA boundary. Octane showed consistent divergent signatures in the direction product and good speed decreases on the upshear side of the updraft before being contaminated by an anvil from another storm to the southwest.


    As the supercell dropped southward from NE New Mexico, the LightningCast product probabilities started to increase into the Rita Fire range ring. It was noticed that the LightningCast Dashboard remained at around 10% despite 75% probabilities along the range ring boundary indicating that the dashboard is focused on a point. This is fine if you are only concerned about one point, but most outdoor events need time to evacuate people or move equipment from the location.


While it was nice that the LightningCast Dashboard allows you to choose different time ranges and an auto refresh rate per a drop-down, I think some other options might be more helpful for support of an event. To help provide a head’s up to partners, it would be valuable to have an option to input a specified area that you would like to be alerted for…with the option of inputting those criteria. For example, being able to have a range ring or being able to draw a polygon for the area of interest and then inputting lightning criteria in there to alert you when those values are reached within your range ring or polygon. The criteria provided for the Rita Fire of 50% probability within the range ring would have alerted us on the Dashboard that the threshold had been reached. As far as the LightningCast product overall…it was an excellent resource for monitoring then alerting the Rita Fire partners once their criteria had been reached. A quick screen grab can be sent to partners as well to indicate where the greatest lightning threat probabilities are located.


– Vera Mae

Tags: None

HWT Day 2: Protecting the Quartet

Protect the Quartet!

Today we were charged with the noble task of watching over the the Quartet Festival located in Lawrenceburg TN. Gaps in the cloud coverage allowed us to utilize some of the satellite products a little more efficiently today. Our first sign of trouble came as convection began to form out in front of the main line moving WNW out of Alabama. LightningCast 60-min prob gave us our first initial heads up that lightning was possible with storms forming out ahead of the main line. A combination of Octane overlaid with GLM data was the primary source in our decision making to issue a notification to the event organizers. Thanks to our quick decision making, everyone is alive to sing again another day.


We combined lightning cast and ENTLN data with the radar to provide ground truth on when lighting was first scene within the 15 mile range ring which allowed us to issue follow up messages regarding the likelihood of ongoing lightning potential. Requesting a LightningCast point too also gave us confidence in issuing notifications to the event organizers.


Discussing the LightningCast Probability data with Kilometers we were discussing ways to get more information out of it. We settled on loading the LightningCast as an image rather than contours. This combined with the sample tool and overlayed with Total Lightning products was more useful when forecasting for a specific DSS point. We also went ahead and limited the data being showed on the lower end of the GLM Flash Density. We didn’t want to exclude the Flash Density on the lowest end all together, but we wanted to highlight and compare the GLM Flash Density to the areas with the highest Octane SpeedSandwich. Our end result was this GIF below:


Today was a day to dive into GLM and Lightning probabilities. Once we settled on what we wanted to look at to make DSS related decisions, we realized that it wasn’t intuitive to the public. We needed a way to redesign the the Lightning Cast data to be easy to look at to the public. Because the NWS already has a color table for threats utilized by our National Centers, we decided to model our threat level based on the SPC’s convective outlook to create new colors for the contours. The following graphic is the end product of that:

As the system moved past, identifying areas that we could issue the all clear on was our next priority. The LightningCast created a nice looking bell curve that lined up with the time that the MCS moved over the event and showed the trends of the storm began to wind down.


Tags: None

Missing data

Charmander and Kilometers were watching over an event in central Tennessee and employed the lightning cast meteogram. The probability of lightning tool worked (img. 1) great for alerting the event staff to an increase in the lightning threat, providing about 45 minutes of lead time.

I began to monitor the cell for further intensification and any chance that it could become severe. In the background of this work I was also monitoring for lightning activity from the cell. Eventually, the cell did produce lightning. Image two showed the ENTLN product pick up on a series of cloud flashes, with the GLM product showing some light lightning activity two minutes later (img. 3).

Positive for GLM was that the latency was not an issue. What was more of an issue was that the meteogram from lightning cast never plotted the GLM data on the meteogram. If the person working the event shared the meteogram to event organizers, they would assume this was a missed event. Positive though, is that the organizers could be shown the GLM image or ground network data and be assured that their actions were not for nothing. This left us wondering why the meteogram did not show the lightning activity picked up in the vicinity?

We saw that the GLM began showing up when the main line of convection moved through the event space about an hour later than we identified it through alternate means (img. 4).


Image one: Meteogram for the Probability of Lightning product with GLM flash Density.


 Image two: GLM Data quality (upper-left), GLM Background Image (upper-right, Day cloud phase RBG overlaid with GLM Flas Density (Bottom-right), ENTLN observed lighting flashes and cloud-to-ground strikes (bottom-right).


Image three: GLM Data quality (upper-left), GLM Background Image (upper-right), Day cloud phase RBG overlaid with GLM Flas Density (Bottom-right), ENTLN observed lighting flashes and cloud-to-ground strikes (bottom-right).


Image four: Meteogram for the Probability of Lightning product with GLM flash Density beginning at 15:15 local time.


– Kilometers / Charmander

Tags: None

Consitency with Lightning Cast

As a QLCS moved through Tennessee and the threat for severe dropped, we were thinking of a way to message the persistent lightning threat that would still be present. We leaned on the Lightning Cast tool to message this threat.


 Image one: SPC risk categories with colors.


Before we made the image though, the idea came up to re-do the contours such that they better aligned with the style guide the NWS, or SPC more specifically uses (img. 1). Image two shows how we added two contours and realigned the colors to add consistency with other operational areas of the NWS.

Image two: Lightning Cast with a new 5 and 90 percent contour added and colors of the contours aligned with the risk colors used elsewhere in the NWS. In the background is channel 2- Red Visible satellite.


We compared this with the base style from the lightning cast tool and we felt that our updated style better captured our eyes and made it simpler to interpret by us. We also felt that the public would have a better chance of understanding the product if the colors were more consistent.

Tags: None

Gremlins are dismantling the nebula!

Hi everyone!

First blog post for the Satellite Convective Applications Experiment – Week 1, let’s go!

The loop below shows an example of this from the Corpus Christi, Texas. Notice the convection moving out of the frame to the northeast is bounded by prob-lightning contours (Gif 1). My desire would be to have these better matched to the storms. Right now, the contours are too nebulous.

GIF one: MRMS reflectivity at -10 C overlaid with lightning cast 60-min probability.
Why do I care about it’s nebulousness? When I am providing decision support to an event, I want to know which cell is driving the highest probability, which is building and be able to anticipate the lightning threat based on the cells movement.
As my partner in the testbed pointed out, the anvil(s) (see image one below) were merging and this was likely causing the nebulousness.
   Image one: GOES East Day Cloud Phase RBG channel.
Our discussion began to expand to others in the testbed and an idea emerged to try and reduce the nebulousness. The idea was to use the GREMLIN Radar Emulation product to further train the lightning cast dataset so that the probabilities become anchored by the emulated MRMS product.
Below is a GIF of the GREMLIN and MRMS product. With the GREMLIN product using some of the same satellite features as the lightning cast; the two products have some base level of compatibility. And so my challenge to the developers of these products is, an these two be combined such that lightning cast is mapped to the convective feature causing the probability.
GIF Two: GREMLIN Emulated Radar on the left, and MRMS composite reflectivity on the right.

-Kilometers

Tags: None

ProbSevere and LightningCast During Severe Warning Operations

A moderate risk for severe storms was forecast for the Southern Plains with hail, wind, and tornadoes as significant threats.  Storms quickly initiated in southwest Kansas (See Figure 2) and were ongoing when the testbed started at around 19z. Primarily used during warning operations were ProbSevere, LightningCast, and radar. Thrown in for good measure I used OCTANE to aid in storm motion and direction.  ProbSevere was helpful in issuing warnings but was vital in assisting in the hail size mentioned in the warning text.

Figure 1: SPC Day 1 Outlook for June 15, 2023.

Figure 2: 2011z showing ProbHail with a MESH of 2.17” provided the confidence to mention 2-inch hail in the text.  There were two separate storms that eventually merged later in the afternoon.

Figure 3: storms were beginning to merge and ProvSevere was as well and thus prompted just one warning instead of two.

Figure 4: New warning with ProbSevere now depicting just one storm.

Figure 5: Storms continued to merge and evolved into a wind signature more than a hail producer.  Thus the ProbWind had a nice uptick to 68% at 2133z.  Before this time it never rose bout 40%.

Figure 6: Once the convection evolved into a linear wind producer, LightningCast became helpful in how far east to extend the polygon.  I used the 75% contour and issued a 60-minute warning.

Figure 7: Captured much of the event to show the evolution of convection and ProbSevere.

Figure 8: OCTANE aided in determining the area of cell merger in southern Grant and portions of Stevens Counties. 

– Podium       

Tags: None

6/15 Feedback for AMA

PHS

The surface based CINH at 20z lined up rather well with the satellite imagery showing the slightly more stable clouds over the eastern CWA.

When sampling an image versus contours, the contour sampling has the entire product name in the readout

PHS captured the initial convection just east of AMA well, even though the convection started an hour earlier than PHS indicated.  Image on right is PHS SB CAPE and contours are PHS SB CINH.  Home is roughly where the storm is located.  Satellite image is around 1930z and PHS forecast is 21z when CINH dropped from 80j/kg to 40 j/kg.

PHS did a reasonable job predicting the general storm coverage by 21z from the 16z run.

Toward the end of the exercise, the storm coverage was well captured by the PHS 16z run.  Should have taken this into account for my public graphics when describing the storm evolution.

NUCAPS

This is a NUCAPS sounding in the TX panhandle near AMA vs. a RAP40 sounding at the same point.  The RAP has the same trend in the dew point profile as NUCAPS, but is lower.

Noticed the NUCAPS sounding didn’t have the lower dew points around 400 mb as shown in the special sounding.  NUCAPS did have a hint of the weak cap near the surface though.

NUCAPS 700-500mb lapse rates from the gridded data was a constant 34.17 C/KM across the map.

NUCAPS forecast for ML CAPE was slightly less than what SPC mesoanalysis had at the same time of 20z.

NUCAPS ML CINH was higher than SPC Mesanalysis for 20z, with some parts of the CWA having almost 90j/kg of CINH south of Liberal, KS.

The 700-500mb lapse rates matched well with SPC meosanalysis for 20z.

OCTANE

OCTANE showed the cumulus developing along the dry line and warm front well.  Can also distinguish which clouds are becoming taller.

OCTANE highlighted where convection was taller, and Lightning Cast started to show probabilities for those same updrafts.

ProbHail

Noticed what could be an above anvil cirrus plume with the storm in question.  Prob Hail only had a 35% chance for severe hail at the time.

Prob Tor

Noticed the Prob Tor jumped up depending on what cells it was encompassing.  Took three screen shots to denote the trend.  Seemed reasonable for it to increase since the end cell was ingesting the dry line at the time the probabilities increased.

-Rainman

Tags: None