

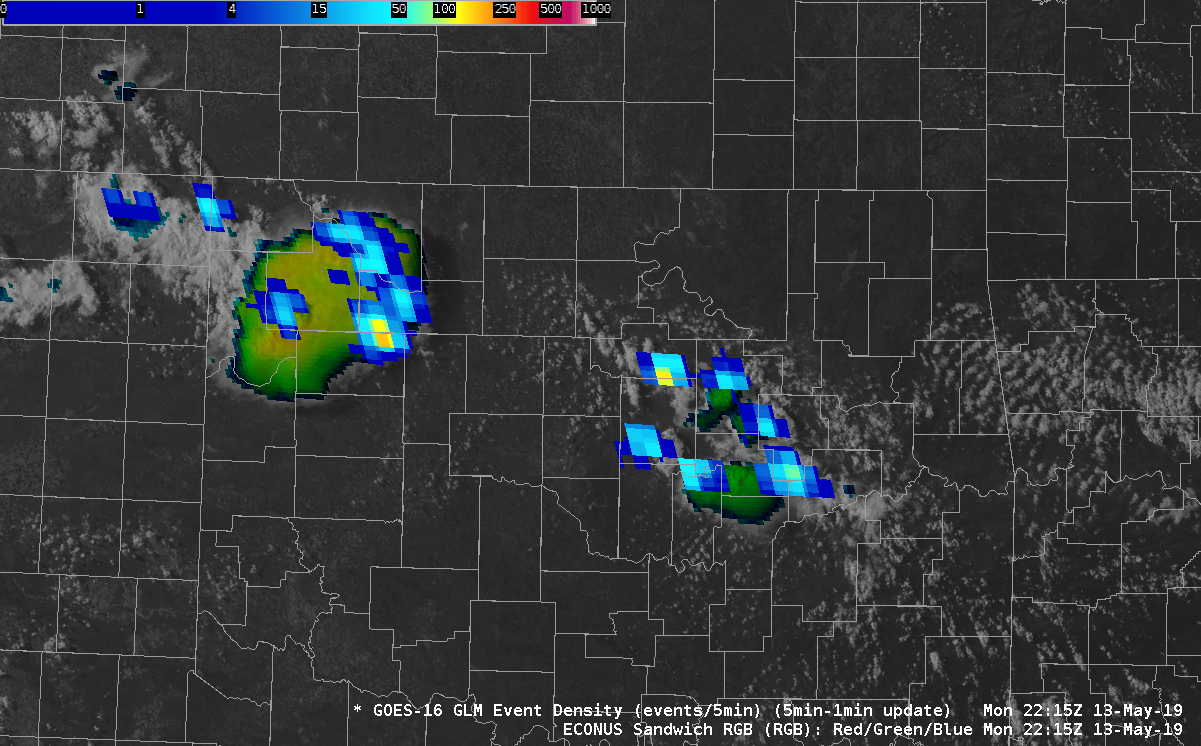
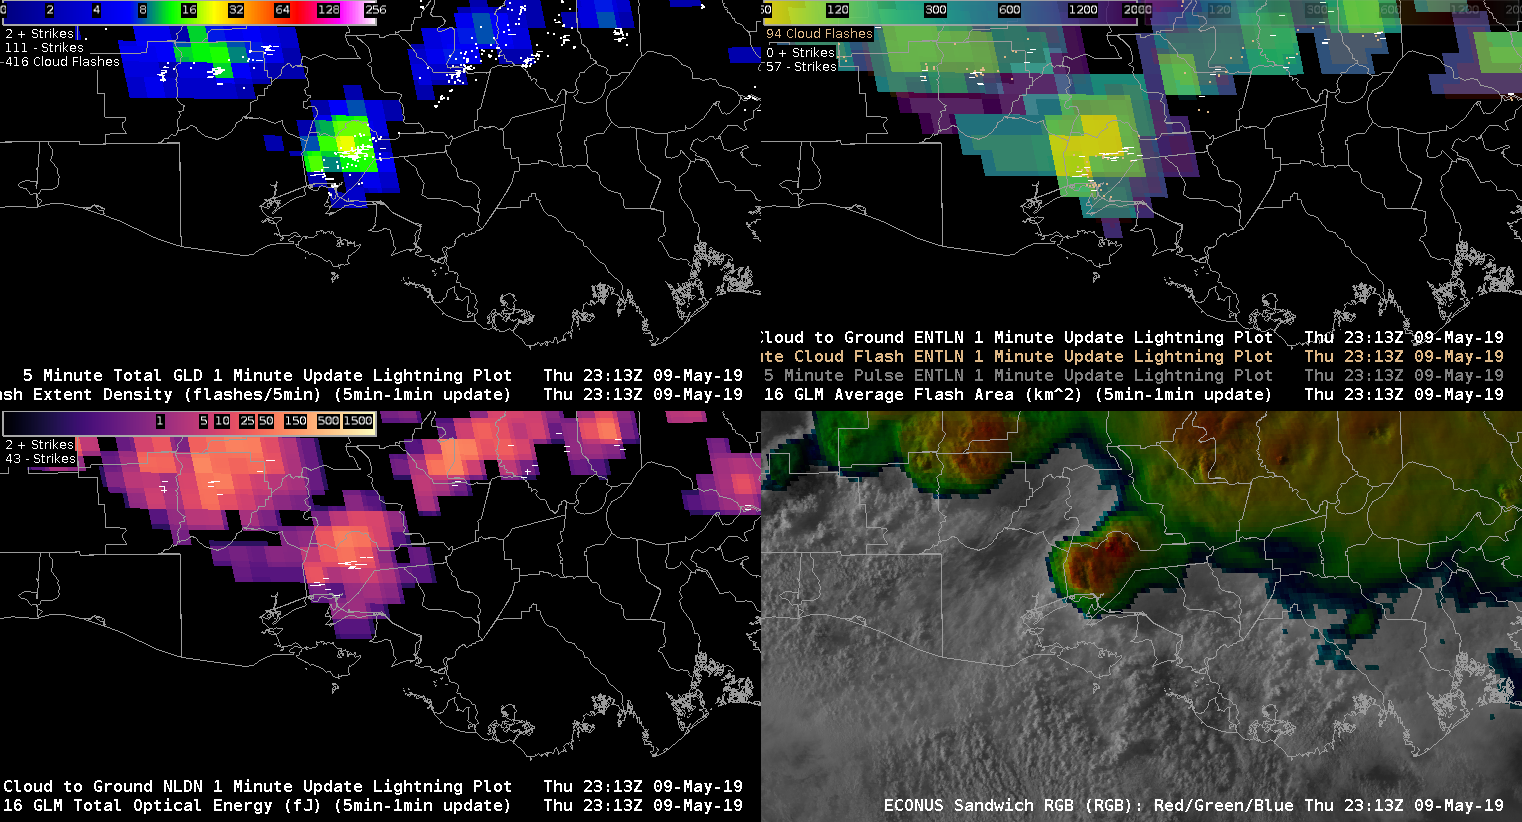
Image 1 shows the GOES16 RGB Composite VIS/IR Sandwich. This product displays the texture of the convective cloud tops and the temperature of those cloud tops. The texture and temperature of the clouds provides information about the updraft. The 2nd image shows the most intense GOESR GLM event densities and how they correspond with the taller clouds and strong updrafts. – Jonathan W. Smith (ESSIC/UMD)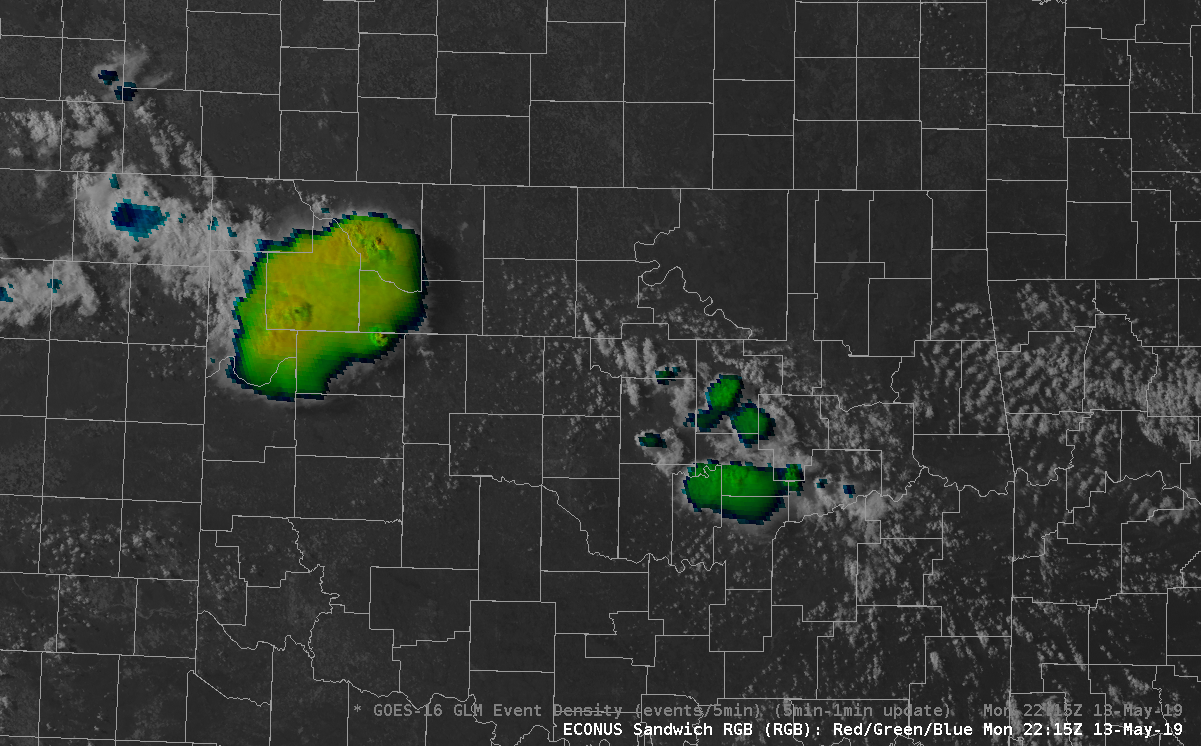
 .
.
Category: HWT
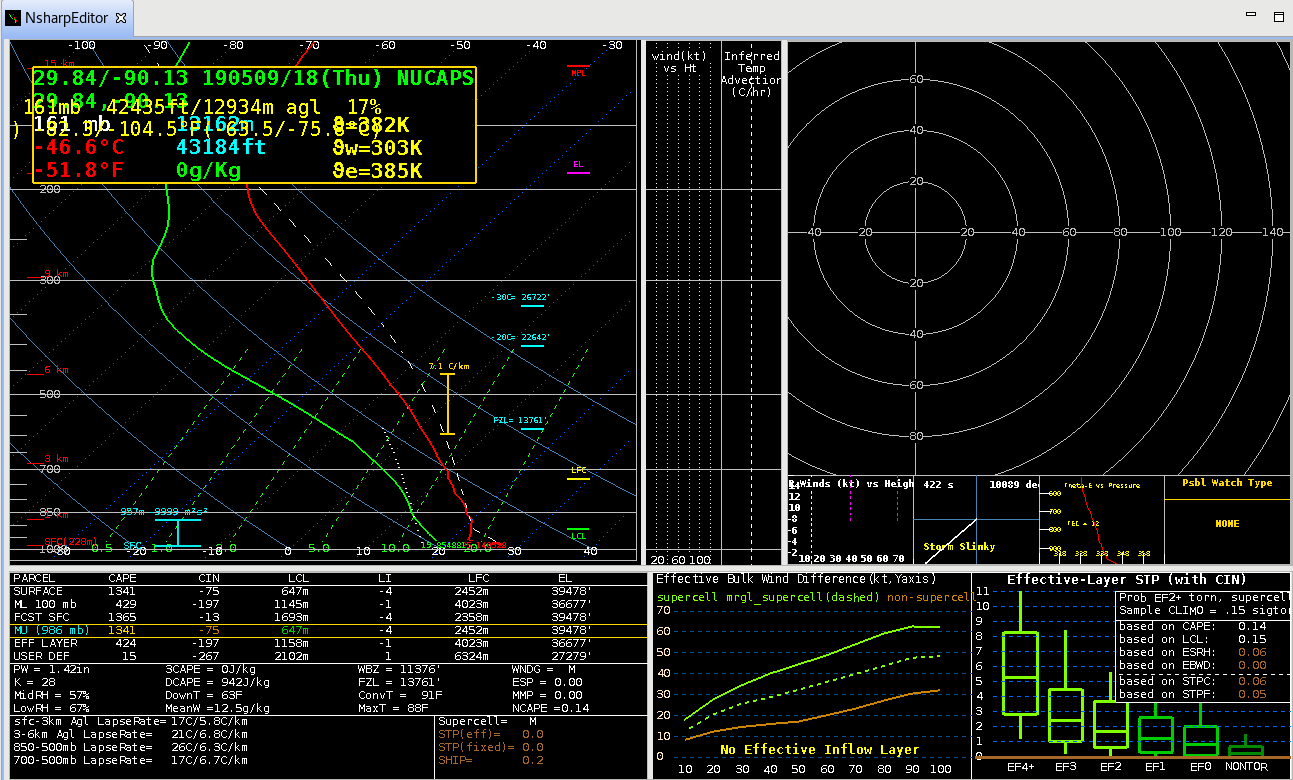
unstable NUCAPS soundings east-southeast of TX convection
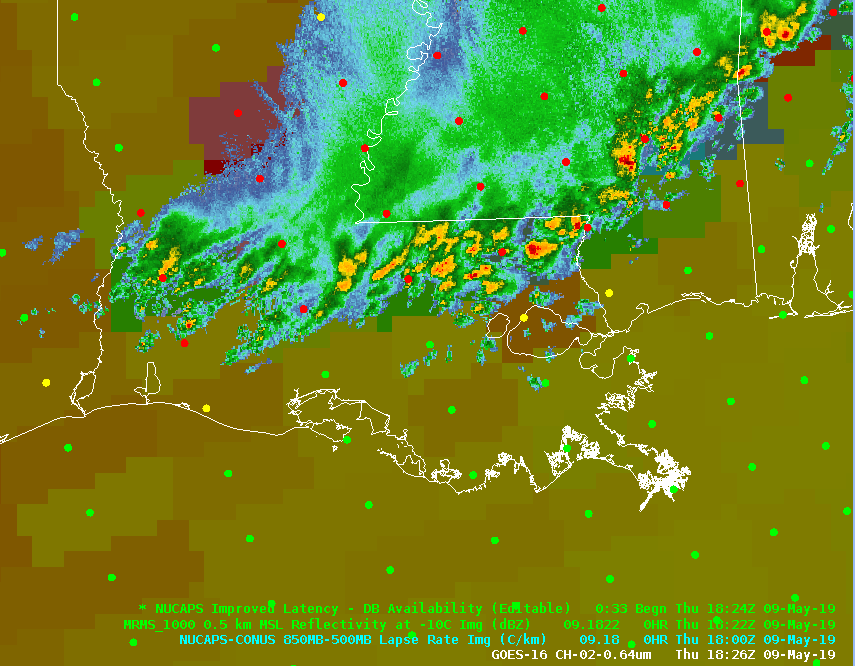
The 1921Z NOAA-20 overpass is now in and there are many valid soundings to east-southeast of convection in west Texas. Several soundings indicate CAPE above 1500 J/kg with a few soundings over 2000 J/kg. Below is a short loop of GOES-16 channel differences between 1.6-2.1 microns and the NUCAPS sounding quality control.
The black circle indicates the selected NUCAPS sounding depicted below with MUCAPE of 2188 J/kg.
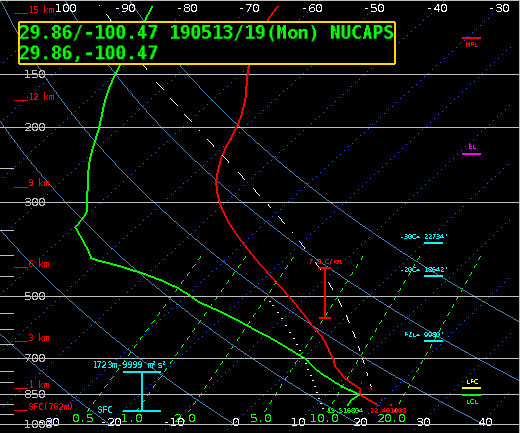
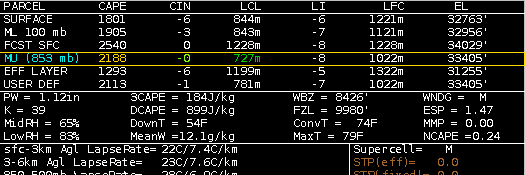
This sounding (centered on Edwards County) as well as neighboring soundings were obtained over fairly homogeneous terrain and surface topography doesn’t appear to be complex and therefore problematic for near surface layers. These soundings are near the edge of the NOAA-20 swath, thus they are much larger than the nominal 45-km spatial resolution at the center of the swath.
Brian Kahn
Storm Trends – ProbSevere
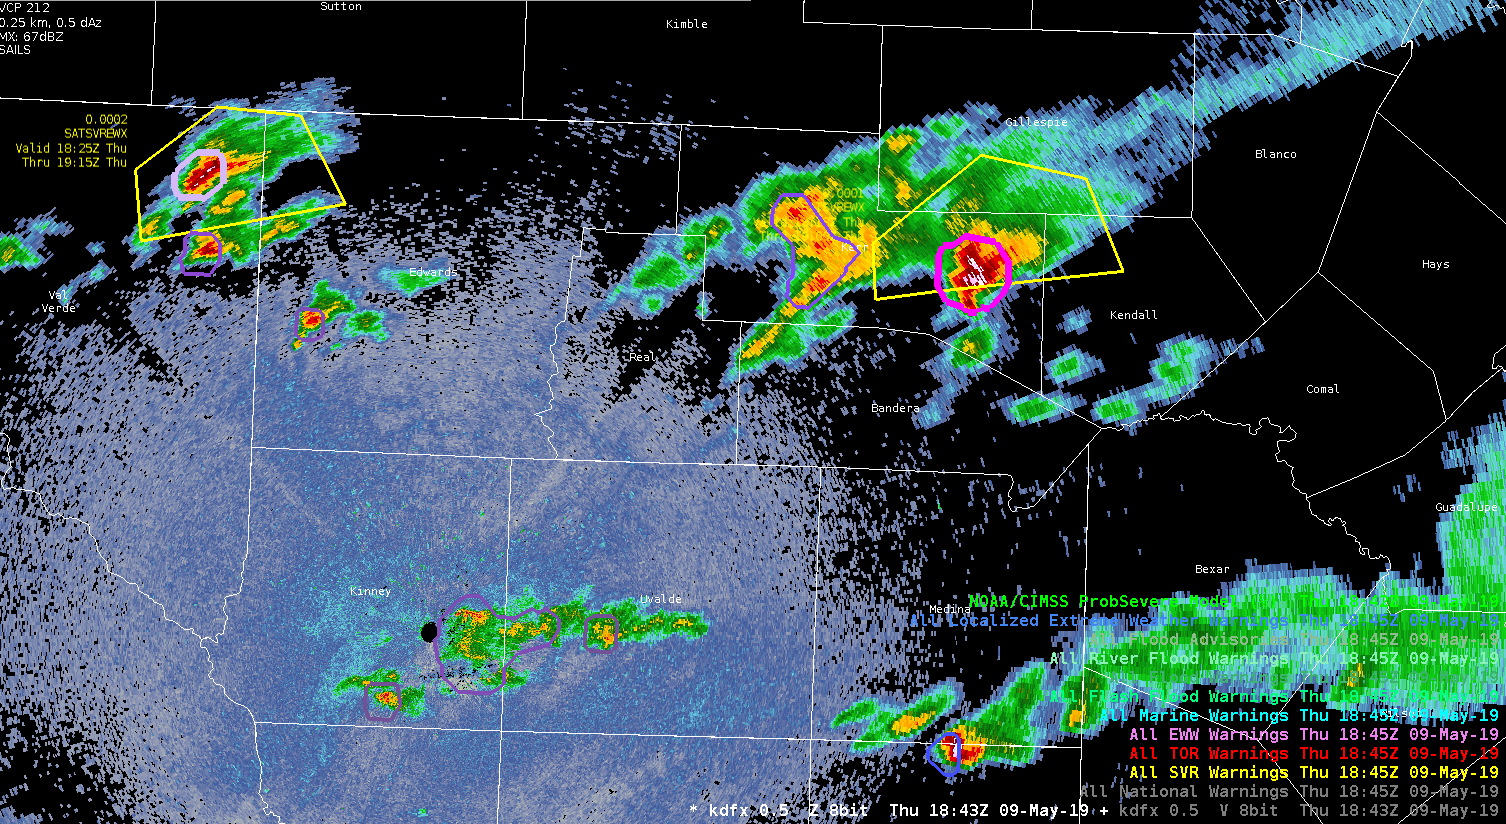
While the storm looked strong to possibly severe on radar, the trends in the ProbSevere Time Series were indicating a downward trend/weakening. Thus, I chose to held off on issuing a SVR. The storm did ultimately weaken, as the ProbSevere Time Series was indicating. Note, in the image, the warned storm on the right has lower probs, but was stronger in earlier scans and had produced severe hail.
WHOA NUCAPS!
As we were wrapping up the work for the day, an updraft rapidly grew over part of the CWA we were in. I went back and looked at NUCAPS FCAST CAPE data that I had originally discounted as discussed in a previous blog post. While it appeared at the time that the NUCAPS FCAST CAPE values weren’t viable from a forecast perspective, turns out this storm fired off the edge of the CAPE gradient that the NUCAPS FCAST represented better than the RPM13.
 This was my first exposure to NUCAPS FCAST this week as it wasn’t available….it’s worth a second look. It’s also an indication that you need to work hard and diligently through the end of the shift!
-icafunnel
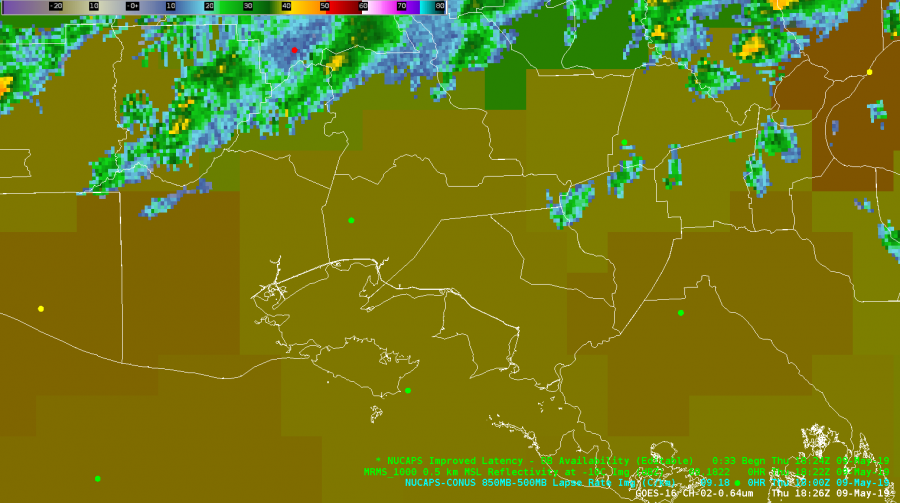
NUCAPS Comparison with Special 17Z Sounding
Today we were tasked with the LIX CWA (New Orleans/Slidell, LA), and the NUCAPS sounding went overhead at 1824Z. Luckily there was a special sounding out of the LCH (Lake Charles, LA) office at 1700Z so there was at least a loose chance to compare the data. So, let’s do just that! First the LCH sounding…
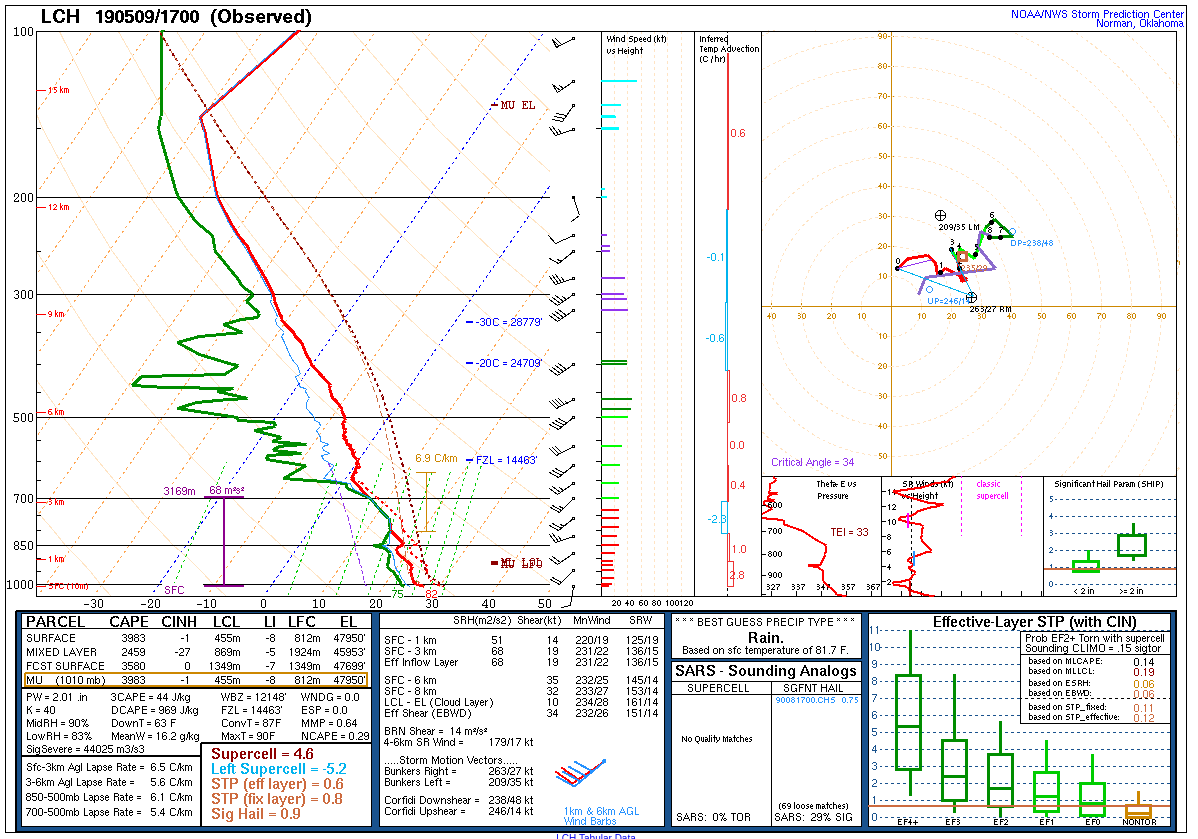
Shows a relatively unstable atmosphere with decent lapse rates in the mid-levels. And now the nearest good-value NUCAPS sounding (taken just north of Vermilion Bay)…
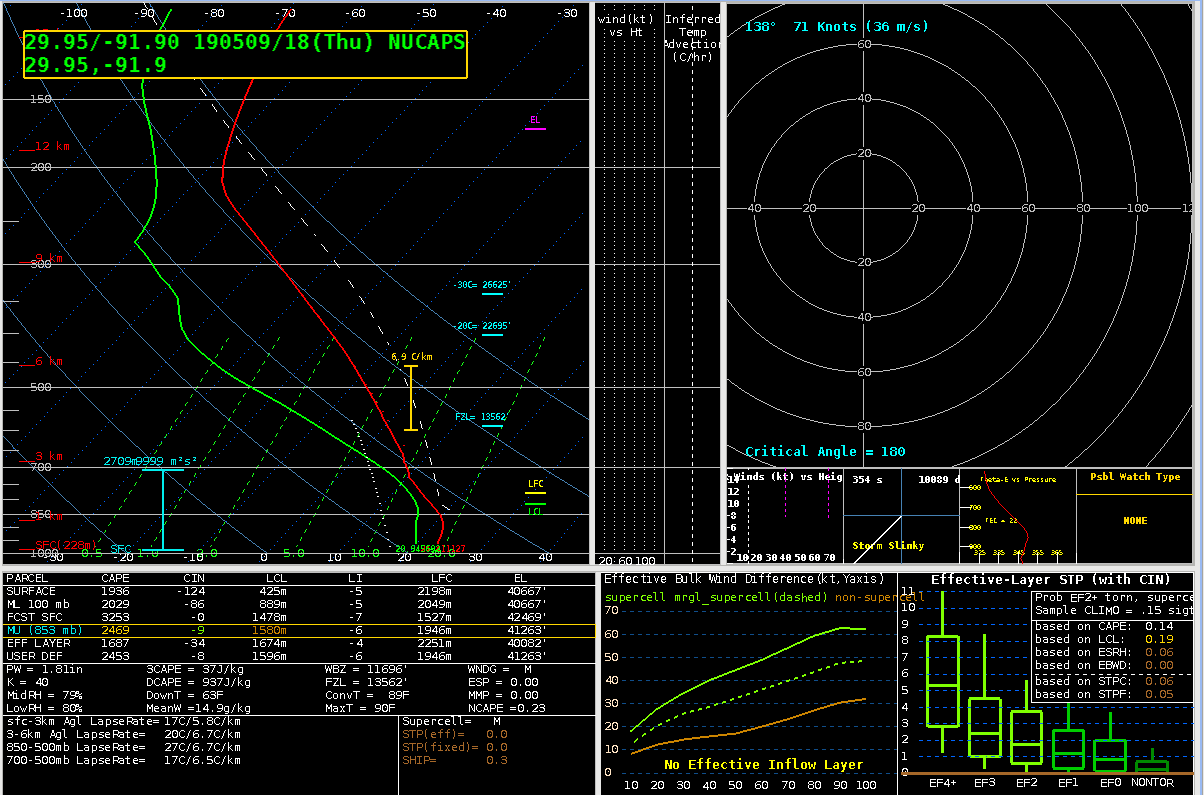
The two soundings aren’t an exact comparison, they aren’t in the same location or taken at the same time, but synoptically it should be a pretty similar environment ahead of the broken line of storms moving into the area. The biggest problem comes in the boundary layer with values that are way off. The profiles were showing a 2m value of 76/70 when in the observed sounding it was 82/75. Given that the sounding was taken earlier in the day, it’s troublesome that the temps were much higher than the NUCAPS sounding. Unfortunately, modified soundings were not available on this day and given the unmodified soundings inability to correctly analyze the boundary layer, it makes trusting any surface derived data near-impossible. The only application I can see for these soundings are to analyze the upper-level synoptic environment (i.e., upper-level lapse rates, relative humidities, etc.) For this, you can compare some values… 850-500 Lapse Rate was 6.1 C/km in the NUCAPS sounding it was 6.7 C/km, some variability is expected and it’s not too bad but the difference is worthy of caution. In the gridded product somehow the Lapse Rate was 6.48 C/km, much better given the expected variability but I’m not sure these values are different. Are the gridded data not derived from the soundings or vice versa? Mid-level RH in our LCH sounding is 90%, yet in our NUCAPS sounding it’s 79%. I’d expect these values to be a bit closer given the strengths of NUCAPS, but it’s close enough to perhaps chalk up to differences in space and time.
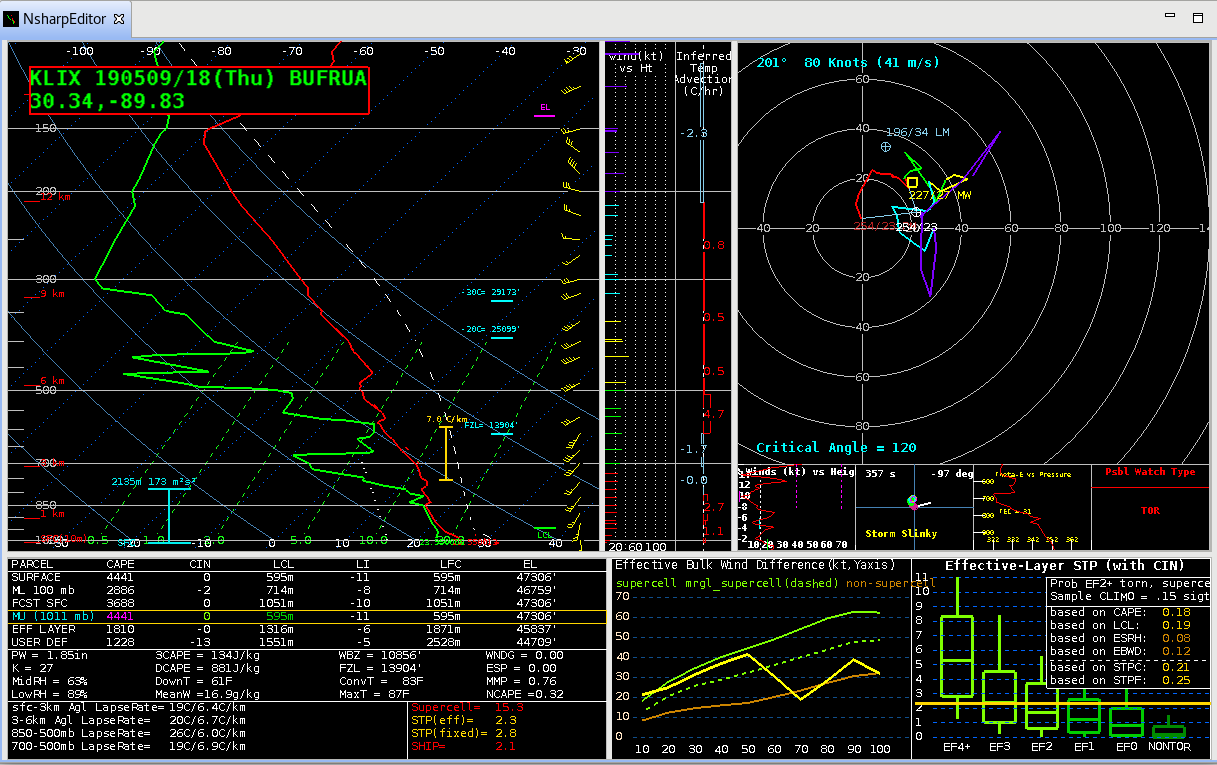
Afterwards, I saw that LIX also had a Special Sounding that could be comparable, I’ll leave the comparisons below…
#ProtectAndDissipate
NUCAPS FCAST
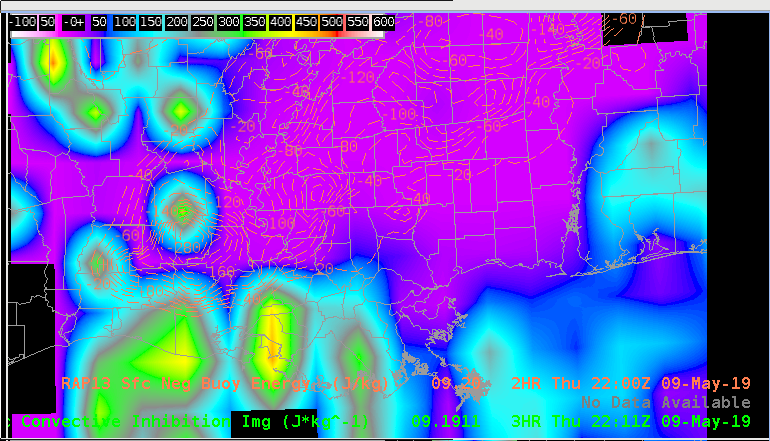
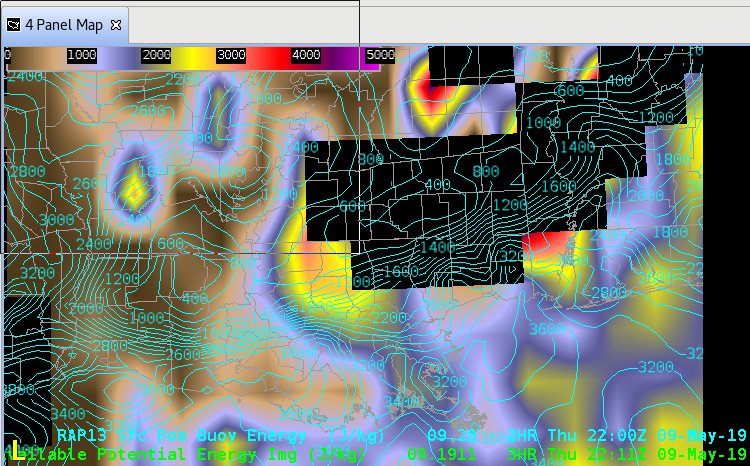
Knowing that the NUCAPS FCAST information was in today for the first time this week, I decided to do some analysis of the fields. Initial thoughts are that the missing blocks of data (not sure if that is typical – more visible in the CAPE field in top image – similar data holes observed in LCL, LFC and EL) make it hard to have confidence in it at first glance.
CAPE (Top Image)
NUCAPS FCAST CAPE data isn’t good in the pre-storm environment along the LA coast. RAP13 initialization is overlayed for comparison. RAP13 values are 2500-3500+ and much more representating thatn the NUCAPS values that in some cases are less than 500 ahead of the line.
CINH (Lower Image)
While these values appear to be more closely representative compared to the RAP13, the inability of the product to adequately represent the boundary layer at times during the week don’t provide me much confidence for these surface based stability parameters.
-icafunnel
NUCAPS_Ahead of Line
 NUCAPS data in advance of convective line today. Iberia County METAR station coincides with NUCAPS operational sounding (modified soundings not available today).
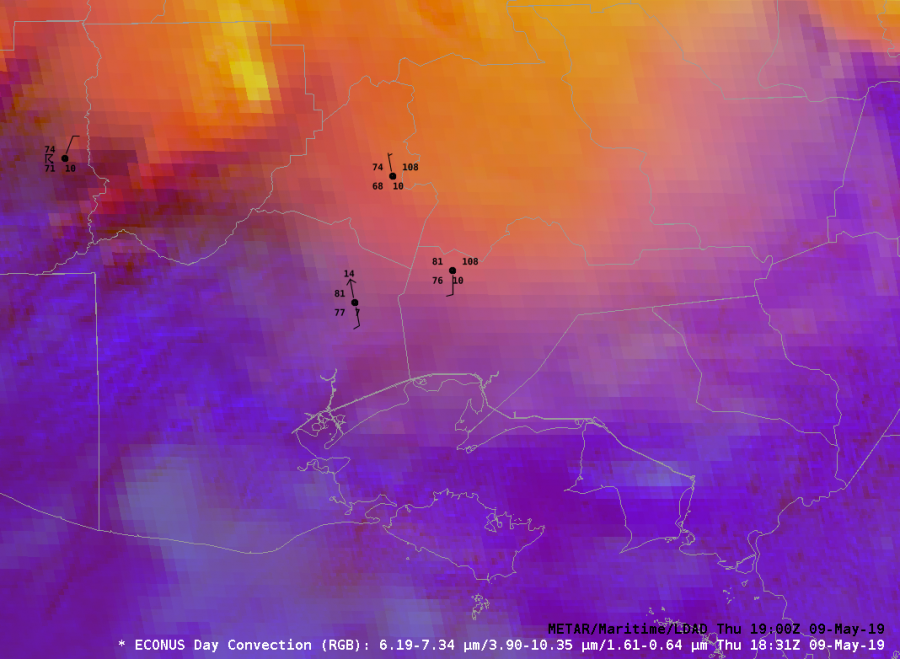
As you can see from the plotted NUCAPS sounding below, the surface values are too low. From the METAR in western Iberia County, you can see in the first image the the T/Td values are 81/76. Sounding surface values are 76/70. Other sounding points in the pre-storm environment are also about 5 degrees too low on temp and dew. While I can modify these, it doesn’t give me confidence in an accurate representation of the boundary layer and on any day expected to be busy I’d likely use other products.
-icafunnel

MRMS and ProbSevere – SAD Match made in the EWP
Wanting a good way to keep up on the environment while also monitoring for storm development? Give this combo a tryout (and note, I totally stole this from another EWP participant this week. Why? Because it works!)

Top left: MRMS Reflectivity at Lowest Altitude (RALA), Reflectivity at -20C, ProbSevere All
Top right: MRMS Maximum EstimatedSize of Hail (MESH), MRMS 60 Minute Hail Tracks (50% Alpha), ProbHail
Bottom left: MRMS Vertically Integrated Liquid (VIL), MRMS Vertically Integrated Ice (VII, 100%), ProbWind
Bottom Right: MRMS 0-2km Merged Azimuth Shear, MRMS 0-2km Rotation Tracks 60-minute accumulation (35% Alpha), ProbTor
The nice thing with this display is that you can quickly sample any of the objects to get details on what is going on with any given storm to keep situational awareness.

Yeah, that’s a lot of text on the 4-panel but each one is specific to the threat in the pane and the ProbSevere (top left) is a bit of everything mixed in. So far, it has worked with all convective modes we’ve seen so far in the Testbed.
-Dusty
GLM Minimum Flash Area Indicates Convective Weakening
GLM Minimum Flash Area indicating potential weakening in convection. Larger area/extent is likely due to lightning along the anvil, and less localized/shorter distance also indicates potentially weaker updraft. Reflectivity in this example also confirms weakening of the convection.


HWT Issues SVR 3-Min Before Field Office Does Due to GLM & ProbSevere Data
A strengthening thunderstorm in Val Verde County was noted by Prob Severe and GLM data. The Average Flash Area and Minimum Flash Area values quickly increased in the area of a strengthening updraft across Val Verde County. The combination of these factors, along with a noted uptick in ProbSevere data, prompted the HWT warning forecaster to issue a SVR for Val Verde County at 1:25pm CDT with WFO EWX issuing a SVR for Val Verde at 1:28pm CDT. 

