GLM usability in heavily parallaxed locations

It’s pretty clear to me that both the GOES-west and GOES-east are having a lot of trouble detecting lightning (GLM) in the northwest U.S. with accuracy of location or frequency due to parallax, spatial resolution, and GOES tilt sampling of storms. Below is an animation specifically over southwest Montana where the GLM displaces the FED significantly (side note: TOE was very similar for these, so FED is shown for best example), and also has trouble picking up in-cloud pulses. The ENTI is overlaid in pink to show the differences in GLM vs ENTI. If you watch closely, the first frame depicts an ENTI in-cloud lightning flash & pulse in the far southwest portion of the screen, where no GLM FED (or TOE; not shown here) was even detected. There is also some instances where the GLM places lightning pixels where the ENTI or NLDN does not show anything in the same time frame (also making it hard to verify both products).


Below is a separate example where the FED does not show what I would expect it to show for a central Wyoming storm (differentiating intensity as well as location and timing). The GOES-east is the first to detect, then the GOES-west detects thereafter. GOES-east and GOES-west did not detect at the same time in any frame. Both products are loaded as a 5min-1min update.


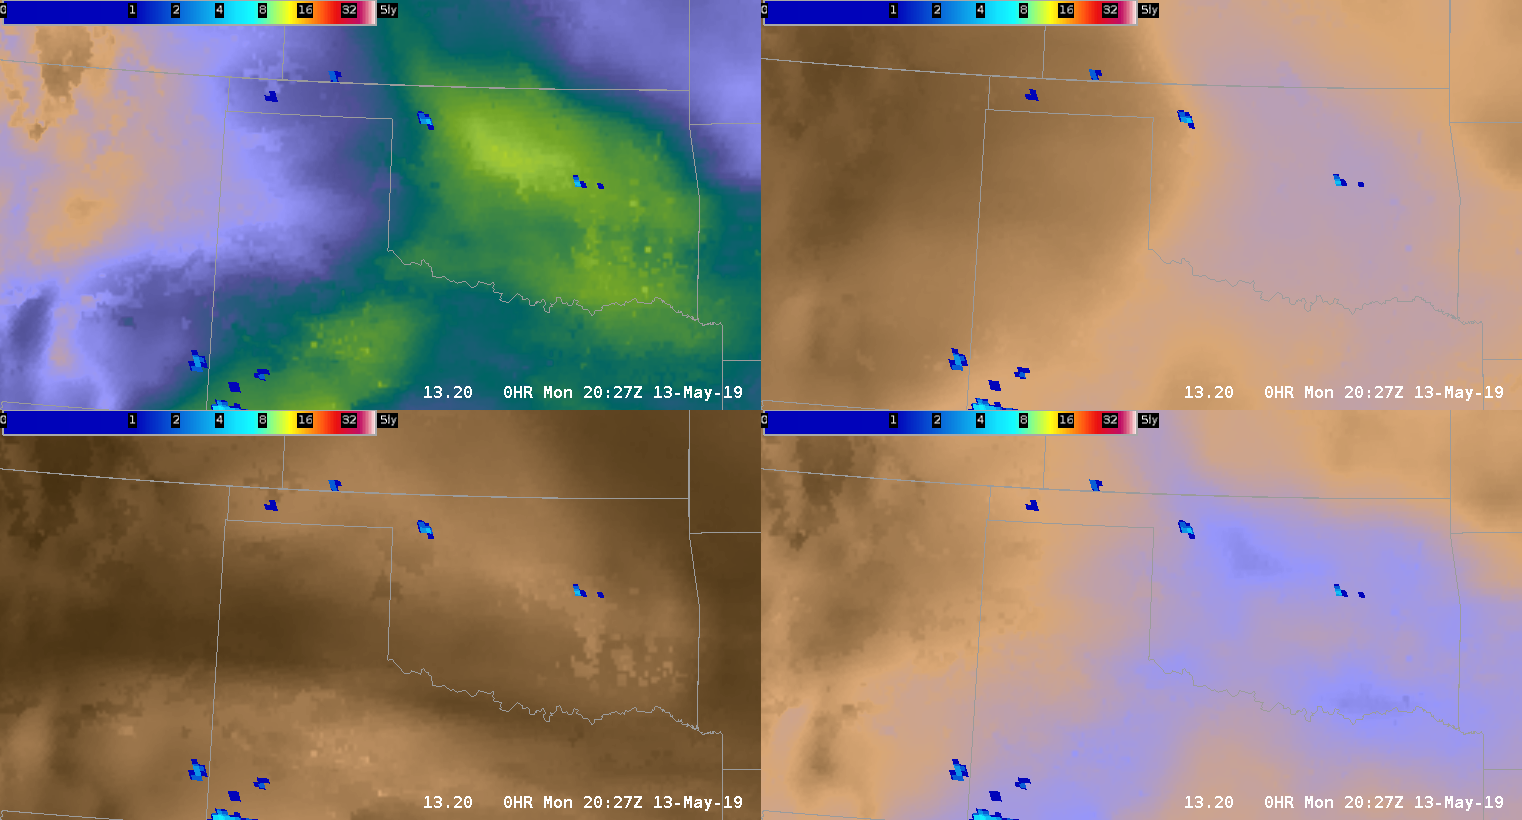
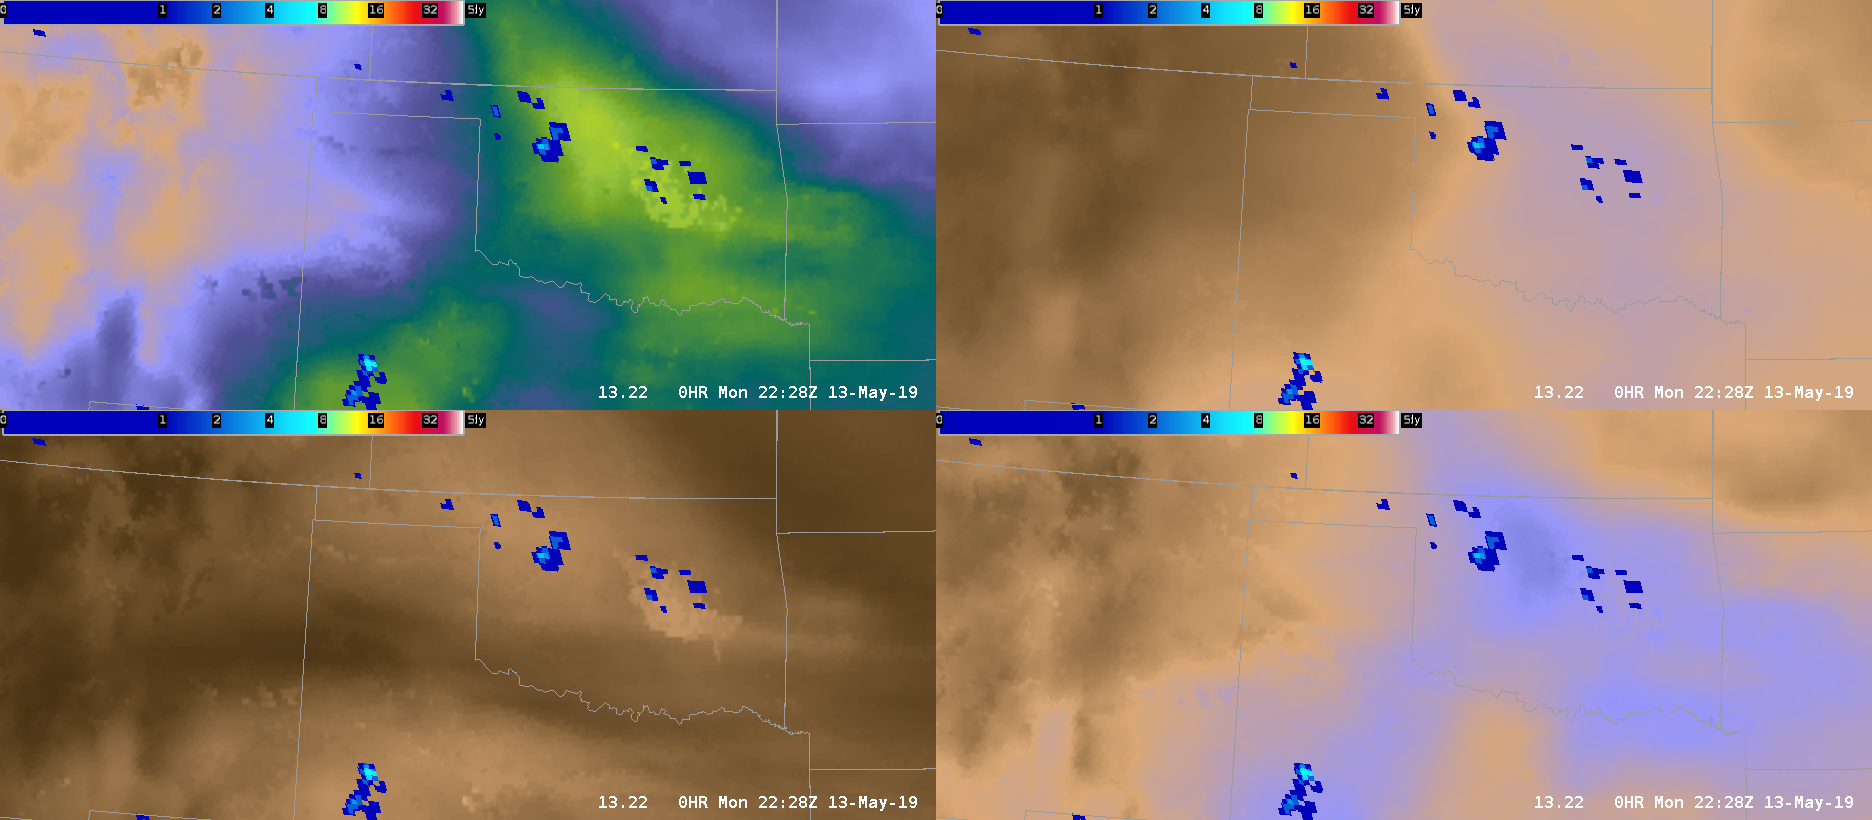
Now here’s a case farther south in New Mexico where a storm cell is of comparable intensity as the northern examples. The GLM detection seems more accurate than the MT case, but the last frames here show that the GLM also has trouble with keeping FED on the cell core of interest.

Interestingly enough, the TOE (shown below) does a better job here  in NM with spatial coverage than it did up north in MT, but still has displacement issues comparing to ENTI and MRMS storm cores. I find that the TOE (especially with GOES-west) does a better job at recognizing the spatial extent of a flash here than the FED product did. (See above vs. below).

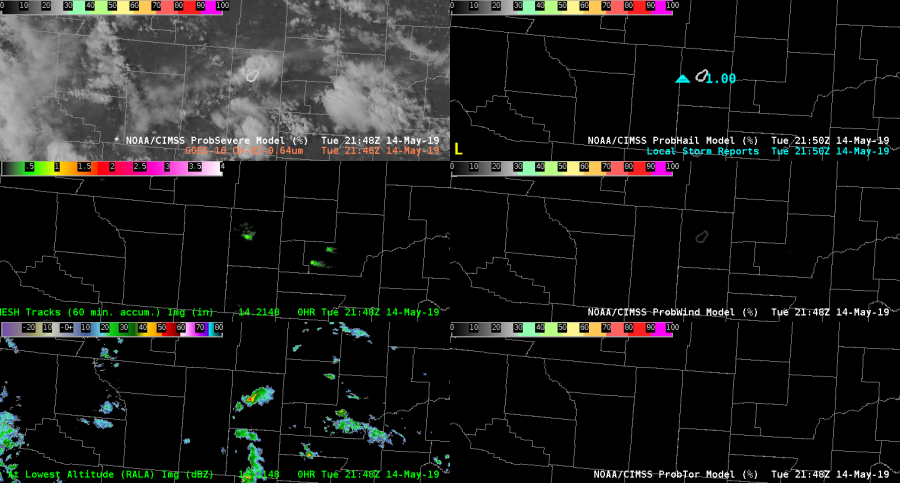
Now the question is, is the parallex better in the south-central U.S.?  And what if we look at higher resolution products like the group centroid density GLM product? While comparing the satellite GLM, with Day-Land-Cloud-Convection RGB, and with the ENTI/GLD/NLDN strikes (overlaid in pink) in SE Missouri…..it’s clear that a forecaster should not solely rely on GLM for core lightning locations (below). -shearluck

ProbSevere

Overall impressed with the performance of Prob Severe today. Quick way to distinguish between weak/strong/severe storms. In this example from the high plains of Wyoming, there was an organized storm that Prob Hail spiked to 90% about an hour before the 1.5″ hail report, and remained at elevated to 75% at the time of the hail report. Don’t mind the low (3%) threshold for the ProbTor outline, as it is an easy way to keep that important piece of information quickly viewable by the warning forecaster.

— warmbias —

Reiterating the use of GLM over open water

A great example of GLM usability is over the Gulf of Mexico (or any open bodies of water) where radar coverage and ENTI lightning sources diminish. Here’s an example of how a system moves eastward over the Gulf: radar disappears, but GLM (and some NLDN/ENTI) lightning data still lets you know where the strongest storm updrafts are located. Not only that, but the spatial extent of lightning is better known now that you have GLM alone. Below is displaying radar and satellite with FED GLM data, and NLDN/ENTI lightning detection. ProbSevere also becomes less relevant. The separate updrafts are easily distinguishable toward the end of the animation using FED.

Next animation is the same, but with FED on top of radar making it easier to see its evolution and usability:


Now with the same scenario, comparing the Minimum Flash Area (MFA) GLM product with the Average Flash Area (AFA) GLM product, it is MUCH easier to differentiate new convection with the MFA product. Notice all of the yellow spots in NM and Mexico that make it easily detectable with the human eye as you watch your SA monitor. This may be a product of color scale for the AFA, but this tells me that the MFA would be more useful in convective initiation. I have not gotten much value out of the AFA  as I would with just simply using the FED (Flash Extend Density GLM product) or TOE (Total Optical Energy). -shearluck

TOP IMAGE: MFA       ;     BOTTOM IMAGE: AFA

Day 2 Blog According to Orca

Conditions across MO today are relatively quiet for this time of day.  LAP stability indices are getting elevated (CAPE 2100, TT mid-50s, LIs -6 ish, K 32-35) but the bulls-eye for that  is remaining in eastern KS.   H7-H5 LR remain 6-7 thru midnight, after which will be  appchng 8 thru mid-morn across west central MO.  This is a result of genesis of a shallow SFC Low in West Central MO in early morning hours that drifts across MO thru EOP.   So still forecasting early evening, ISOLD TS across the  MO during that time as TT, LI and CAPE indices are elevated then as well.  VWP indicating weak LL shear at this time.  All thing considered, severe threat is low thru EOP. 

Separating threats in D2D with ProbSevere2

It’s nice to break out ProbHail, ProbWind, and ProbTor as separate displays (right hand column below) – something that is not even possible with the ProbSevere v2 placefiles.

ProbHail was the greatest threat (far upper left panels), topping out around 33%, and culminating in a quarter size hail report (below, upper right). It’s been pointed out that ProbSevere has been much harder to calibrate out west where there are fewer reports and thermodynamics are different. So, it’s really all about trends instead of quantities.

#MarfaFront

ProbTor reliable? Lightning says no, MRMS says maybe.

There is difficulty with having confidence of the ProbTor portion of the ProbSevere product due to an instance where it is estimating higher tor rates (8%) when a storm has no identified lightning (GLM, NLDN, and ENTI) along the coast of Florida. To be fair, the storm previously did indicate some lightning with it. I investigated the TOE, FED, and Min Flash Area in the vicinity of this storm, as well as usual point lightning data in 5 and 1 min updating intervals, and it has me confused as to what the ProbSevere is “seeing” for its lightning data (it is indicating ENTI lightning within its circle). Below is the image example of ProbSevere loaded alongside lightning data including GLM’s Min Flash Area:


I also pulled up the lowest level rotation tracks from MRMS data, and it did indicate a slightly higher maximum within the ProbTor circle, so I believe the ProbTor is locking on to that feature.   – shearluck


AllSky vs. ProbSevere: Which MLCAPE is best and where?

When utilizing the AllSky CAPE image product (MLCAPE), and comparing it to the ProbSevere MLCAPE values for reliability purposes of both tools, it is noticeable the differences between the two when there’s precip. This is due to the fact that most rain areas will not be able to be sampled by the satellite (clear/cloudy), and will be utilizing the GFS data in these areas where ProbSevere is located.

One way around this difference reliability issue is to scan the surrounding areas that are utilizing satellite data (preferably a “clear” spot), and in those cases, the MLCAPE values sampled seemed more comparable to the ProbSevere MLCAPE (RAP) of the storm than that of the GFS sampled MLCAPE data. The GFS sampled locations almost always show a lower MLCAPE value than the ProbSevere MLCAPE. The downside of sampling farther away from the storms/precip areas is that you are sampling rather far away from the storm environment. It’s also difficult to say that the ProbSevere MLCAPE is more accurate or not and what the reliability factors may be.

Below is an example of a storm over TX that is sampling the MLCAPE of the GFS (green text) and of the ProbSevere RAP (white text). -shearluck

Fun 30 minutes of storms in Florida

There was a nice area of convection moving off the east coast of Florida with storms forming off an apparent outflow boundary moving to the south. As the storms moved off the coast they increased intensity exponentially. Focusing on these storms as they moved over water reflectivity showed max dBzs in the low to mid 60s with tops 45-50k ft high. GOES-16 Event density (5min-1min update) showed a value of 247 suggesting a nice updraft, which AzShear seems to further support with a bright white color and value of .007s^-1 exactly where the max dBzs/echo tops/GLM data is. In addition,prob severe did a good job of tracking the storms…but with the storms moving off the coast it is impossible to get any storm reports to verify its accuracy.

Utilizing all of this data I would most definitely want to issue a localized small craft or some sort of marine advisory or warning…if there was one for this are. -Desmond

AzShear .007s^-1

GOES-16 Event density (5min-1min update)

Max dBzs in the low to mid 60s


Marginal Day in the HWT

Forecasters are beginning the day located in both the Melbourne, FL and Kansas City/Pleasant Hill, MO CWAs each with very different environments.

SPC Day 1 Outlook 14 May 2019

Ongoing convection with a focus on lightning is in store for forecasters in the MLB location.  A (semi-stationary) frontal boundary across central Florida combined with the sea-breeze and plenty of low-level moisture is providing a decent environment for storms capable of producing lightning and high winds.

Surface observations and radar over the SE United States

Forecasters beginning in the EAX region will likely be diagnosing the environment and pre-convective initiation products for the first half, if not majority of the operational hours today.  Later today, we expected isolated convection to develop with enhanced lapse rates and associated increase in CAPE as well as increased low-level moisture.  The HRRR doesn’t initiate convection until ~0200 UTC, but hopefully we will see activity a bit earlier.


-Kristin Calhoun


Tags: None

Convection on LL PW Gradient

Convection began along a low level PW gradient across NW OK per GLM Flash Extent Density. Expected forecast: Based on steering flow, the storms should move into a more moisture rich environment and expand in coverage.

2027Z Upper Left: TPW, Upper Right: Sfc to 0.9 sigma PW, Bottom Right: 0.9 to 0.7 sigma, Bottom Left: 0.7 to 0.3 sigma PW

A little while later…Storms continued to expand eastward along the gradient into the more moisture rich environment.

2228Z Upper Left: TPW, Upper Right: Sfc to 0.9 sigma PW, Bottom Right: 0.9 to 0.7 sigma, Bottom Left: 0.7 to 0.3 sigma PW

-Tempest Sooner