Here comes the moisture

The AllSky Layer Precipitable Water clearly shows the moisture return this morning into southern Texas and Central Oklahoma. PWATs across the Red River were ~0.5 inches early this morning and have now increased to ~1.5 inches this afternoon.

This product is a great situational awareness tool to survey the pre-storm environment. -Atlanta Braves

AzShear Depicting Highest Tornado Threat

The 0-2km AzShear product is depicting the highest tornado threat along the convective line. There is a maxed-out area of 0-2km AzShear along this line.

This makes sense given extreme low-level shear values in this area with easterly winds at the surface lengthening the hodograph. According to the RAP, 0-1km SRH values are in excess of 400 m here.

Ron Dayne

Difficult Warning Decision as Storms Enter LSX CWA

The northern extent of a line of storms that has produced sporadic wind damage is approaching the LSX CWA from the south. One of these storms has good reflectivity structure with a tight front reflectivity gradient and a rear inflow notch. However, these storms appear to be entering a more stable airmass. This is reflected in the ProbSevere probabilities of the storm in question compared with one just a bit further north:

The northernmost storm with the cool contours has only a 22% ProbWind and is in an environment of only 715 J/kg MLCAPE (per the sampling feature). Meanwhile the storm in question to the south in the warmer contours has a 90% ProbWind with 1220 J/kg MLCAPE. These storms are moving to the northeast toward the more stable air. Incidentally, the All-Sky LAP CAPE does not depict as sharp of a gradient in the CAPE compared with the RAP-derived ProbSevere values:

I am not sure which is more accurate but I suspect the model-derived values are more accurate in this situation.

Furthermore, a weakening trend in the Flash Extent Density is observed on the northern end of the line:

This storm still deserves a warning, but we will see how quickly it weakens.

Ron Dayne

GLM Storm Intensification

Storms are trending sub-severe across most of our CWA at this hour, but 1 cell behind the initial line started getting its act together. Here is the GLM Flash Extent Density (top left), GLM Minimum Flash Area (top right), GLM Total Optical Energy (bottom left), and KLZK base reflectivity (bottom right) before the cell started intensifying:

The large FED and MFA bullseye imply the updraft is intensifying on this storm. This proved to be a useful proxy because this was the result 8 minutes later:

This suite of products has a lot of utility for pulse severe events and DSS on-site weather events. -Atlanta Braves

Precipitable Water Comparisons

The Blended TPW product (top left) shows promise in creating an all-observations precipitable water product in AWIPS. The polar-orbiter PW data in cloudy areas produces artificial gradients and inaccurate values compared to modeled fields (GFS top right and HRRR bottom left), but its attempt to generate an all-observational PW product is successful. I am unsure of how to suggest improvements in the cloudy areas but would encourage these model-free fields continue to be developed.

The AllSky PW product (bottom right) looks really good. The inclusion of GFS data in cloudy areas is a neat idea and the partly cloudy areas seem to be well-computed. This is a tool I will definitely use for situational awareness. -Atlanta Braves

AllSky Overview – Big Help

The AllSky products seem to do a really good job of providing timely and relevant environmental data with higher spatiotemporal resolution than other means. Representative model soundings and the SPC Mesoanalysis page are nice tools, but the AllSky products add a helpful third point to interrogate environmental evolution. Perhaps the most helpful application is tracking of fronts and boundaries. As the dry line advances it is easy to see its eastward extent. In addition, the extent of the warm air is very clear as it pushes into Missouri.

This 4 panel display with cloud type in the lower right is a useful tool for identifying potential causes for inconsistent data from pixel to pixel. I like these products and look forward to their operational implementation at the end of this month! -Atlanta Braves

ProbTor during Tornado Warning

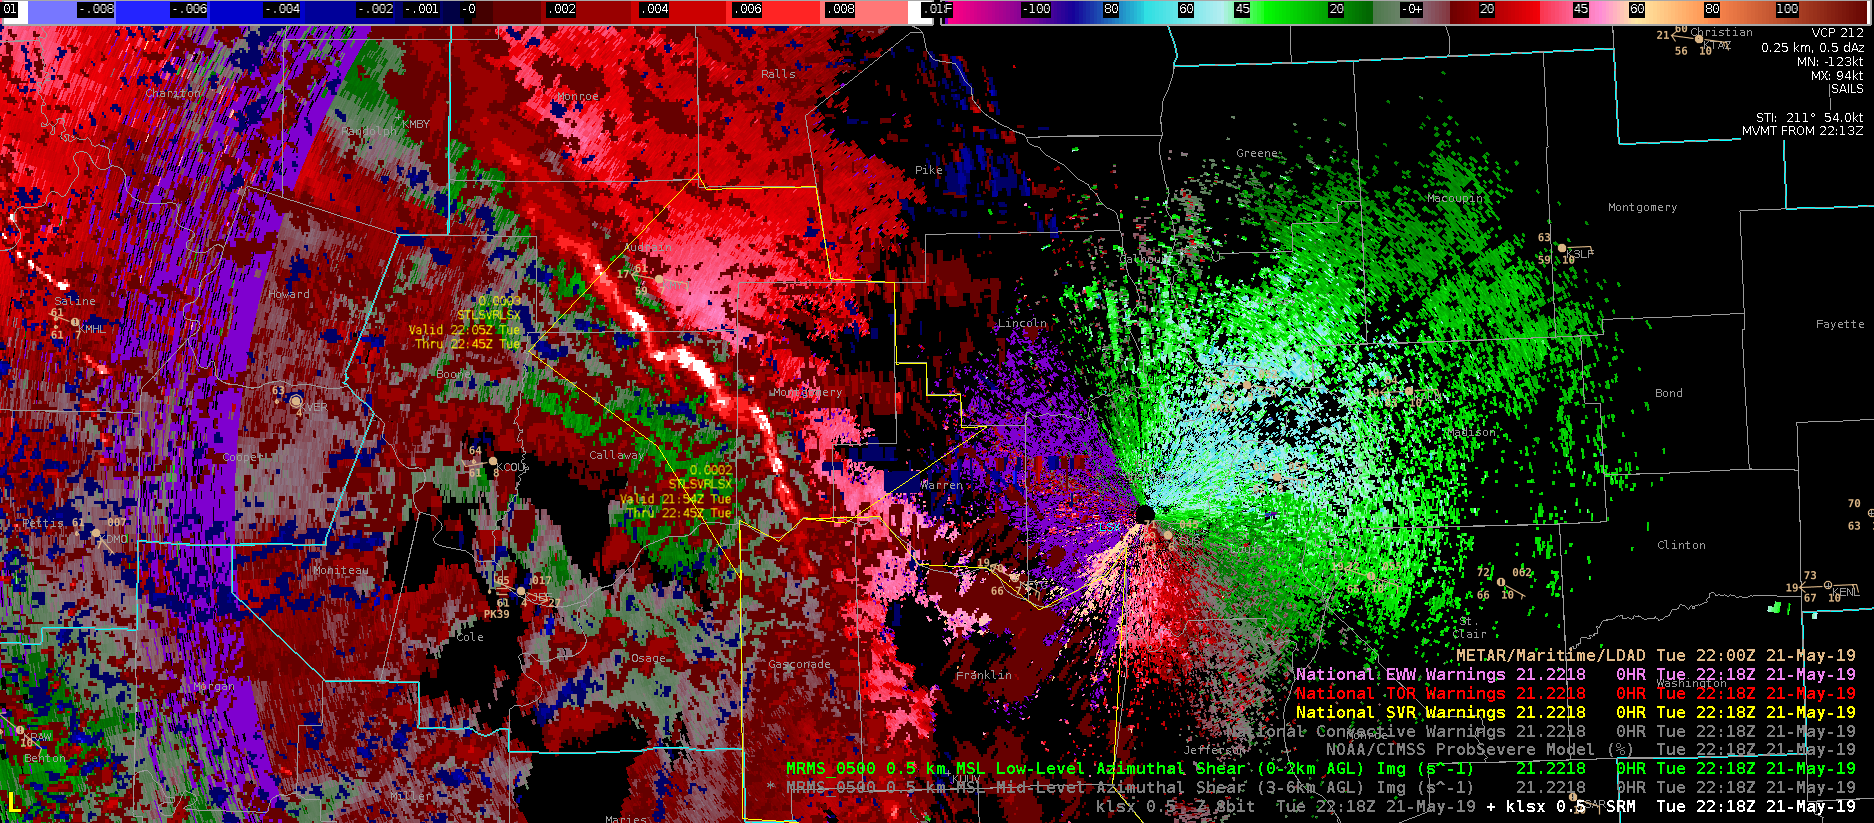
The NWS office in Little Rock started issuing tornado warnings on storms along the line so I pulled up the ProbTor product to see how it performed. For the storm near Knoxville, I can’t figure out what’s going on but I’ll attempt to document it here. For each time, I plot CPTI top left, LZK SRM top right, low-level AzShear bottom left, and spectrum width bottom right.

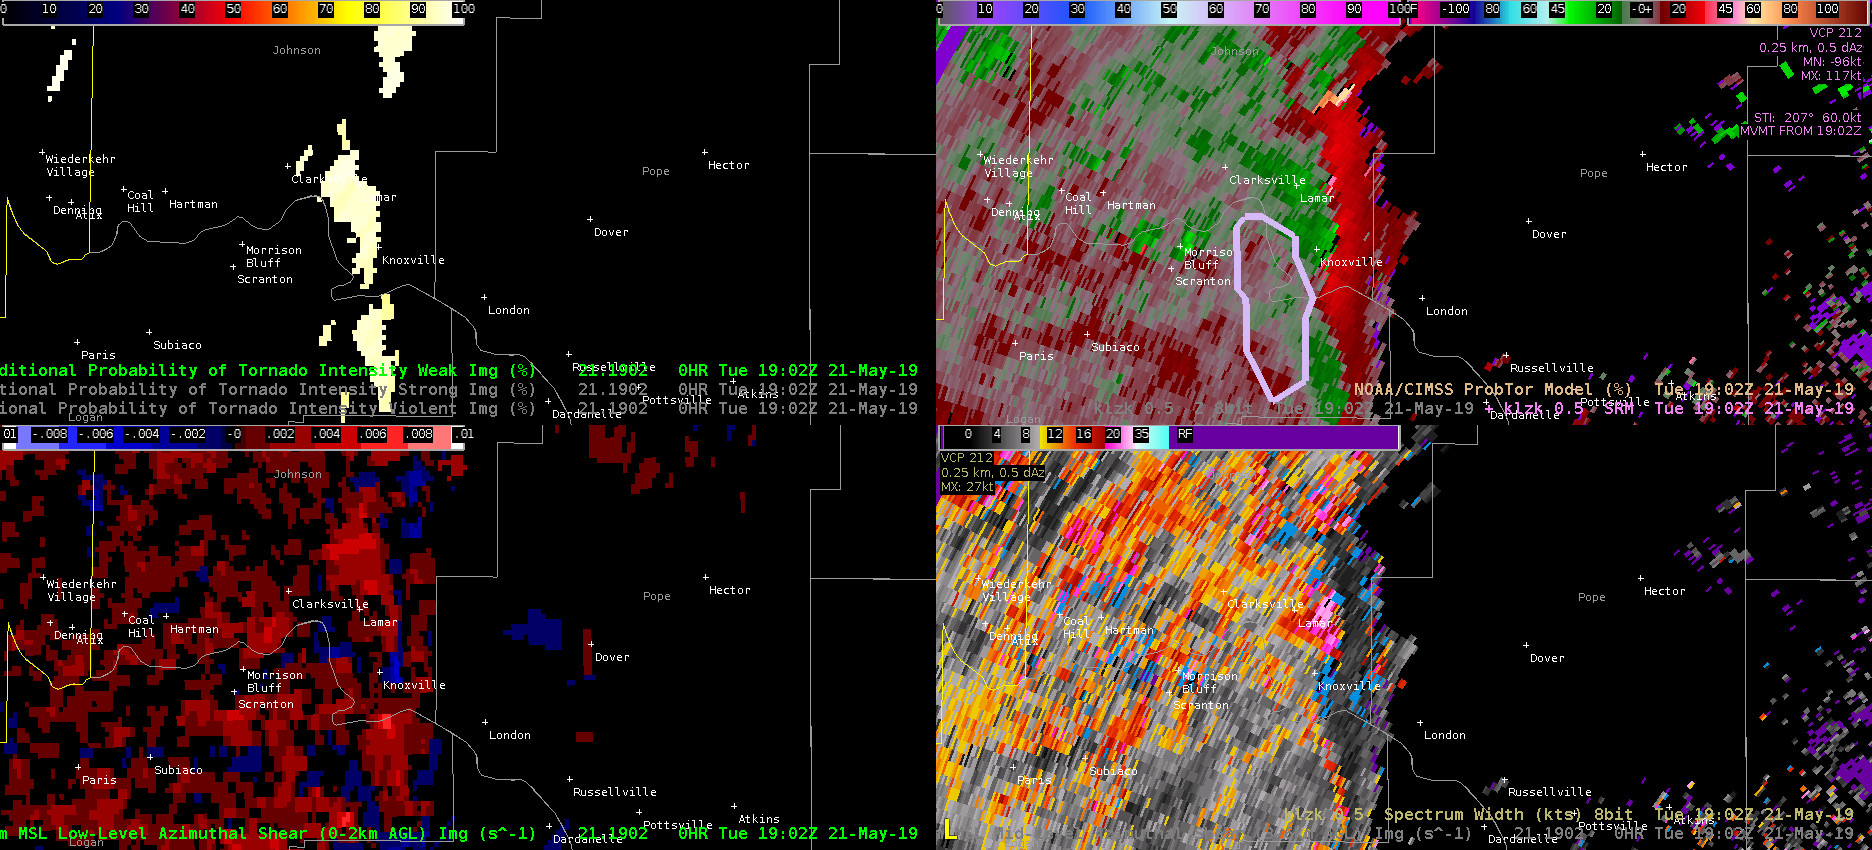
At 1902, the algorithm has a 60% ProbTor based on high LLAzShear (0.021 /s). I don’t see any high values on the low-level AzShear product, but perhaps I’m missing something.

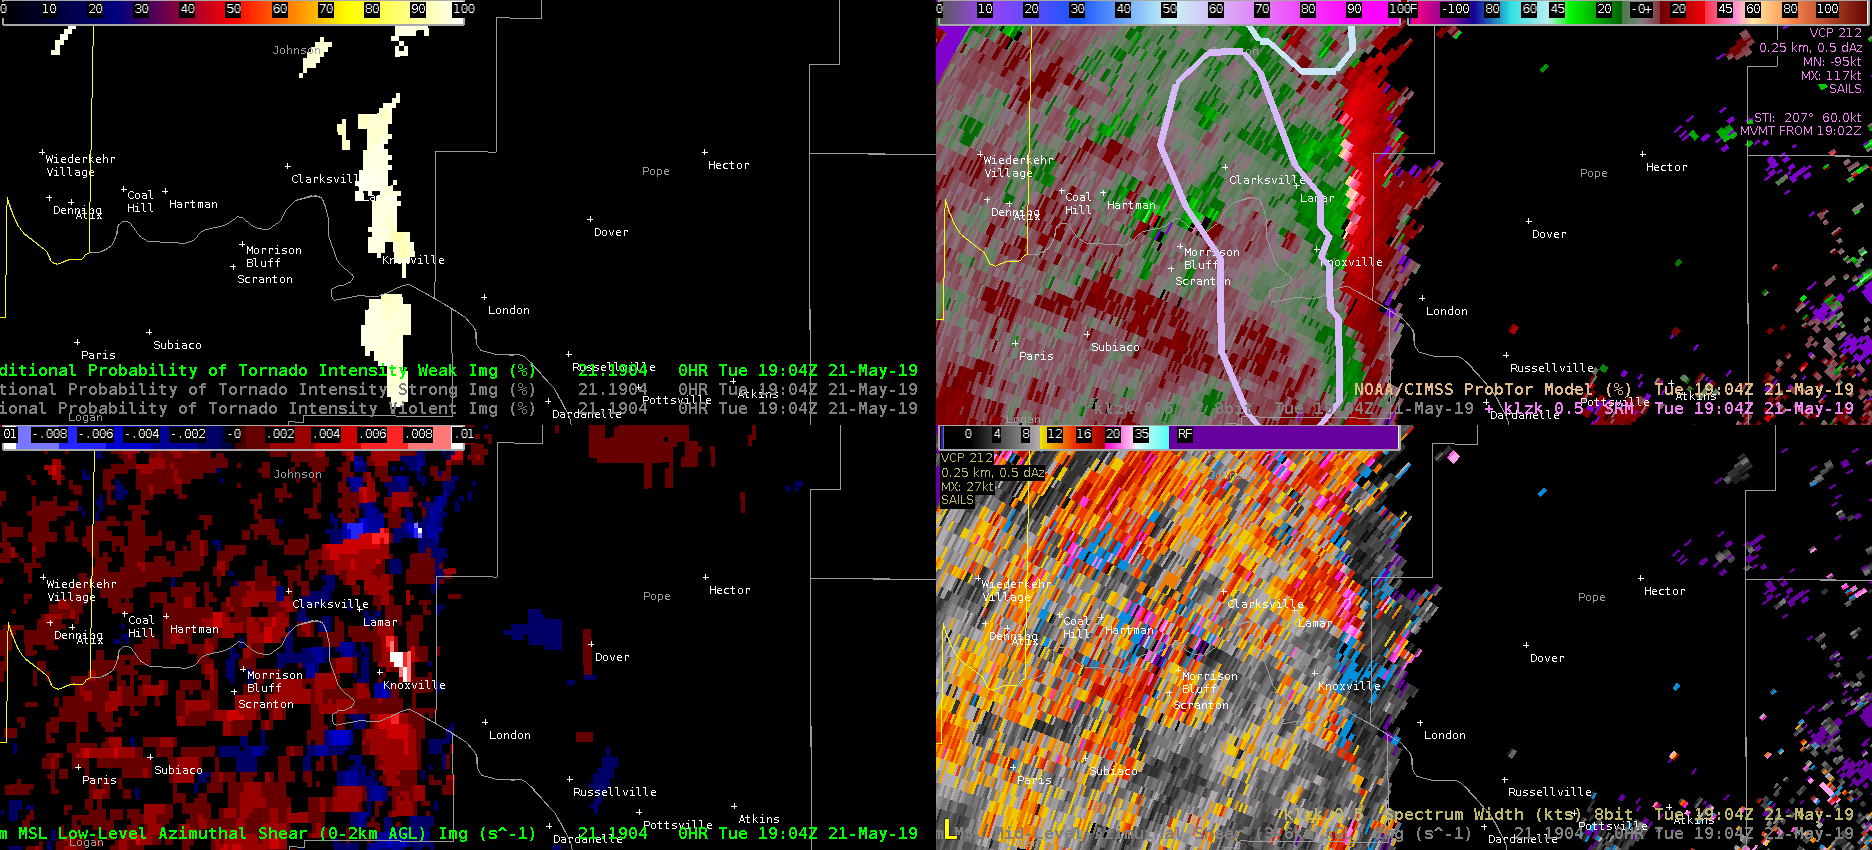
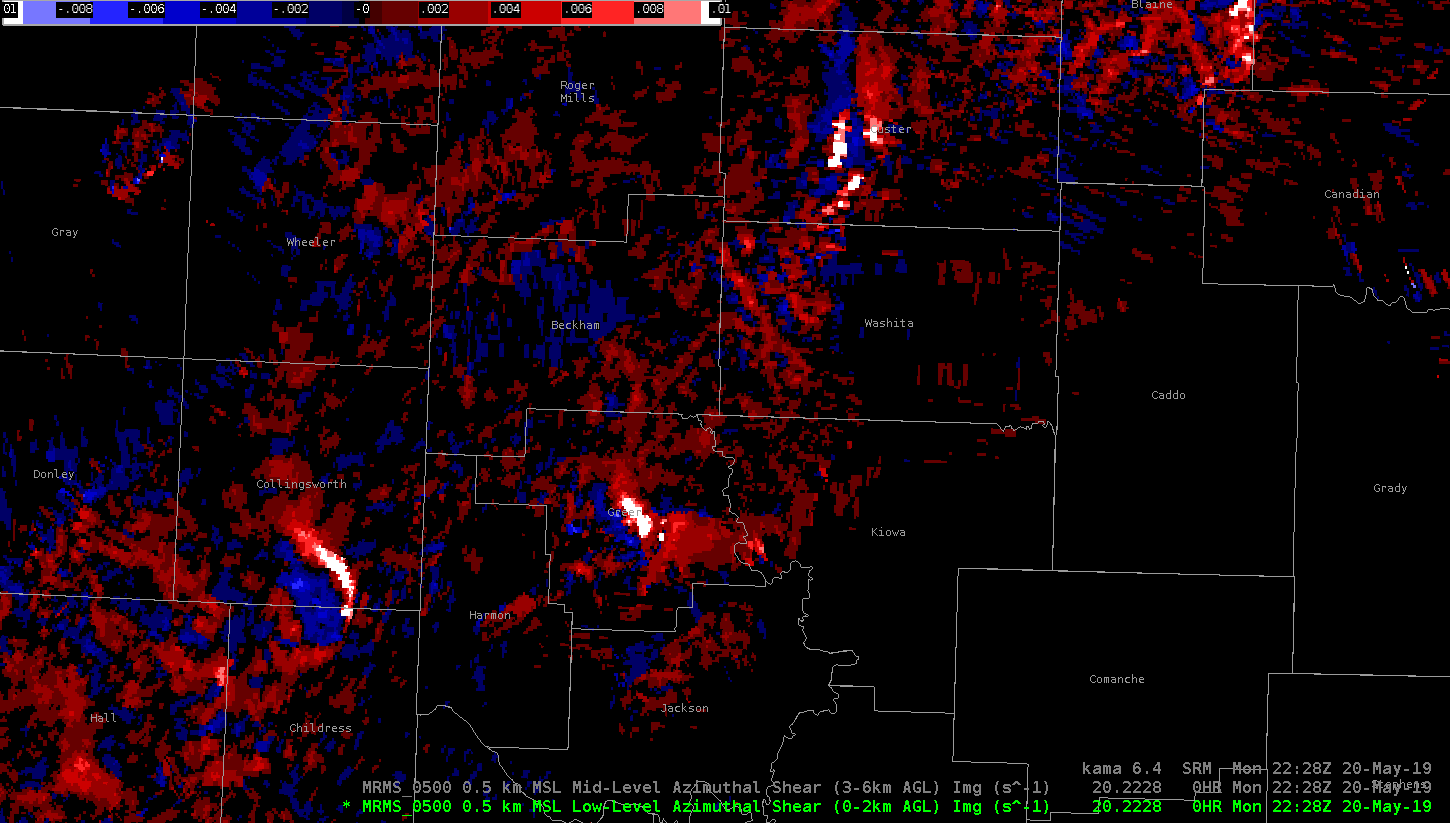
At 1904, a bullseye of high LLAzShear pops up just east of Knoxville. ProbTor is still 60%, which now makes sense to me. This identified shear region is not in the right place for a tornado and is just convergence along the line, but the ProbTor uses what it has and seems to generate an understandable ProbTor.

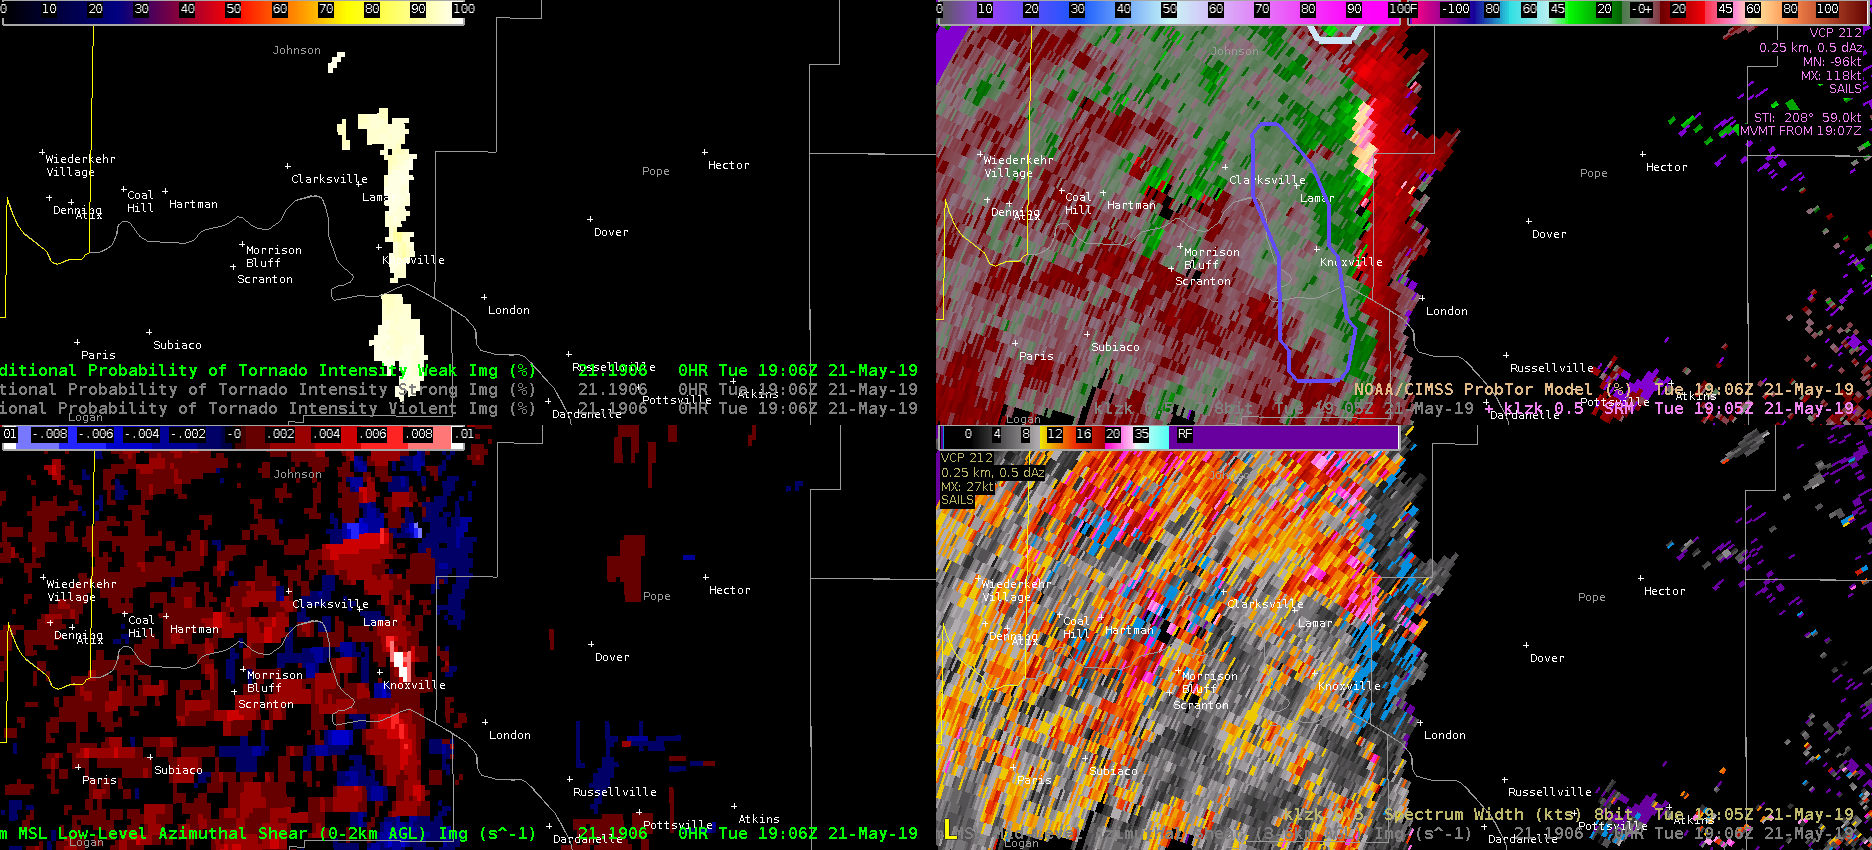
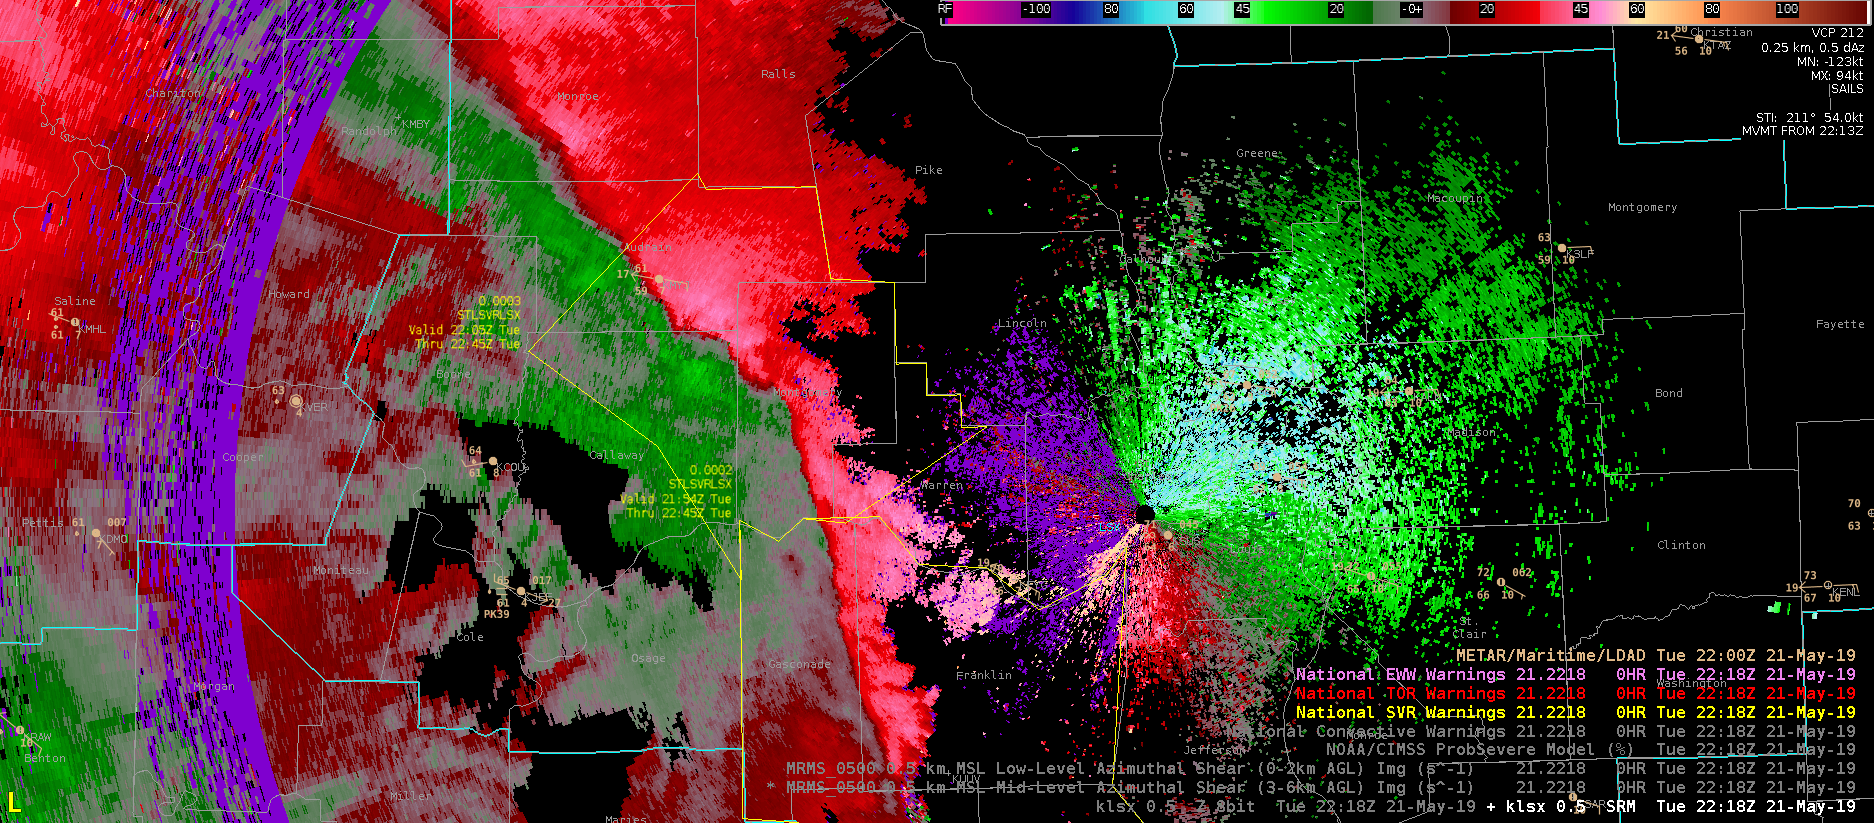
At 1906 the LLAzShear bullseye east of Knoxville persists,  but now the ProbTor drops to 19% with a LLAzShear max value of (0.009 /s). I still sample 0.020 /s in the bullseye. Spectrum width is not horrible (~7 kts) in the area of the AzShear bullseye. The AzShear detection is obviously misleading for a tornado, but the ProbTor product does not seem to be performing as we’d expect it.

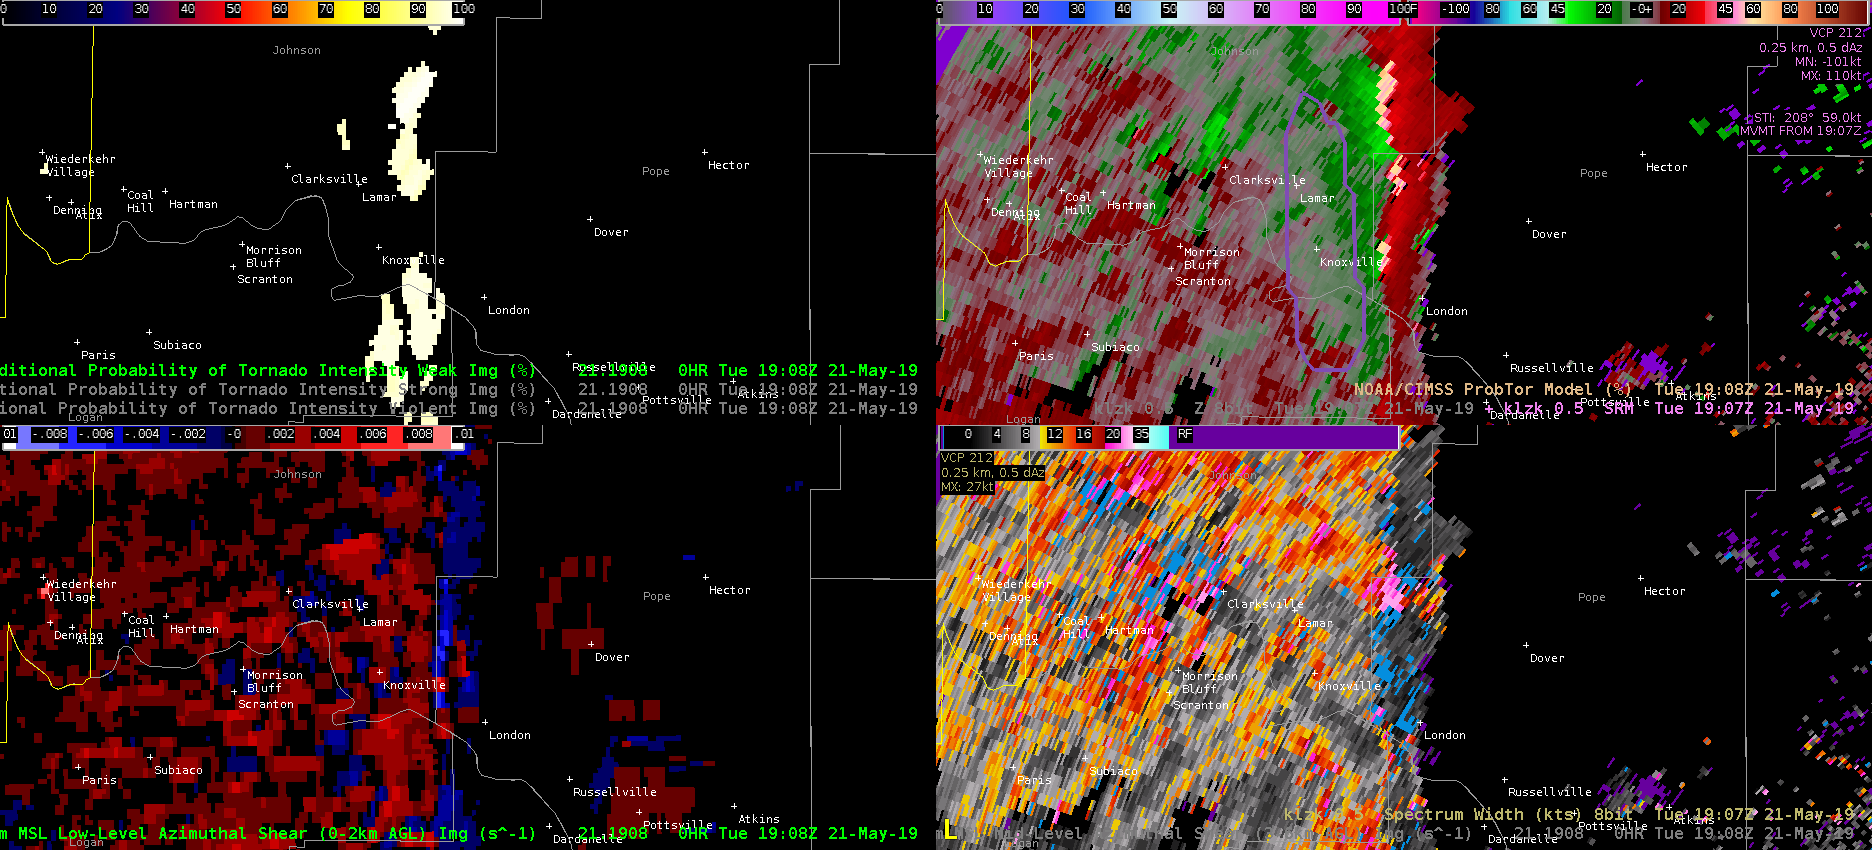
At 1908 the bullseye in AzShear goes away and the ProbTor drops even further to 6% (as expected). The persistence of the bullseye in AzShear with an associated significant drop in ProbTor is perplexing for this case! -Atlanta Braves.


An artifact in AllSky Products…

I was taking a first look at AllSky products this afternoon and put together a four-panel procedure. I expected to see some noise/sharp gradients in the data because differing pixel population methodology, but viewing a loop revealed an interesting artifact:

There appears to be an artifact in northern Arkansas that looks a little bit like a dinosaur head. This artifact is visible in parcel Lifted Index (to 500 mb), all PWAT products, and CAPE, but not in Total Totals, K Index, or Showalter Index fields. The artifact does not appear to be dependent on the Cloud Type field. Perhaps this artifact is associated with terrain in Arkansas but warrants further investigation. -Atlanta Braves

AzShear – Great Additional Tool for Tornado Warning Issuance

The best storm of the day so far produced a tornado with a tornado debris signature. The AzShear signature was textbook with a concentrated persistent bullseye over the couplet (center of image below):

This AzShear product is a great tool to increase confidence in the presence of low-level rotation. It should be used with caution, however, owing to the risk of misleading signatures. The signal north of the Greer storm is a result of convergence and/or bad velocity data: 
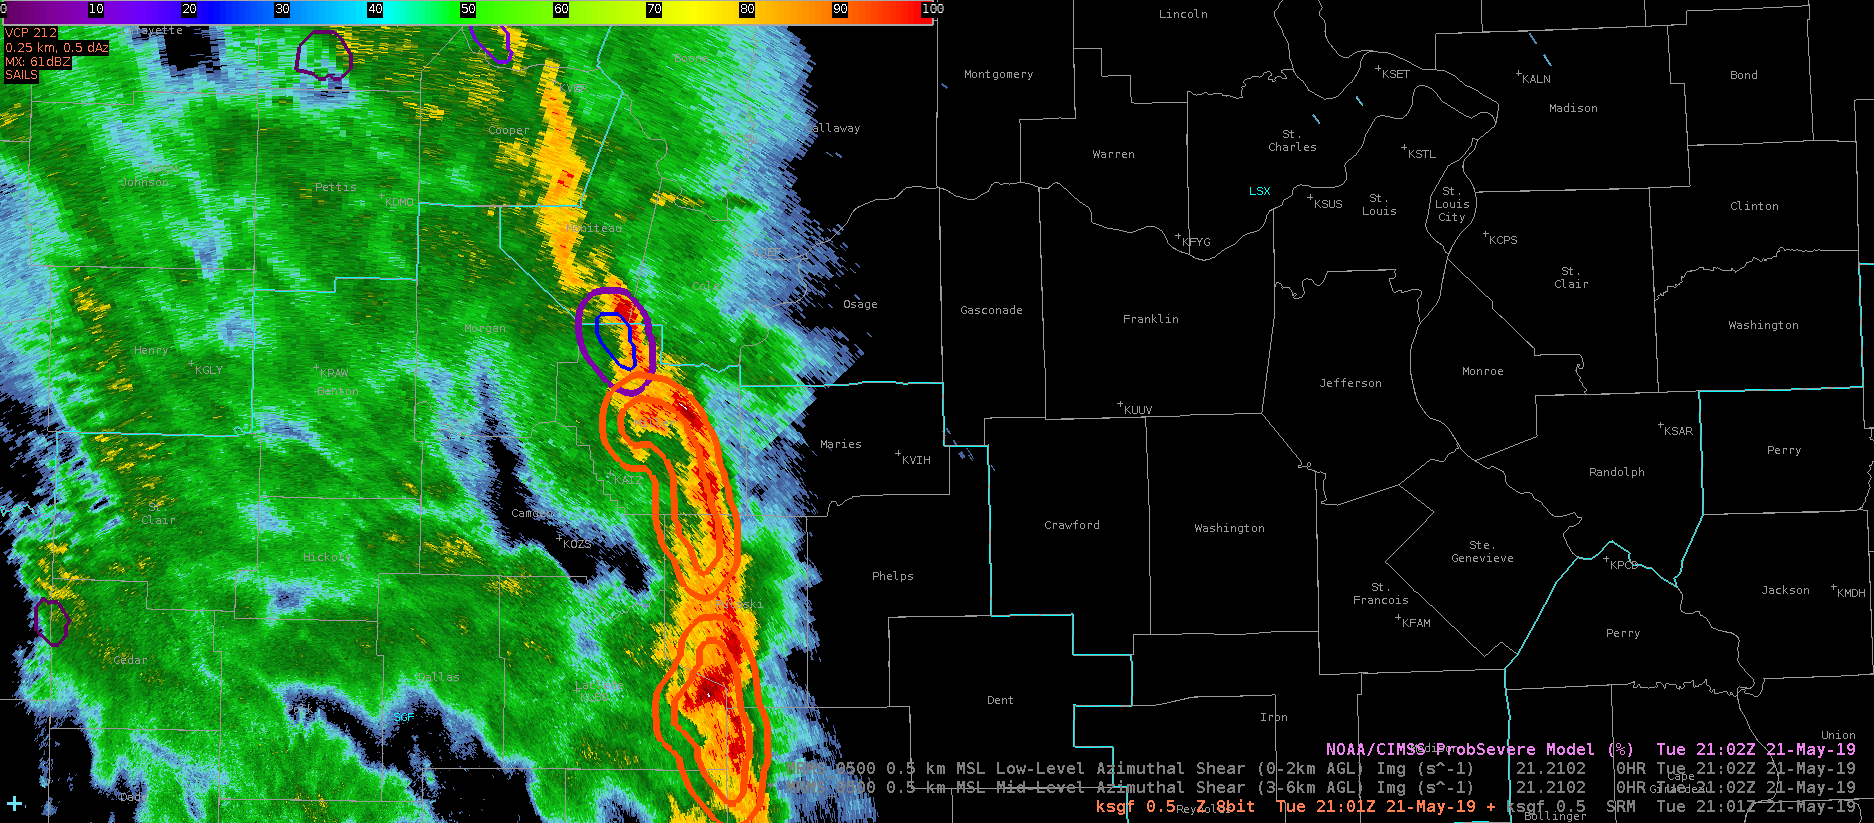
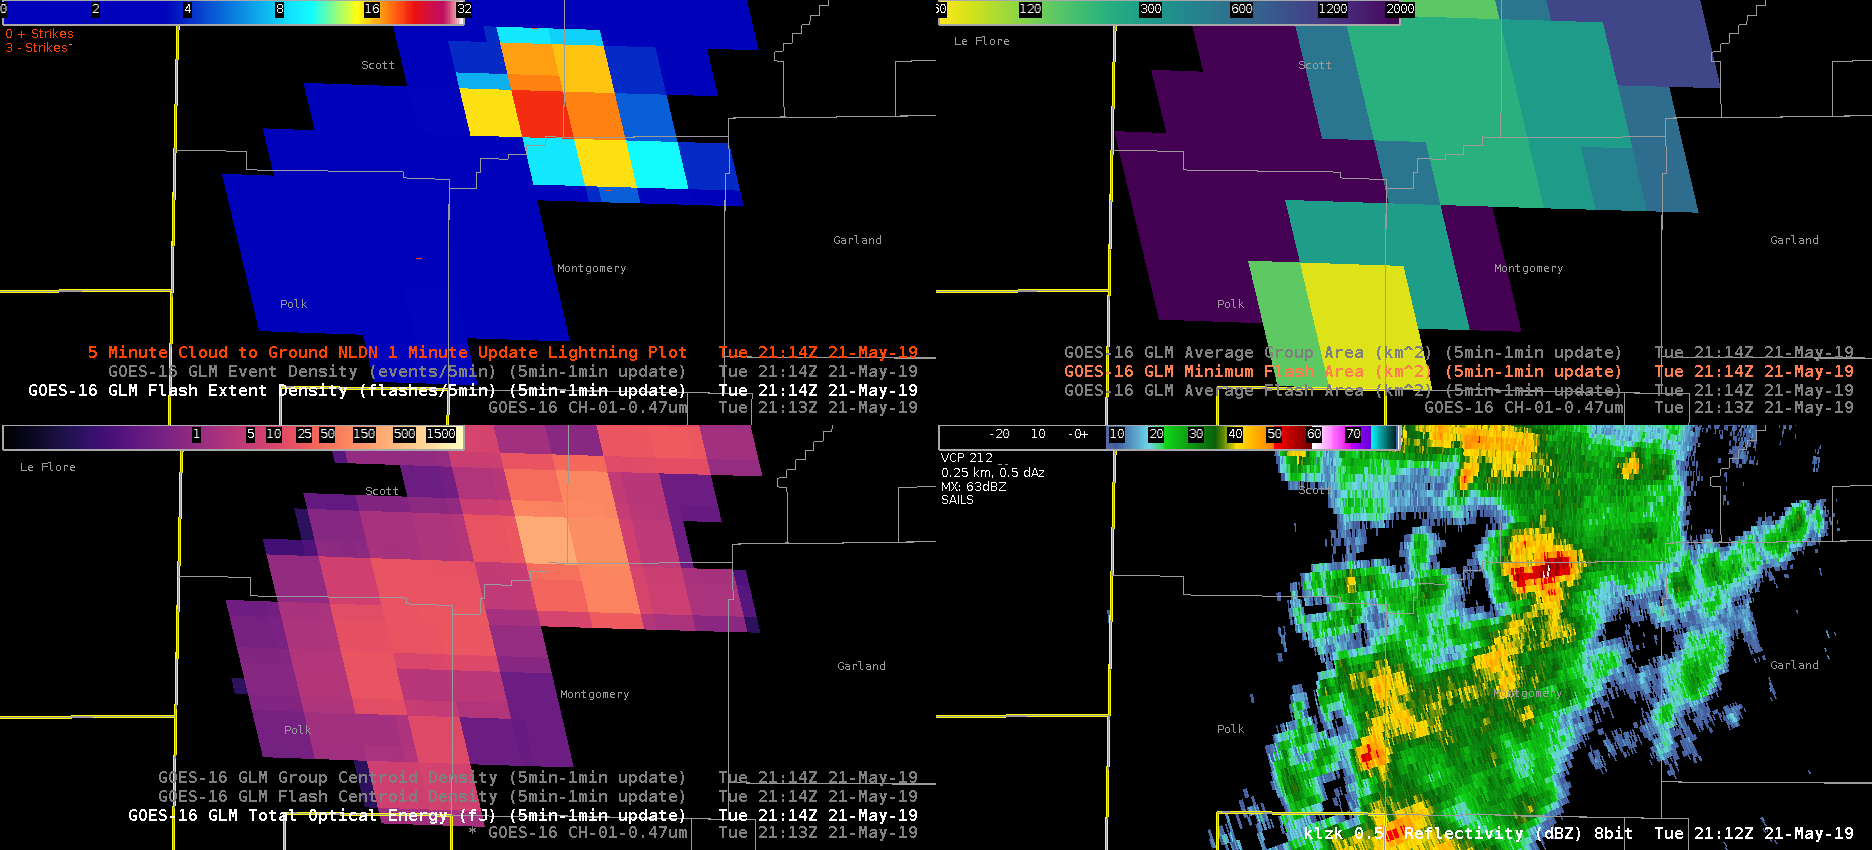
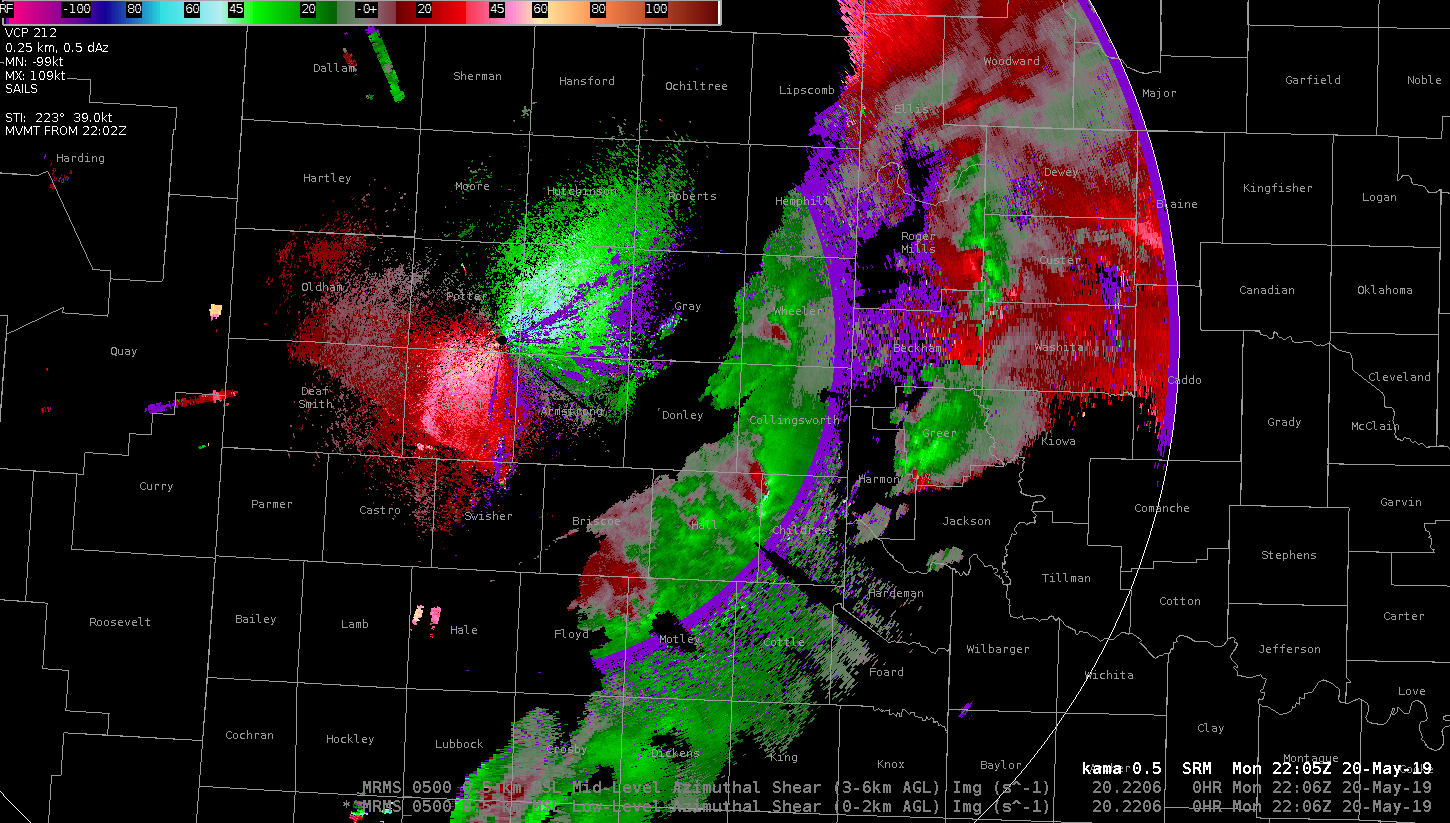
The reflectivity structure is more of a bow echo and the AzShear should be used with caution in identifying velocity couplets potentially associated with tornadoes. -Atlanta Braves

CPTI Increasing in Concert with an Observed Tornado

A tornado was observed via news footage near Mangum, OK.  The formation of this tornado was associated with an increase in CPTI for strong tornadoes to 46%:

The CPTI for violent tornadoes also increased to near 6% (not shown).

The ProbTor on this storm increased markedly between 2140-2155 UTC:

This increase was driven by an increase in AzShear:

Ron Dayne