Evolution of ProbSevere

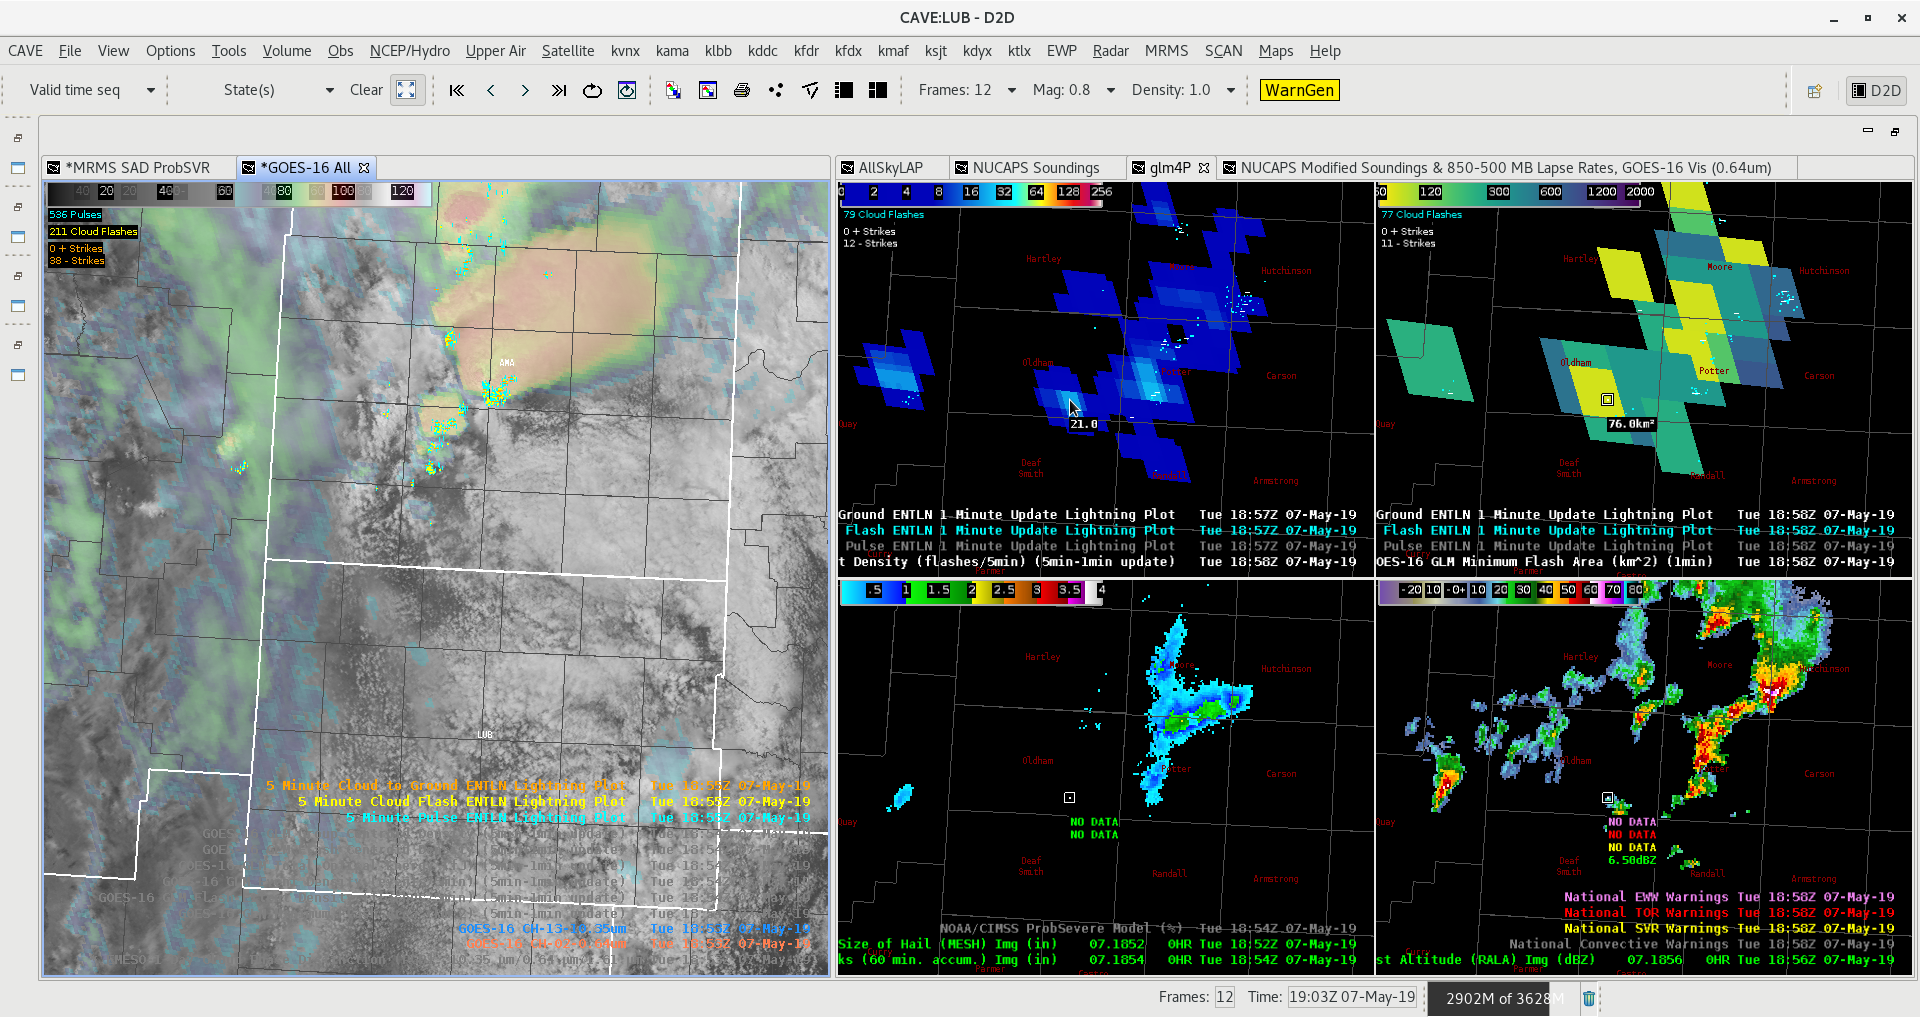
I am finding the all hazards version of ProbSevere to be extremely useful as a situational awareness and decision making tool. Here is a short animation of the evolution of ProbSevere thresholds for a storm near Kermit, TX.

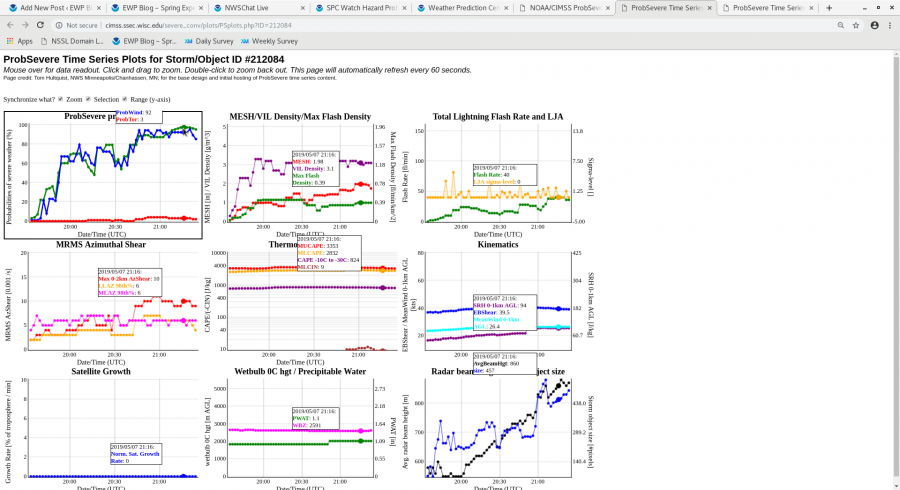
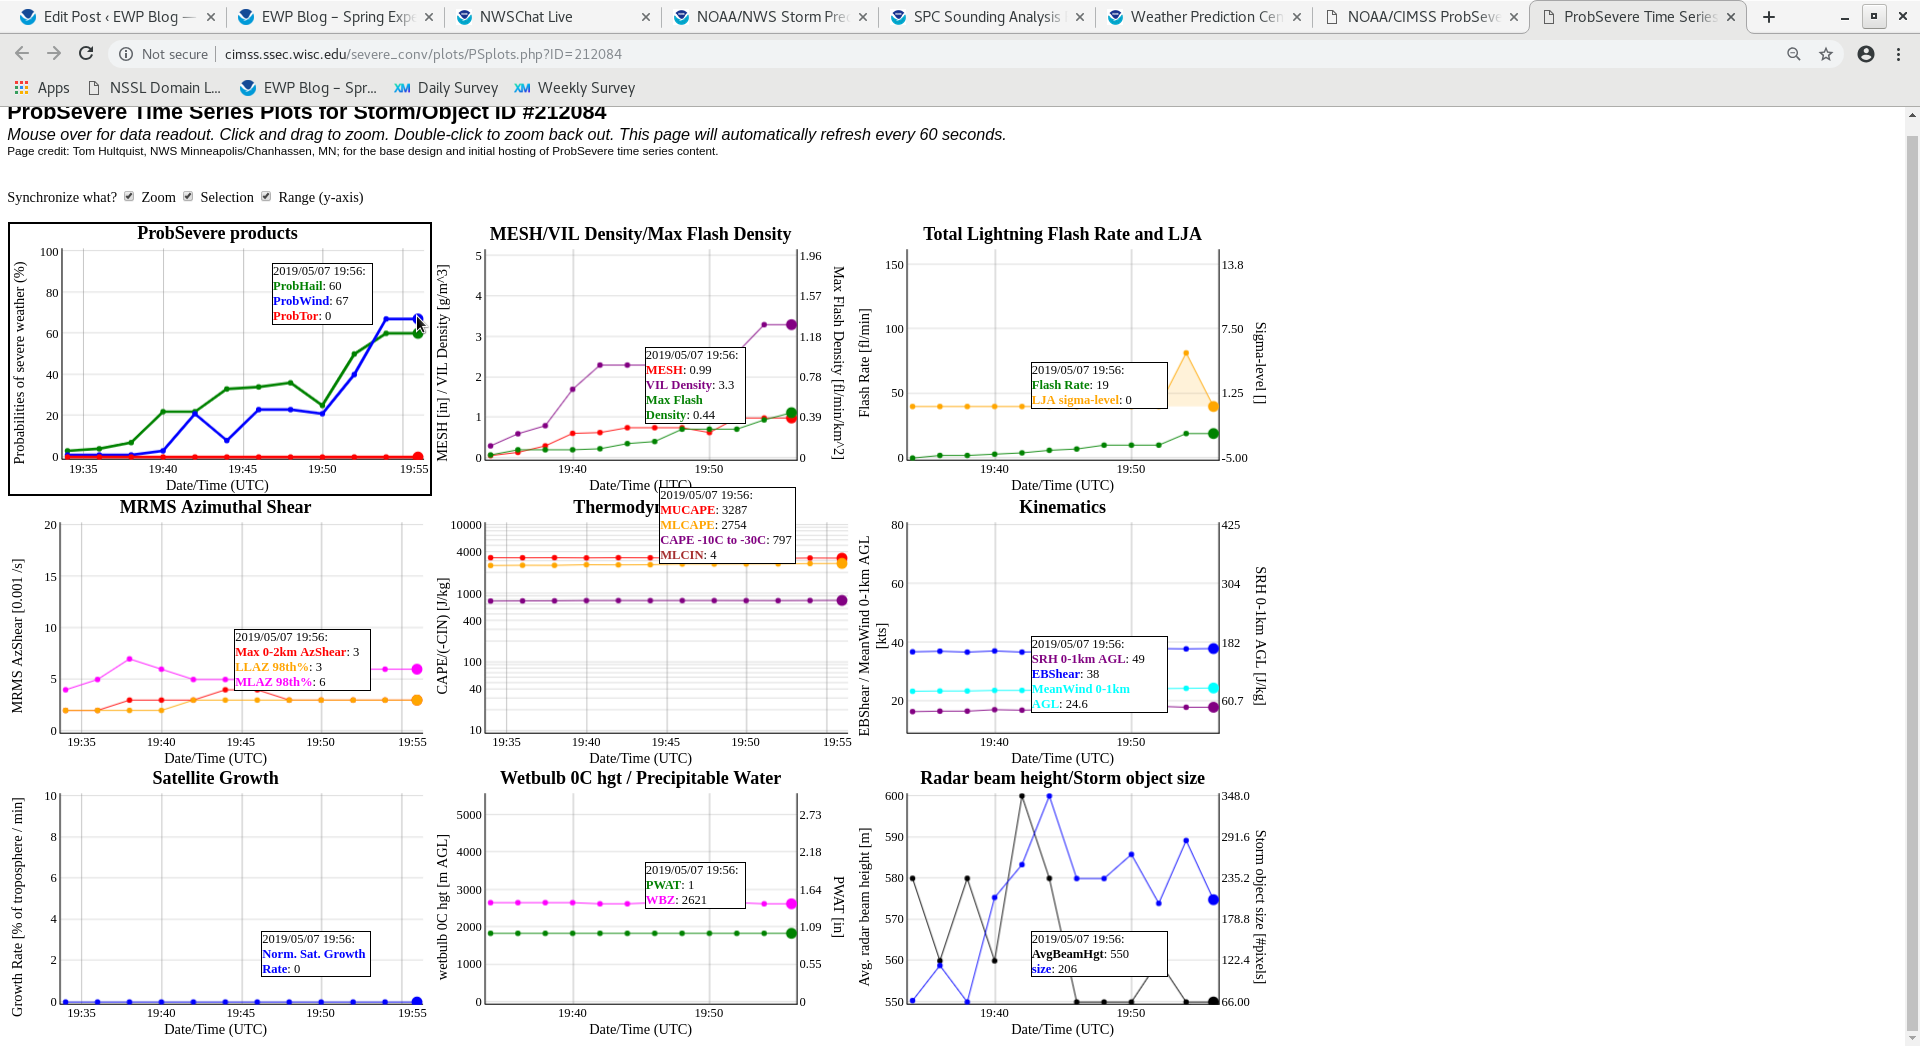
Below is a timeseries for the same storm…

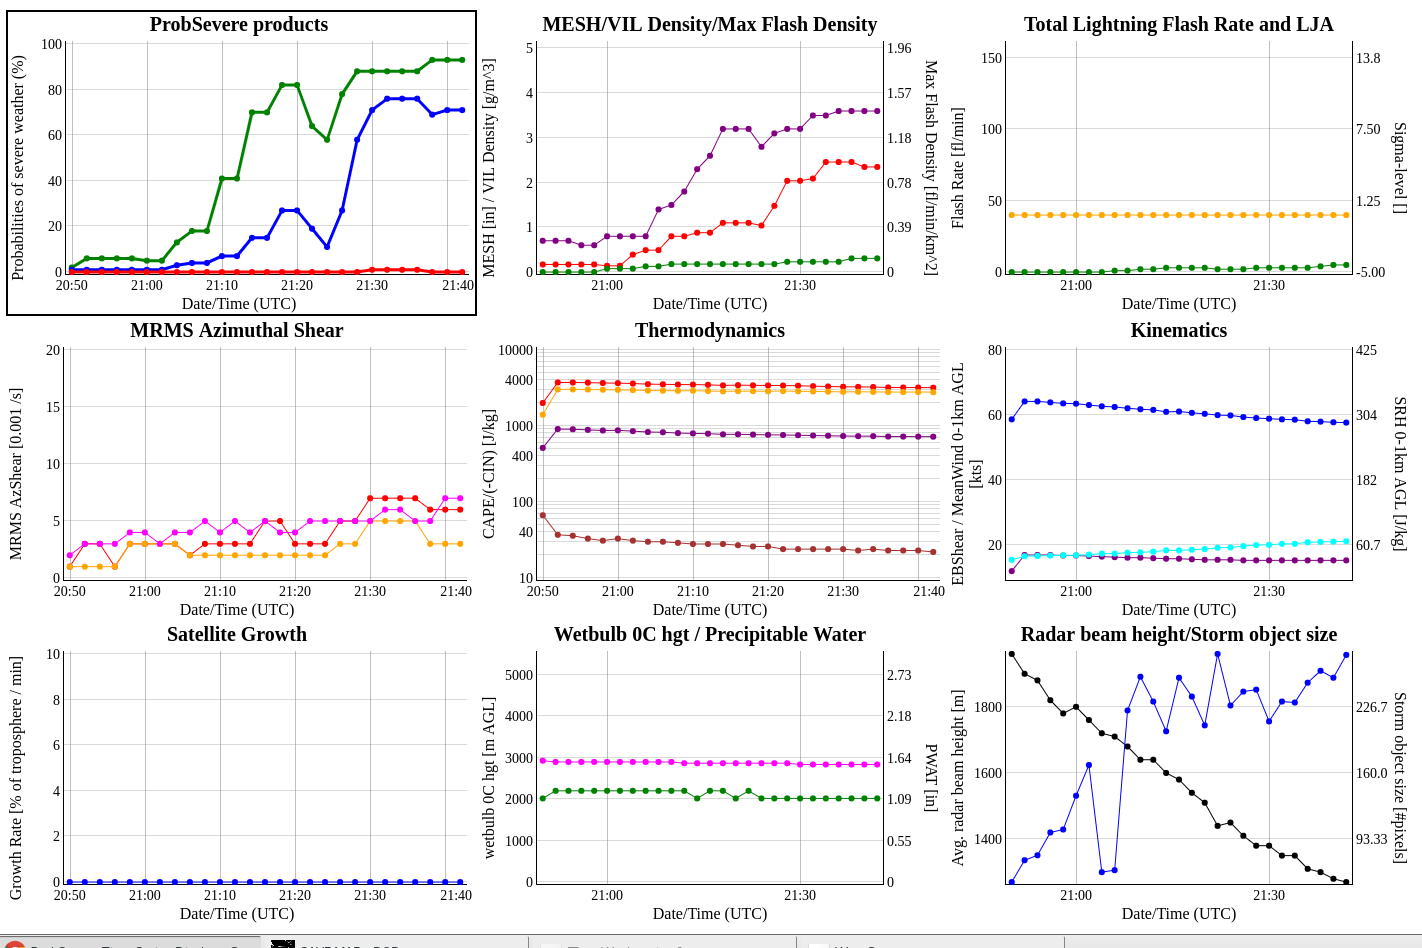
A loop of the ProbSevere thresholds provides a quick look at the potential hazards, but it becomes even more powerful when you combine it with the timeseries.

Web ProbSevere Table Cutoff

A small cosmetic issue, but I noticed that the Table Display from ProbSevere gets cutoff on the top row, and covers the axis information on the last row.  Also had some difficulty zooming out at times, but may have fixed the issue but unselecting option to synchronize ranges.

#ProtectAndDissipate

MDAs & Lubbock CWA Supercell

A strong supercell in Lubbock’s CWA is the first example I have witnessed of the NMDA (bottome left) performing better than the legacy MDA (top left). The DMDA (top right) followed the meso at times, but the NMDA seemed to perform the best in this particular situation. The legacy MDA failed to pick up on a meso at all.

Used GLM to Issue SVR

I’d been watching a multicellular cluster that was trailing a leading supercell to the north of Amarillo. Had been waiting on issuing due to ProbSevere and Mesh levels, but GLM FED increased and reflectivity / VIL /core height all responded so I issued a warning at about 2040Z

ProbSevere Progression with intensifying storm

I like seeing the progression of the storm on the ProbSevere page, showing the trends of developing convection. You can see how the increases of ProbHail and ProbWind parallel certain parameters like MESH, VIL, and Flash Rate parameters.  It’s also interesting to see what’s not being utilized or loaded into the page such as Sat Growth Rate.

With some MRMS data being loaded into the ProbSVR model, one possible addition to the parameters could be Vertically Integrated Ice (VII) vs VIL. Have found in operations to be a very good indication for strong updrafts above the FZL. Hail and Wet Downbursts have been correlated with very high values of VII (above 25-50 kg*m^-2).

#ProtectAndDissipate

Dryline Progression with AllSkyLAP

Noticed a glitchy progression in the AllSkyLAPs 900mb PWATs. Believe this might be from an updating GFS guidance, but this also occurred at a time when the areas west of the LUB CWA were transitioning from about half Cloudy, half GFS to mostly GFS. However, the updated location of the dryline was a closer approximation of the location of the dryline at the given time.

#ProtectAndDissipate

GOES All Sky LAP TPW and CIRA Merged TPW Cloud Mask Differences

At 22 UTC on 6 May 2019, the All Sky LAP and CIRA Merged TPW Data type products show differences in the cloud mask.  A shallow Cu field over NC / SC is indicated in GOES visible imagery,.  The data type masks of the two products (blue = clear; yellow / gray = clouds) show some clouds in the All Sky LAP mask, while the CIRA Merged TPW mask does not have these Cu detected.  This is likely due to the lower resolution (~ 15 km) of the GOES-16 TPW data used in Merged TPW versus the All Sky LAP resolution.

GOES-R TPW has a nominal resolution of 10 km.

JohnF


Early Detection of Convection w/GLM

Impressed by the early convective detection by GLM in this case. The image below was in real time and you can see the GLM Minimum Flash Area and Flash Extent Density is already lighting up in Oldham County in the AMA CWA. However, the 1-minute MESO GOES-16 data barely had cooling cloud tops being detected and there was no detection of precip at that location on MRMS yet (actual first time of detection was 2-minutes sooner than picture below where MRMS has no detection of radar echoes).

#ProtectAndDissipate