Alignment is Everything

Another advantage of single radar AzShear – orientation to the radar.

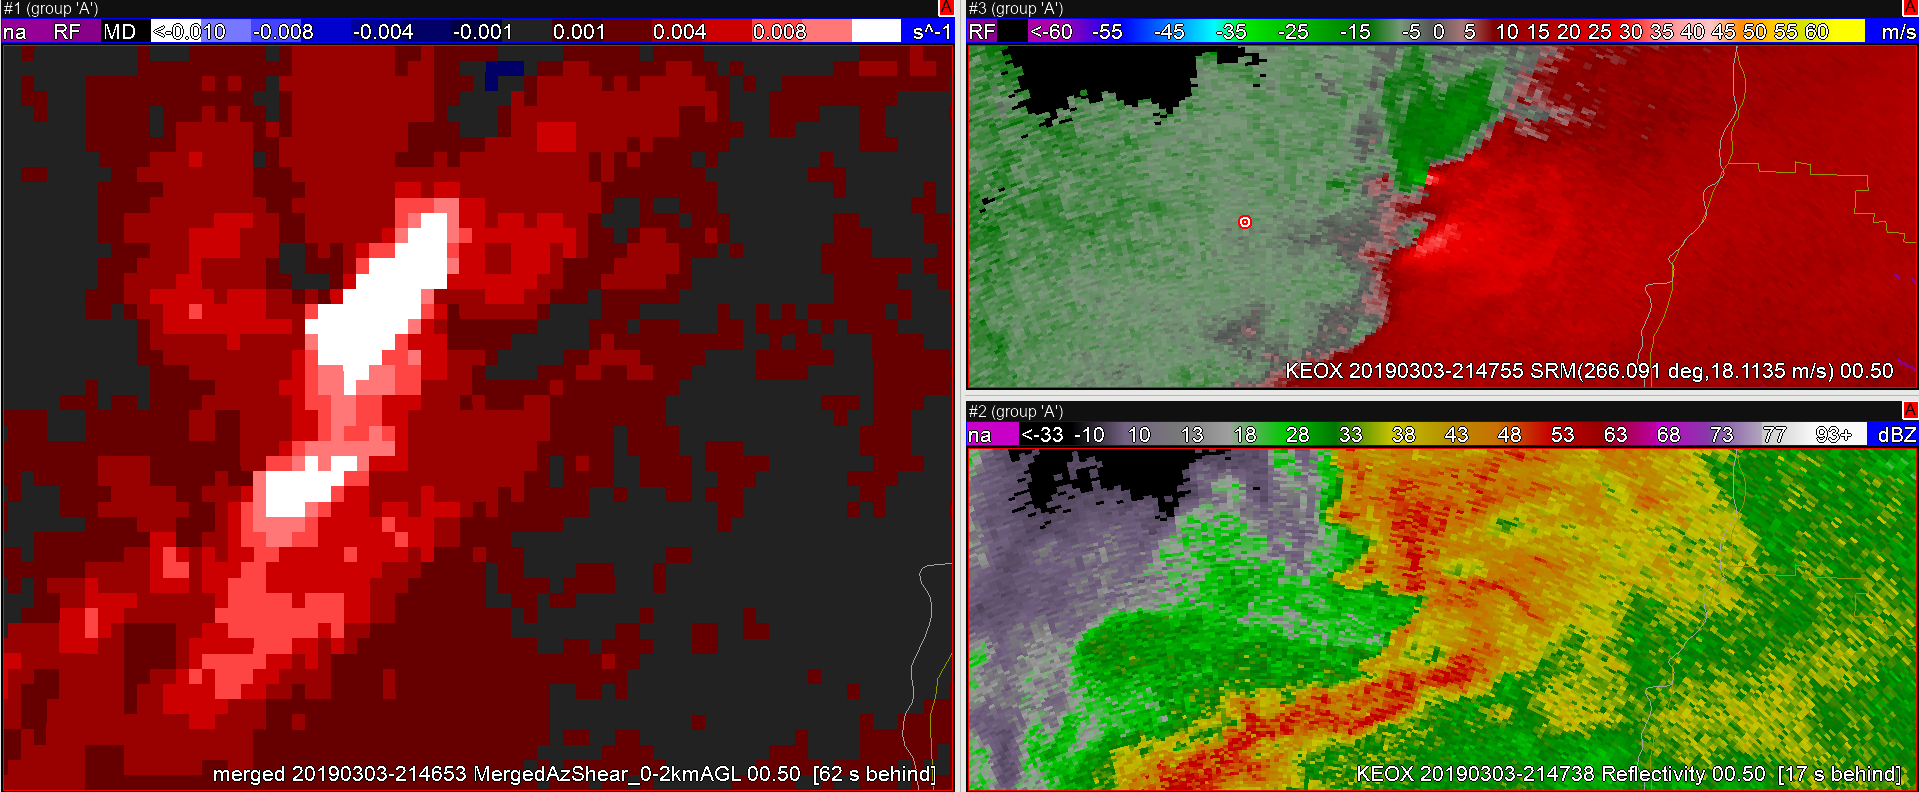
Here is an ongoing tornado (according to the report shapefile from this event) as seen in the merged 0-2km AzShear product:

Yeah, likely TVS in the velocity data from KEOX (top right pane), Reflectivity is…messy…, and Merged AzShear shows an area of white (when sampled showed 0.023 s-1 values) associated with the TVS.  That is pretty strong!

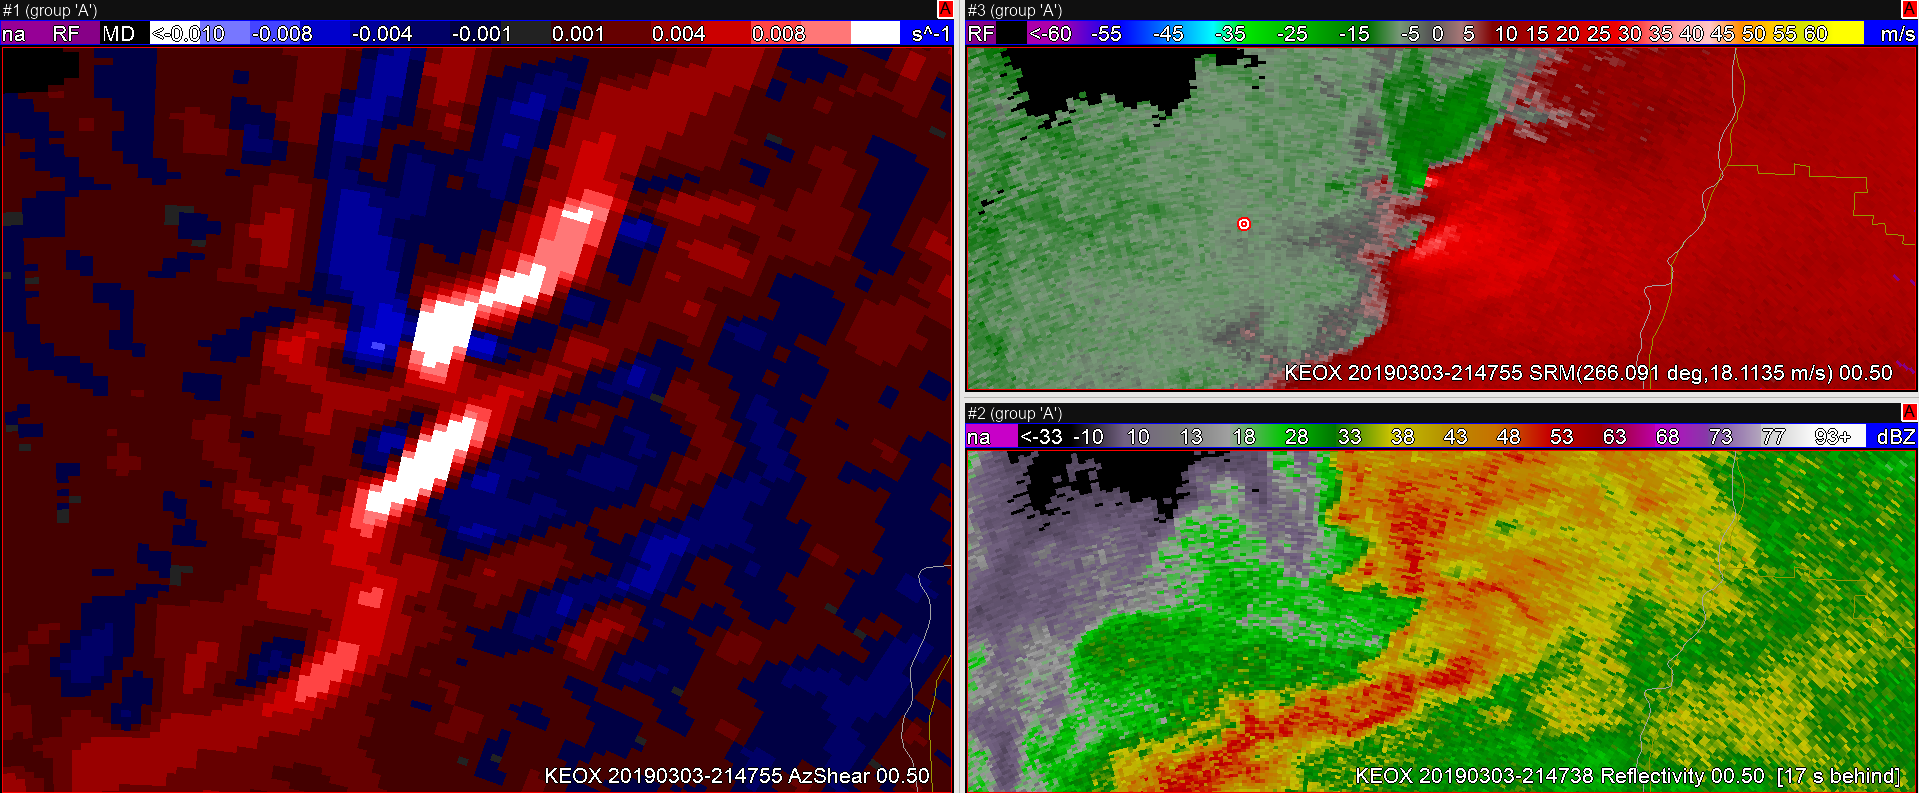
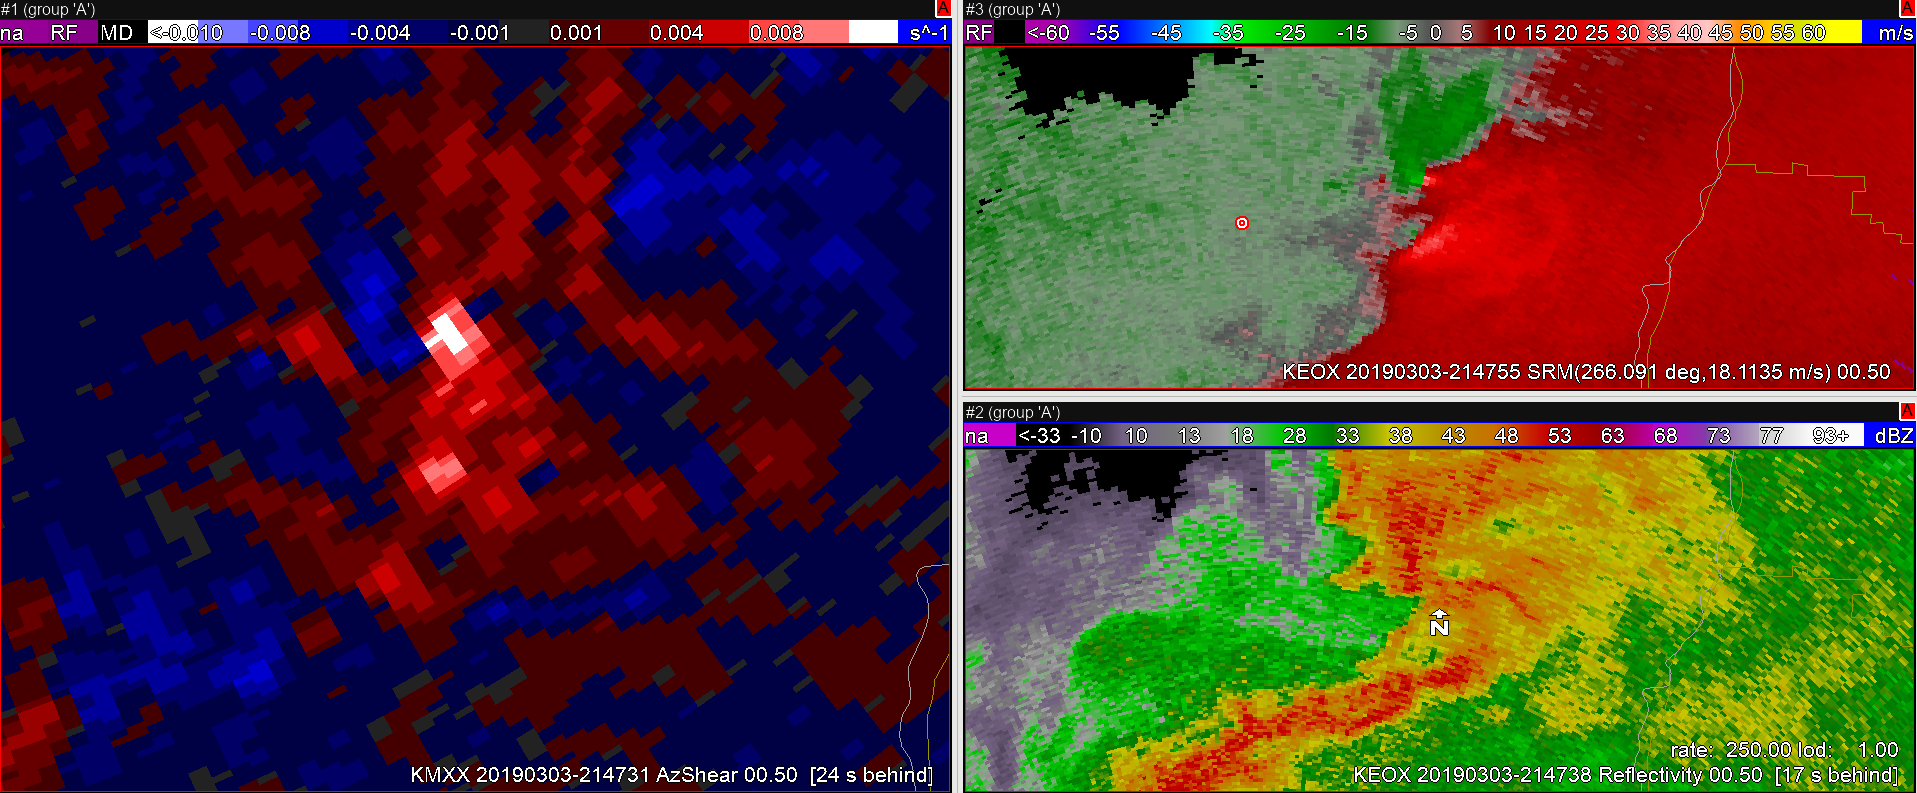
However, the Merged product loses some key information that could come in handy in figuring out details of the vortex; how is this oriented with respect to the radar?  This is where the single-radar AzShear comes in handy:

Each single-radar (KEOX top image, KMXX bottom image) now shows much better information on how the area of shear is oriented with respect to the radar.  This becomes essential in situations where there are multiple areas of strong AzShear in and around a possible tornado; things like a new circulation in the flanking line that could eventually merge with the original tornado, mesocyclone occlusion with new development, weakening tornado rotating back into the core of the storm, anticyclonic tornado development, and so on.  Many of these features may be lost in the merged products but will stand out to the discerning eye on the single-radar products.  Add in the fact that these update scan-by-scan and during quickly evolving features in critical periods of the life cycle of small-scale vorticies, and single-radar becomes pretty valuable.

Have I mentioned yet that I would like this in my office? Now?  Please…

-Dusty

Single vs. Merged; +/- For Each

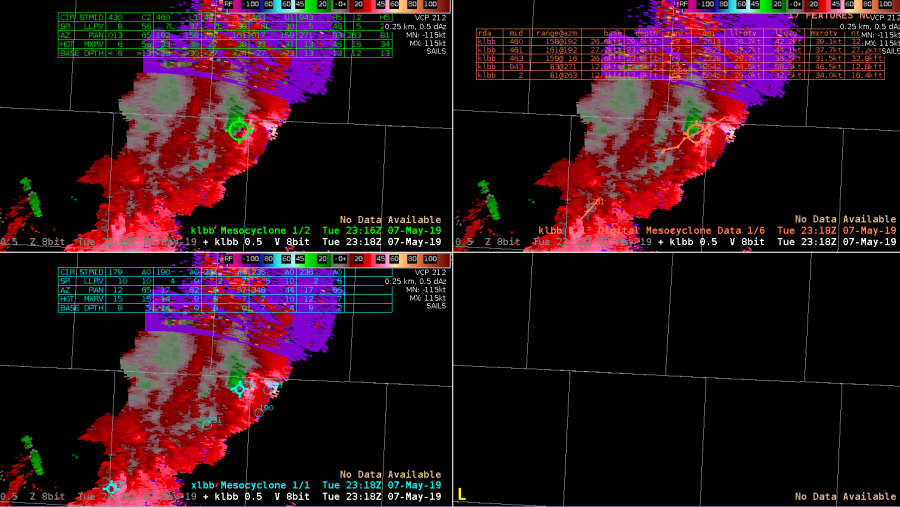
Almost an hour into this replay of an archived case and some thoughts on the Single Site AzShear using this image as an example.

I can count at least 8 areas that AzShear shows potential areas of rotation that need a closer look.  Advantage.  The rapid update every volume scan means there isn’t a wait for the 2-minute Merged AzShear products to arrive.  Advantage.  However, there is a lot of noise, especially along the leading edge of the gust front/line of storms to the southwest of the KMMX radar site.  Not shown is the single-radar AzShear from KEOX which is not as noisy but is also looking at the mid-level of the storms.  Disadvantage.  The strength of the AzShear signatures depends on which radar you are looking from and the orientation to the beam.  Disadvantage.  Features are range-dependent so if you are looking for a low-level feature from a distant radar without a radar closer to the area of interest; Disadvantage.

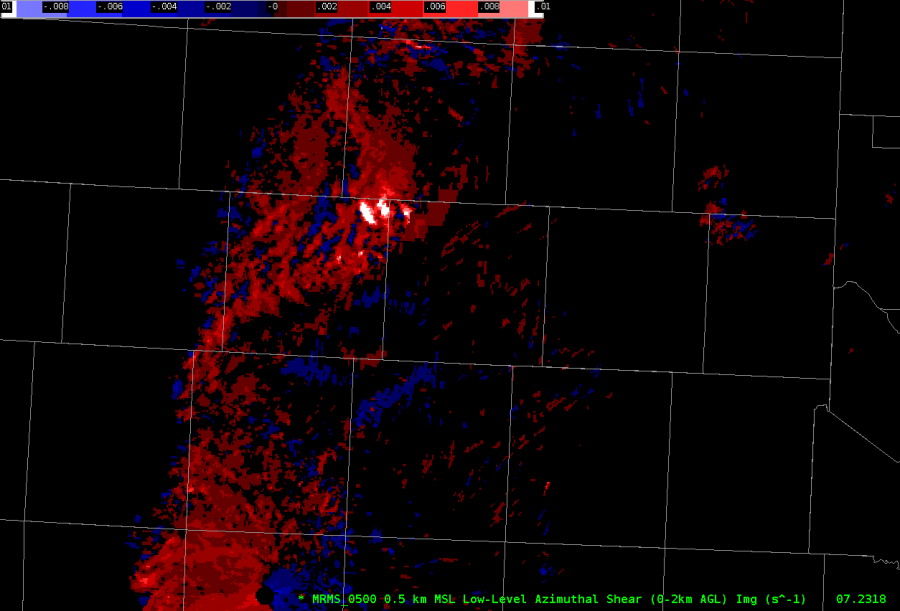
So, how may the Merged AzShear products come into play?  We’ll use this as an example (which is taken from the same time and space as the image above):

The first thing to notice is that there is much less noise; the merged product has a lot of the small +/- AzShear values around the KMXX radar site removed but still holds on to the stronger areas that may need closer inspection.  Advantage.  For the line southwest of KMXX, northwest of KEOX, again, many of the less interesting/noisy features are reduced leaving the areas of stronger shear in for closer inspection.  Advantage.  However, the biggest disadvantage is the time-lag; since the merged AzShear products arrive every 2 minutes, any quickly intensifying areas of rotation can be missed.  The merged product also has trail of where the strongest AzShear values are which can be used for tracking purposes; Netural.

As it stand right now, I’d say that I like the single-radar AzShear for storm interrogation purposes since it arrives nearly real-time with every scan.  It is also useful because it gives me the base information that gets fed into the merged products which then goes into the MRMS Rotation Track.  I’m a big fan of knowing what is going on “behind the curtain” and the single radar AzShear product gives me that information.

-Dusty

GLM Viewing Angles – what it means

Having both GOES-E and GOES-W GLM data provides some interesting opportunities to compare how the two instrument’s viewing angles impact the data.  Sometimes it does, sometimes it doesn’t.

First case, it confirms the large flash size in a flash across the Texas and Oklahoma Panhandles into Kansas: top image is GOES-W and bottom image is GOES-E.  The white flash is over 2000 km2; G-17 was 2140 and G-16 was 2685.  Not bad!  This was probably a flash extending  from convective cores in northwest Oklahoma back into the anvil region.

But now let’s look at a different flash; this time a bit further south.  The top image is G-16, bottom is G-17.

The white flash in G-16 was shown as a 2262 km2 flash while G-17 in dark red was only 1096 km2.  Why the big difference?  Probably the different viewing angles.  The image below is centered on a strong overshooting top that the flash in question above originated around:

G-16 has a more favorable viewing angle on this flash looking towards the updraft/overshooting top from the southeast.  G-17 may have had some of the weaker portions of the flash blocked by optical depth of the anvil or being underneath a part of the overshooting top.

The implications are that depending on the orientation of the storm to the GLM instruments; checking both will perhaps provide confidence in the evolution of Flash Area and potentially other GLM flash products as well.

-Dusty

GLM Data – How To Visualize?

The GLM data is showing a lot of utility and provides useful information on storm trends, intensity, and storm mode.  However, the biggest issue is how to visualize all this information and tie it to the meteorology; the “physics-science” side of things in order to tie everything together.

Here is the first attempt and why:
Top left panel – 5-Minute Flash Extent Density with 1-minute updates (enhanced color curve): this is a good way to see trends with the GLM data as it is a 5-minute window updated every minute.  Shows increases/ in lightning flashes with time with a “smoother” display rather than just every 1-minute frame.
Top right panel – 1-minute Minimum Flash Area (enhanced color curve): shows where the smallest flashes are occurring.  Rough reason; small flashes corresponds to strong updrafts with lots of turbulence limiting the extent to which flashes can develop.  So, small flashes (around or under 100 km2) should correspond to strong updrafts.  Works with both multi-cellular, super cellular, and pulse convection. Don’t use the 5-minute with 1-minute update because the tendency I’ve seen so far is that it can result in an area of small flashes that is way to large for an individual storm updraft as it covers where it has been for the last 5 minutes!

So, how to tie this into the meteorology.  There needs to be some way to show “ground truth” outside of the ground-based lightning detection networks.  So, let’s give this a try:

Bottom left panel – MRMS composite reflectivity at -10 C.  This shows strong convective cores that are capable of producing mixed-phased precipitation needed for lightning.  MRMS because it can cover areas with storms that are within the Cone-of-Silence for any given radar.  Going with -10 C gets above the melting level at 0 C and below the -20 C where the majority of particles should be switching over to more ice crystals than liquid and/or large hail.
Bottom right panel – 3 to 6 km Merged Azimuthal Shear.  If done right, this should show when mid-level mesocyclones are starting to strengthen and where rotation would be the strongest.   Strong updrafts that are rotation can help a storm produce small flashes (again, the whole turbulent mixing in and around the updraft thing).

Is this the best way to do this?  No idea!  It’s a start though and as we go through the following 6 frames, you can hopefully see how this plays out.  Watch the southern-most storm have high Flash Extent Density counts while the Minimum Flash Area remains around 60 km2.  Although there isn’t a strong sign of rotation in the AzShear product, the GLM data shows that there is a strong updraft that has maintained strength over the last 6 minutes.

Watching the northern storm, AzShear shows stronger rotation and a quick check of the base data (not shown Z, V, SRM) shows that there was a weak but persistence mesocyclone with the northern storm.  With time, the AzShear product shows strong cyclonic shear with this storm and we start to see the FED increase while flash sizes decrease.  It takes some time but after around 5 minutes, the Minimum Flash Area had bottomed out around 60 km2.

This isn’t perfect by any means.  Another issue to look it is how to incorporate this into warning operations because this is a lot to look at.  At this point, GLM data may be too much to add in a single-person warning situation.

Something to consider…

Increasing GLM activity in a dying storm

At 2330Z, GLM began picking up a signal of increased lightning activity with a storm moving into the LUB CWA. At the time the core was strong with a spike in value in the MRMS VII product, though real-time radar had started to show a weakening storm. (Left panel shows GLM Event Density)

10 minutes later, at 2340 UTC, the storm was deteriorating, yet GLM Event Density continued to increase in this area while ENTLN Total lightning data was decreasing.

After another 10 minutes, at 2350Z, GLM lightning activity continues to breanch eastward despite little reflectivity aloft and ELTLN lightning continuing to decrease in the area.

Finally, at 2352Z, 2 minutes later there’s a rapid decrease in the lightning activity on GLM in the easternmost storm. The Event Density data was the 5min-1min update, and it looked like 1 minutes worth of data was the result of the eastern extension.

#ProtectAndDissipate

Not issuing SVR because of ProbSevere performance

I’m pretty confident that a few of these cells given core heights and storm environment probably have real world warnings on them at the moment, but I’m holding off due to the performance of prob severe hail and tor through the day today. We’ll see….Particularly the northern storm in the CWA as it is more discreet than the storms near Lake Meredith.

-icafunnel