

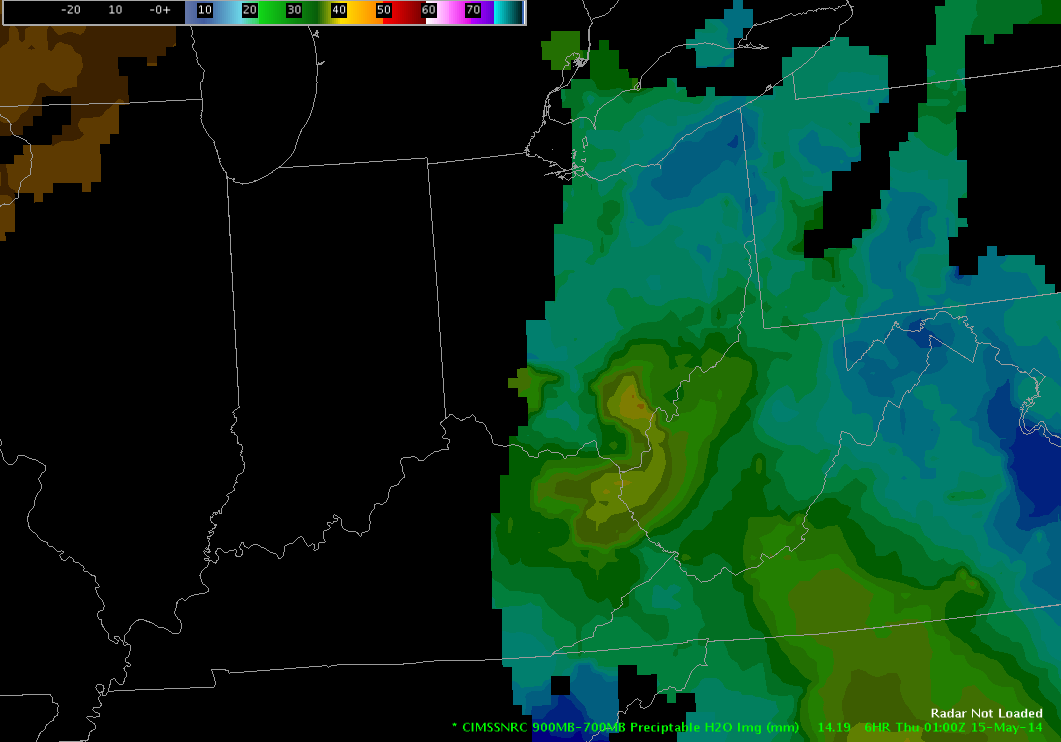
The CIMSS NearCast forecast 900-700mb precipitable water values are shown below at 22 UTC (top image) and 01 UTC (bottom image). It appears that 900-700mb precipitable water values will decrease across Ohio from 13-16 mm at 22 UTC to 7-12 mm at 01 UTC due to drier air moving in from the south. This leads to the following question, will storms dissipate? We will see…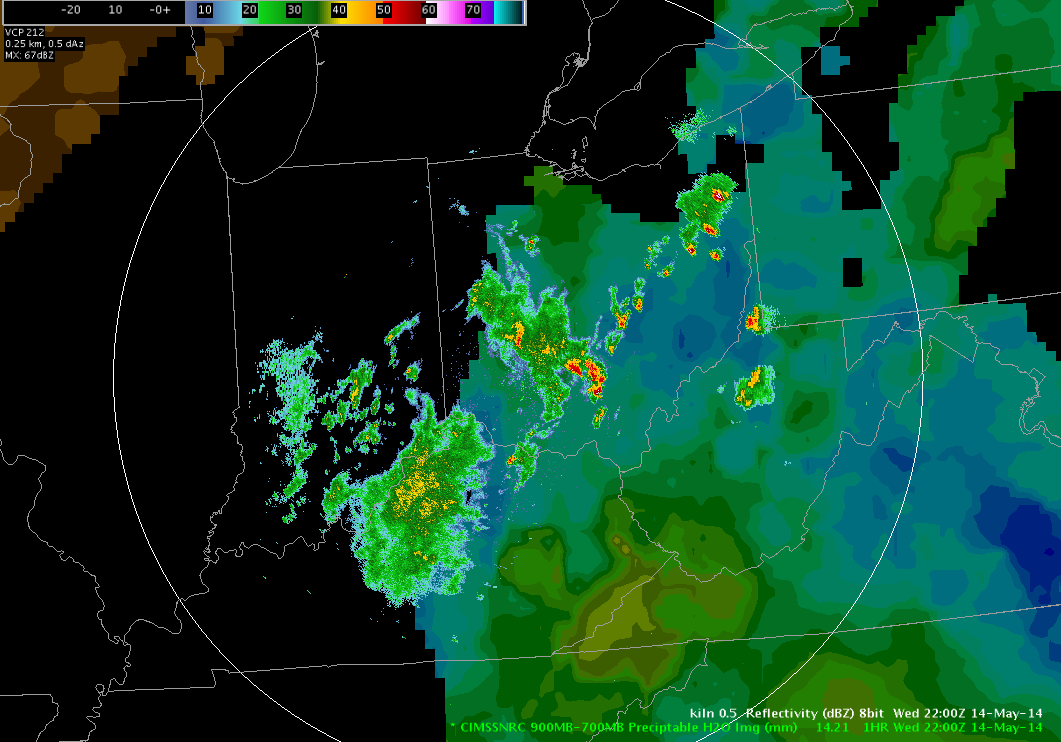
 Michael Scotten
Category: General
General Information and News
Lack of Lightning Jump Today
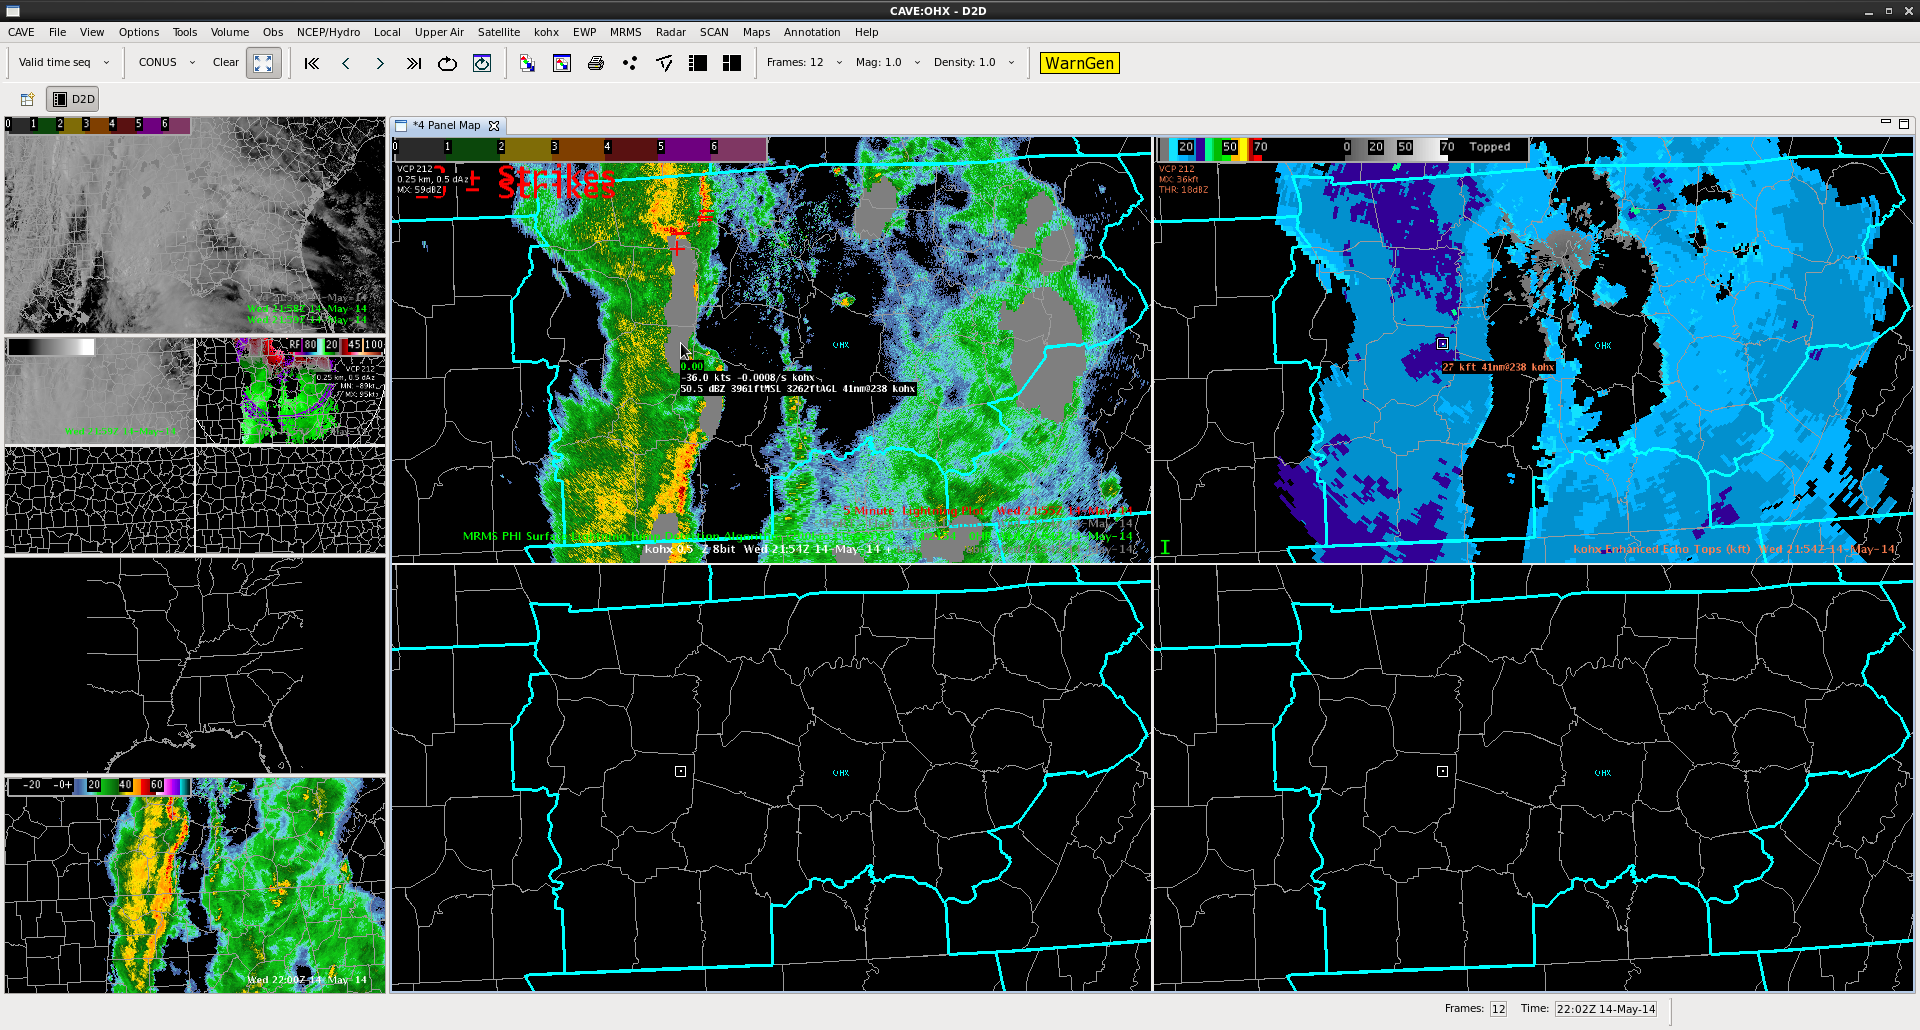 The image above is a screen capture of radar and lightning data centered over the OHX (Nashville) CWA at 21:54z. Today we evaluated the Lightning Jump Detection Algorithm since the OHX CWA was within coverage of the Northern AL Psudo-Geostationary Lighting Mapper.
In the four panel above focus on the top two panes where the top left has 0.5 reflectivity from OHX radar overlaid with the Lightning Jump Detection Algorithm (Grey) and 5 minute NLDN Cloud-to-ground lightning data (+ and – in red). The grey of color of the Lightning Jump Detection Algorithm only indicates 0-1 sigma or 0-1 standard deviations of the previous 10-minute change in flash rate. Significant jumps (increases in sigma) in lightning activity are correlated with severe weather. The top right pane shows OHX Enhanced Echo Tops. The convection observed in the top right pane was a low-topped QLCS as indicated by Enhanced Echo Tops of only 20-25kft. During the evaluation period of 20-22z no significant lightning jumps were detected due to the low-topped nature of the QLCS. Had the storm updrafts and tops been taller (upwards of 40-50kft) then lightning activity including jumps may have had a better chance of occurring.
Shawn Smith
vLAPS Analysis – Wed 2215Z
Here is a look at the vLAPS forecast at 20Z, valid at 2215Z. The forecast is a 2 hour and 15 minute forecast.
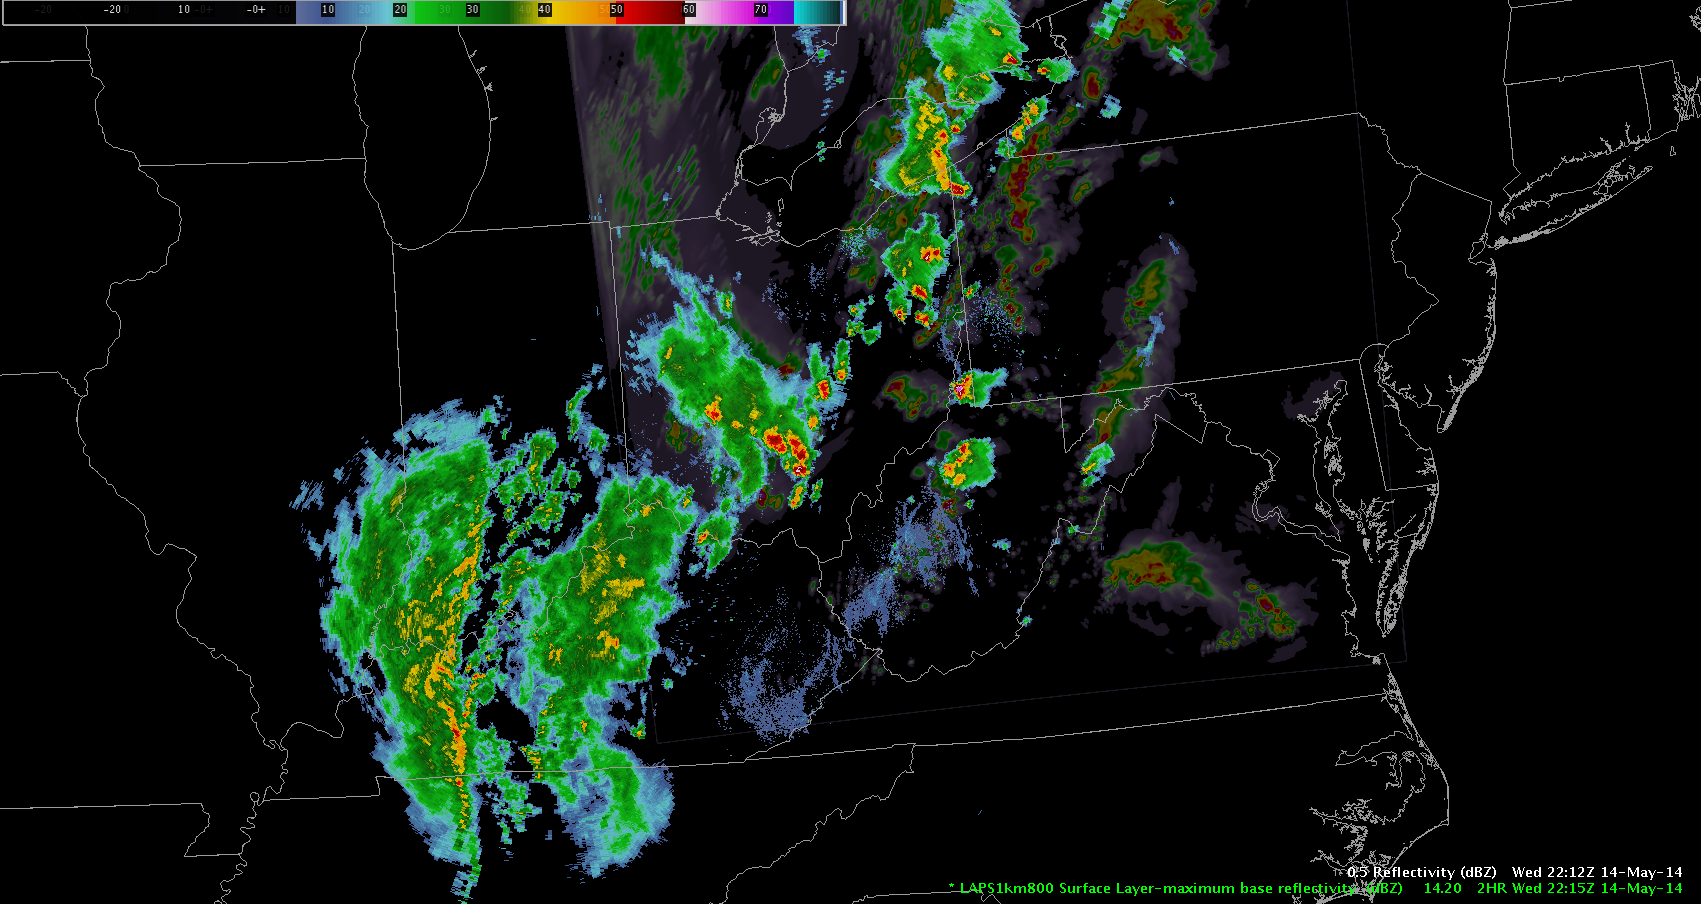
Here is the observed reflectivity data overlaid on top of the model forecast. The model is doing pretty well! It has pretty good placement of the storm cluster, and it hints at supercellular storm modes, which is what is currently being observed. Helicity was not available at this time.
Ohio Storms Developed on Western Edge of 780mb ThetaE Maximum
Storm development was occurring on the western edge of the CIMSS NearCast 780mb equivalent potential temperature gradient across Ohio on May 14. The NearCast products have been shown to benefit short term forecasters by indicating changes in moisture in an area where storm development is expected.
 Michael Scotten
In an otherwise stable environment…
The OT detector caught one spot amidst a long line of moderate rain and thunderstorm activity moving through Tennessee on Wednesday afternoon.

See? There it is! Taking a look at the IR imagery, this overshooting top sticks out like a sore thumb.
 Sampling showed that this OT was about 15 degrees colder than the surrounding cloud. In this situation, the signature was very easy to spot on both products. However, this cell did not induce a warning of any kind. Radar imagery did show that this OT matched up with the area of heaviest rainfall in the storm line, maxing out around 55-60 dBZ.
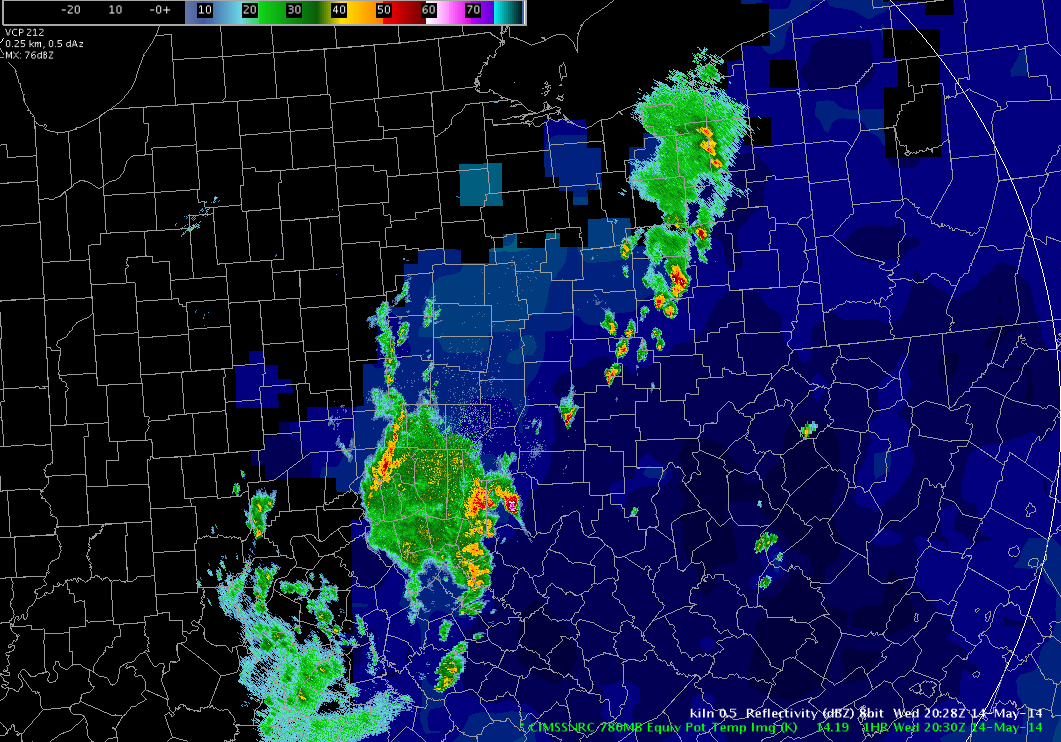
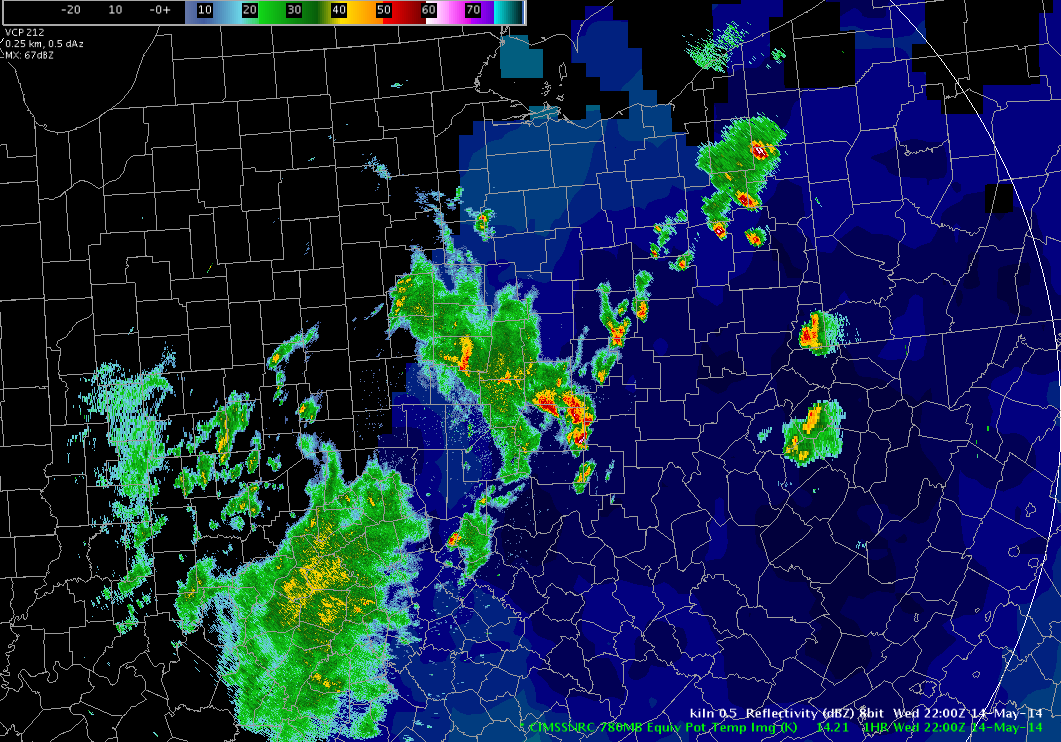
CI product doing well in east-central OH

The CI product has performed quite well today across east-central Ohio. It has consistently been showing 50+ probabilities across east-central Ohio. Above shows these higher probabilities at 19Z.

By 20Z, convection had fired in these areas of higher probabilities. Additional higher probs remain, which is also where some echoes are beginning to show up on radar within this corridor. Overall, very good performance today!
Simulated IR on the Mark on May 14


Prob Severe Tool Underdone
 In this case, the prob severe tool seemed very slow to react to this intensifying tool. I would have warned about 2 to 3 scans before this picture. In this particular picture, it shows a solid hail core around 25,000 feet AGL which was there for one to two scans prior. However, the MESH is only indicating 0.71 inch hail, which is quite underdone in my opinion. This low MESH is driving a low severe probability, 41% in this case. In this case, the probsevere tool would likely have missed the first reports of severe hail due to a seemingly slow response time in the MESH product, which gave falsely low values in the probsevere tool.
NSSL-WRF simulated imagery vs. rapid-scan GOES
I wanted to see how the two types of simulated imagery compared to each other, and compared to reality. Of course, the best way to look at reality is to use the super rapid scan GOES visible. Here it is at 19Z:
 We also have the OT product on this image. I tried to draw a circle around the OTs of interest with an annotation tool, but with 1-min temporal resolution, I wasn’t able to save my annotated image fast enough. (I tried 3 times with no success). I was surprised that the OTs were only showing up in the convective line from northeast MS to southeast TN. I thought we might see some in the cool-looking bubbly cloud structures in southeast AL as well. (Those clouds had produced FFWs in the area).
The simulated IR imagery below is also from 19Z. The model doesn’t show the area of overshooting tops that we were seeing in reality in northeast MS and southeast TN. However, it picked up very well on the larger, older convective shield in southeastern AL.
 The simulated WV imagery also appears to have missed out on this convection firing at 19Z in that same corridor. It’s also worth noting that further south in Mississippi, the convection appears to be overdone. But this area of convection matches up with an area that was under a FFW due to a high-precip event earlier in the day.
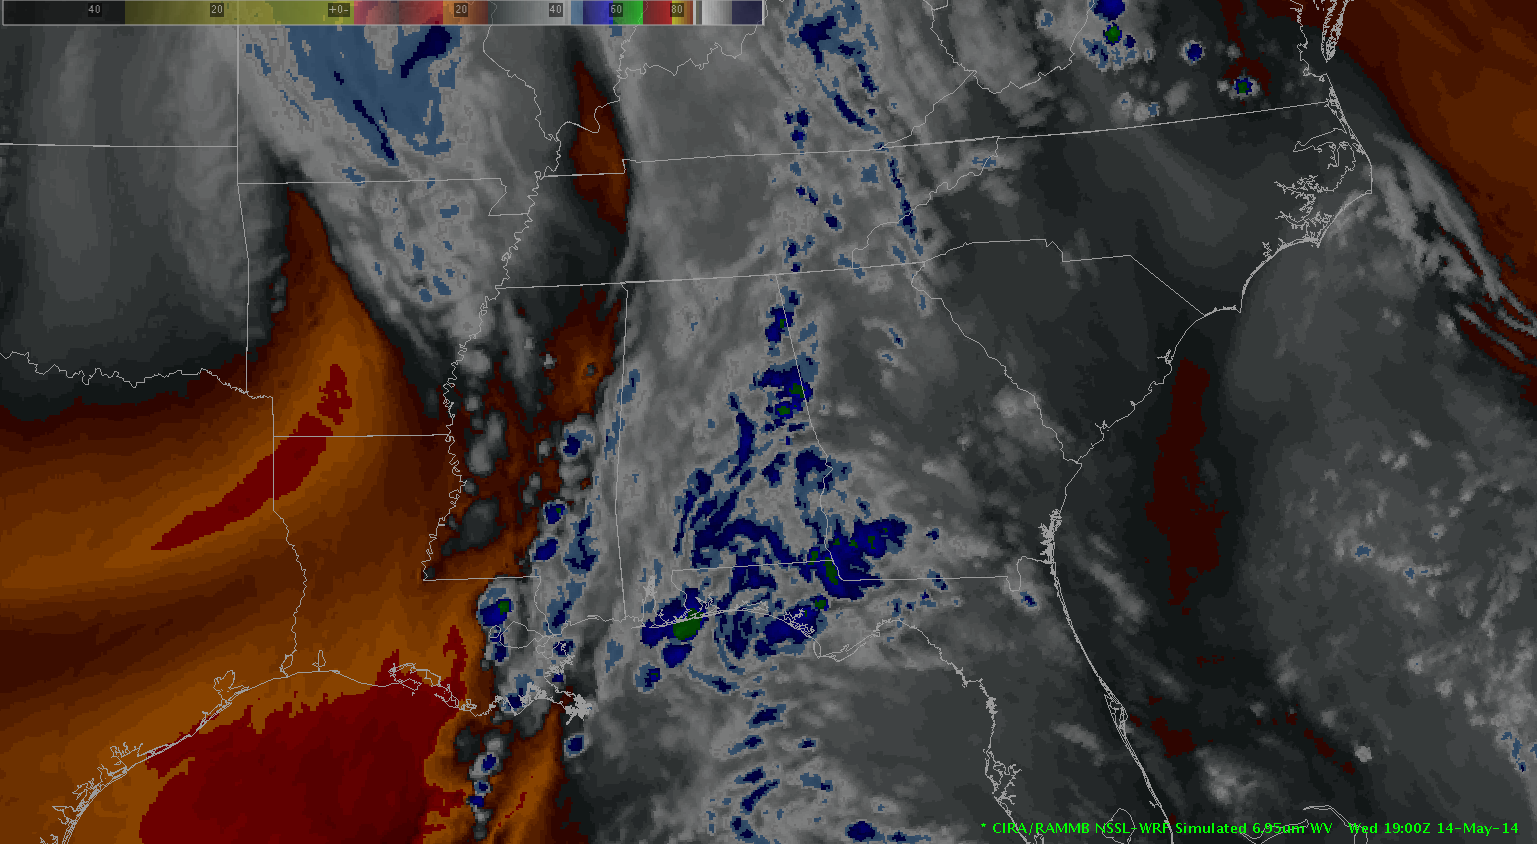
This case gives the appearance that the NSSL-WRF is doing a better job of simulating cloud cover in areas that have already experienced cloud cover and convection, and is not doing as well in areas where convection has not yet developed at the model’s run time. However, the overall spatial coverage of the cloud cover simulation is fairly accurate, and I believe it would be very useful, especially in the cold weather season, when convection is not so much of an issue.