NUCAPS Soundings ahead of and behind CF

The NUCAPS soundings available in AWIPS-II are generated from the CrIS and ATMS instruments aboard the Suomi NPP polar-orbiting satellite. A swath of soundings are available over generally the same locations at roughly the same times each day. On Tuesday, the swath over the east coast with a timestamp of 1815Z was available in AWIPS-II around 1930Z. This is great timing, as it falls between the 12Z and 00Z RAOB launches, providing an update on the thermodynamic environment.

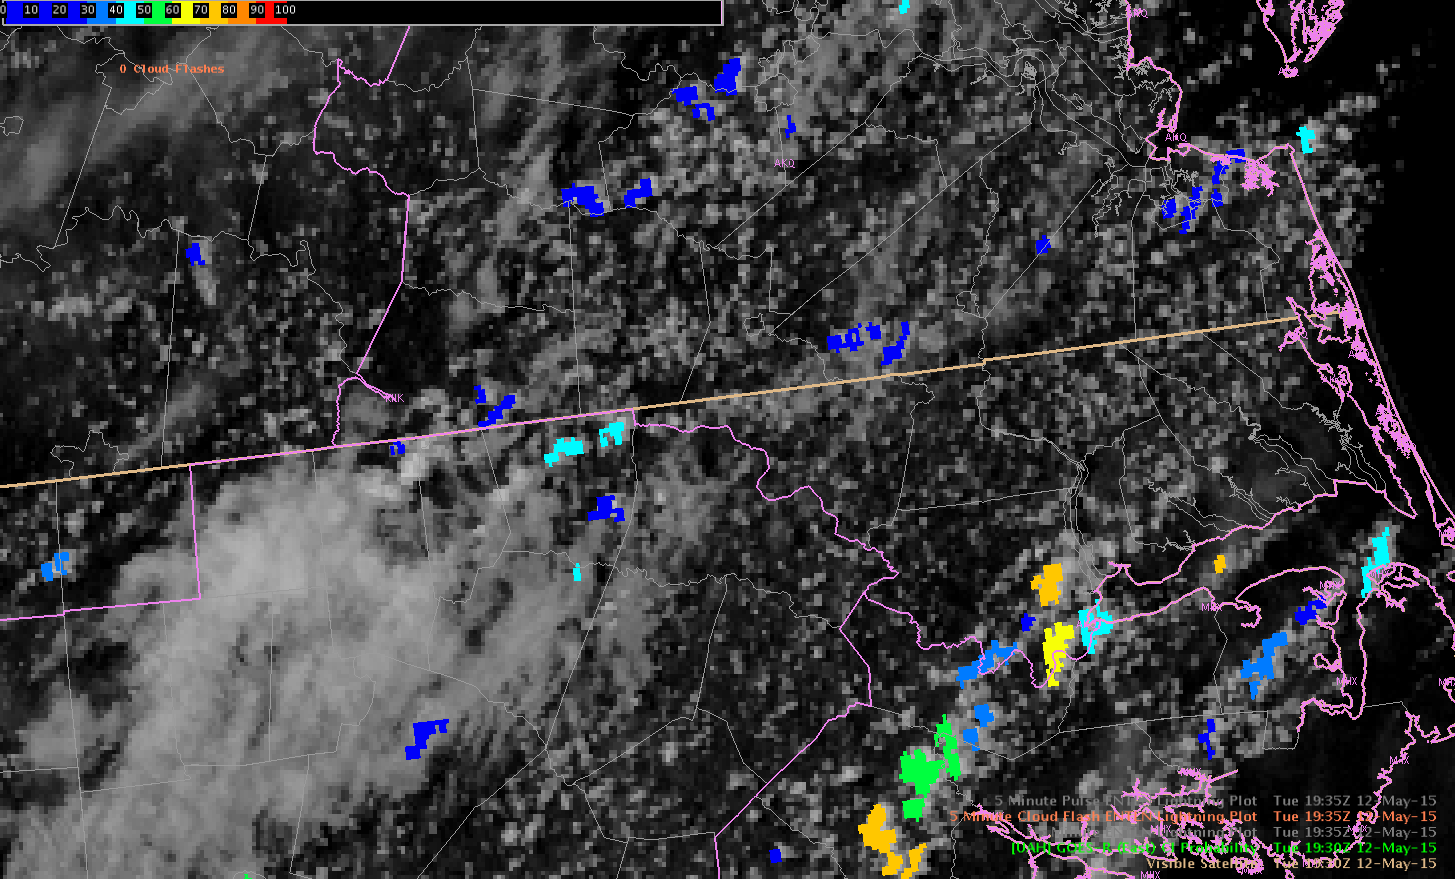
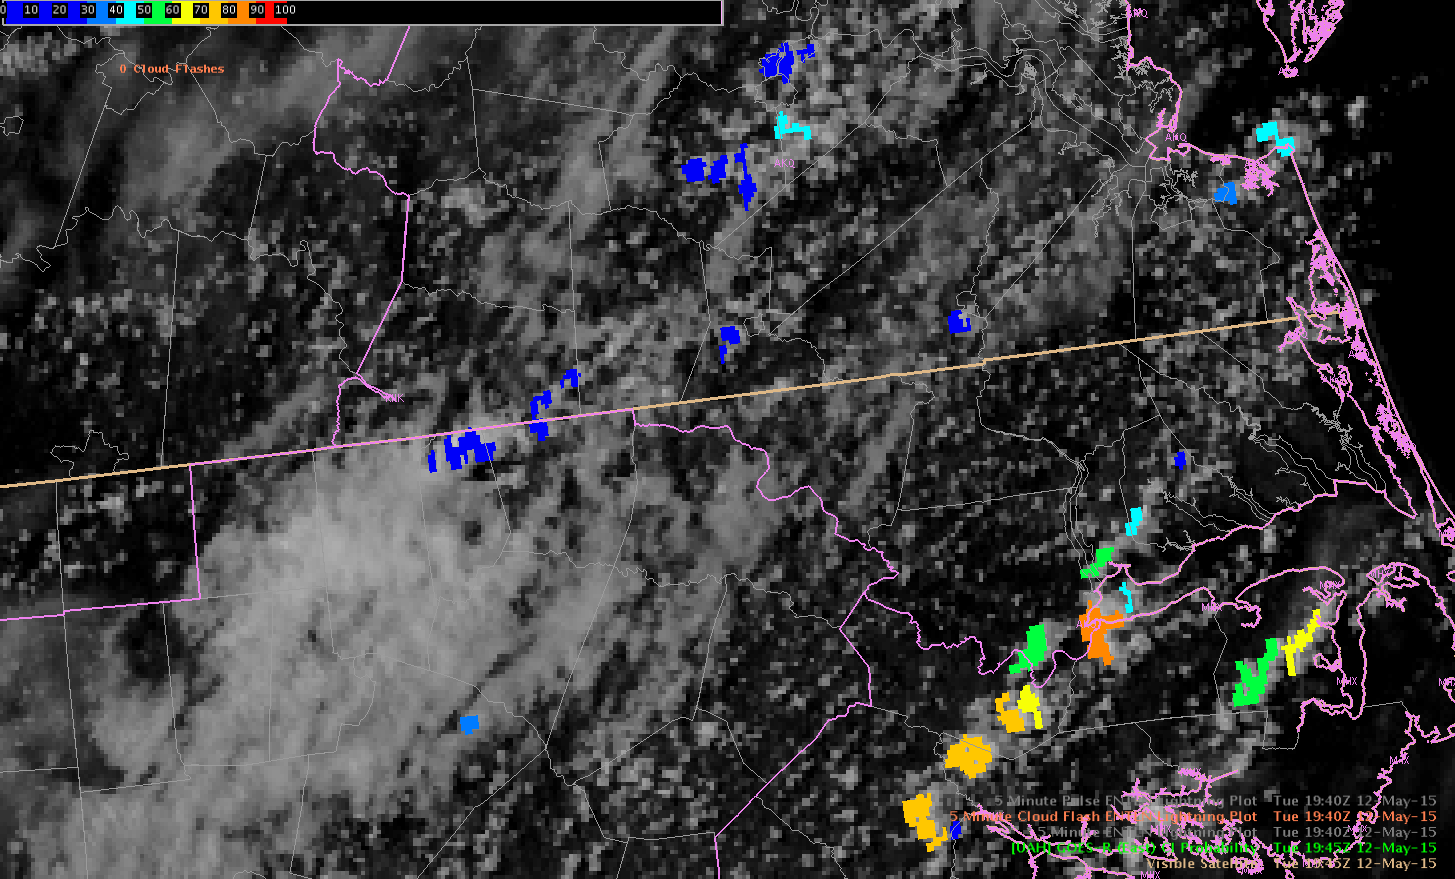
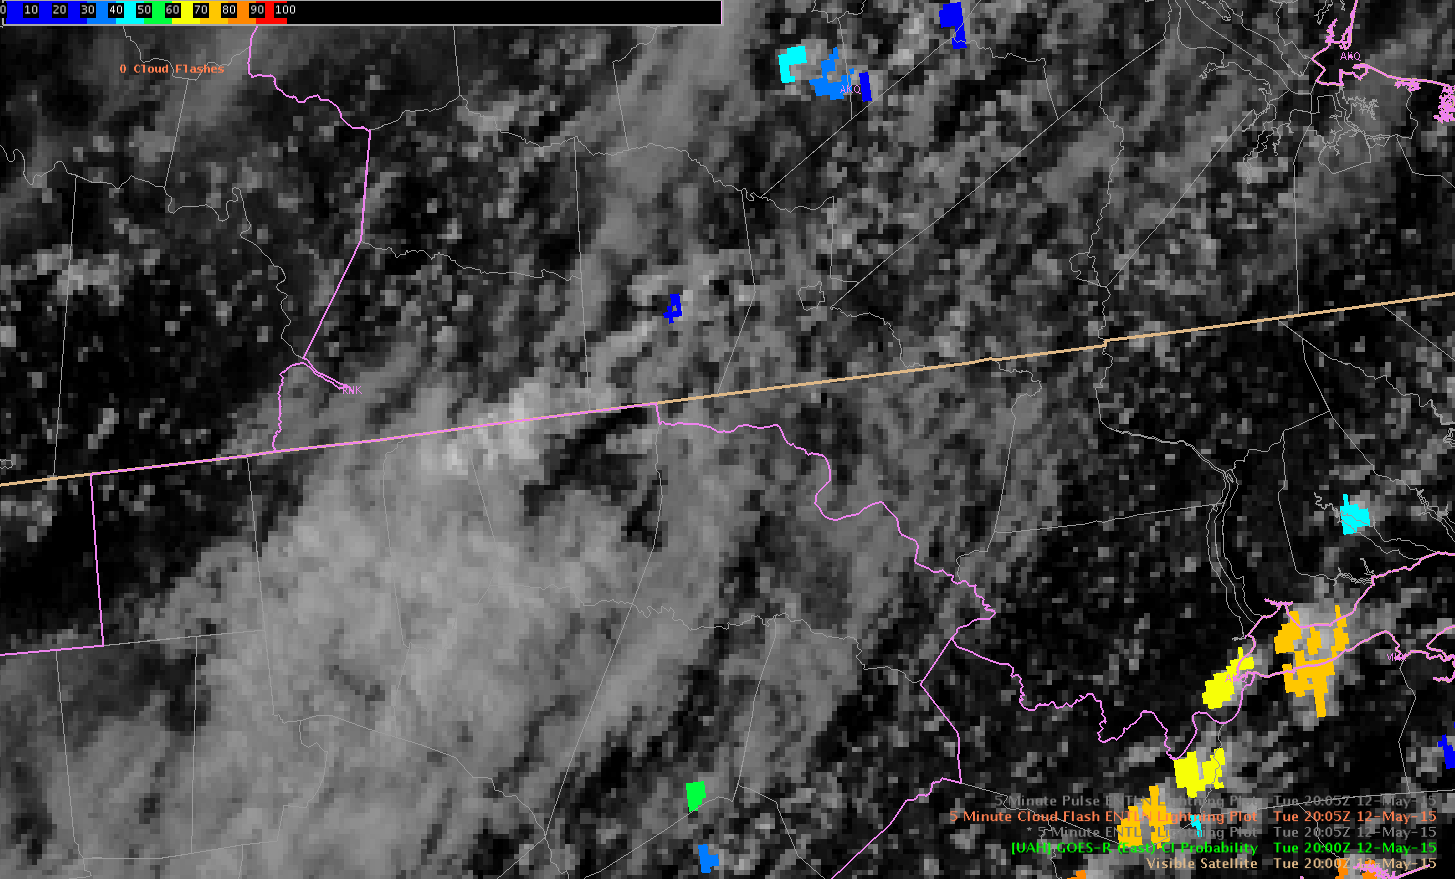
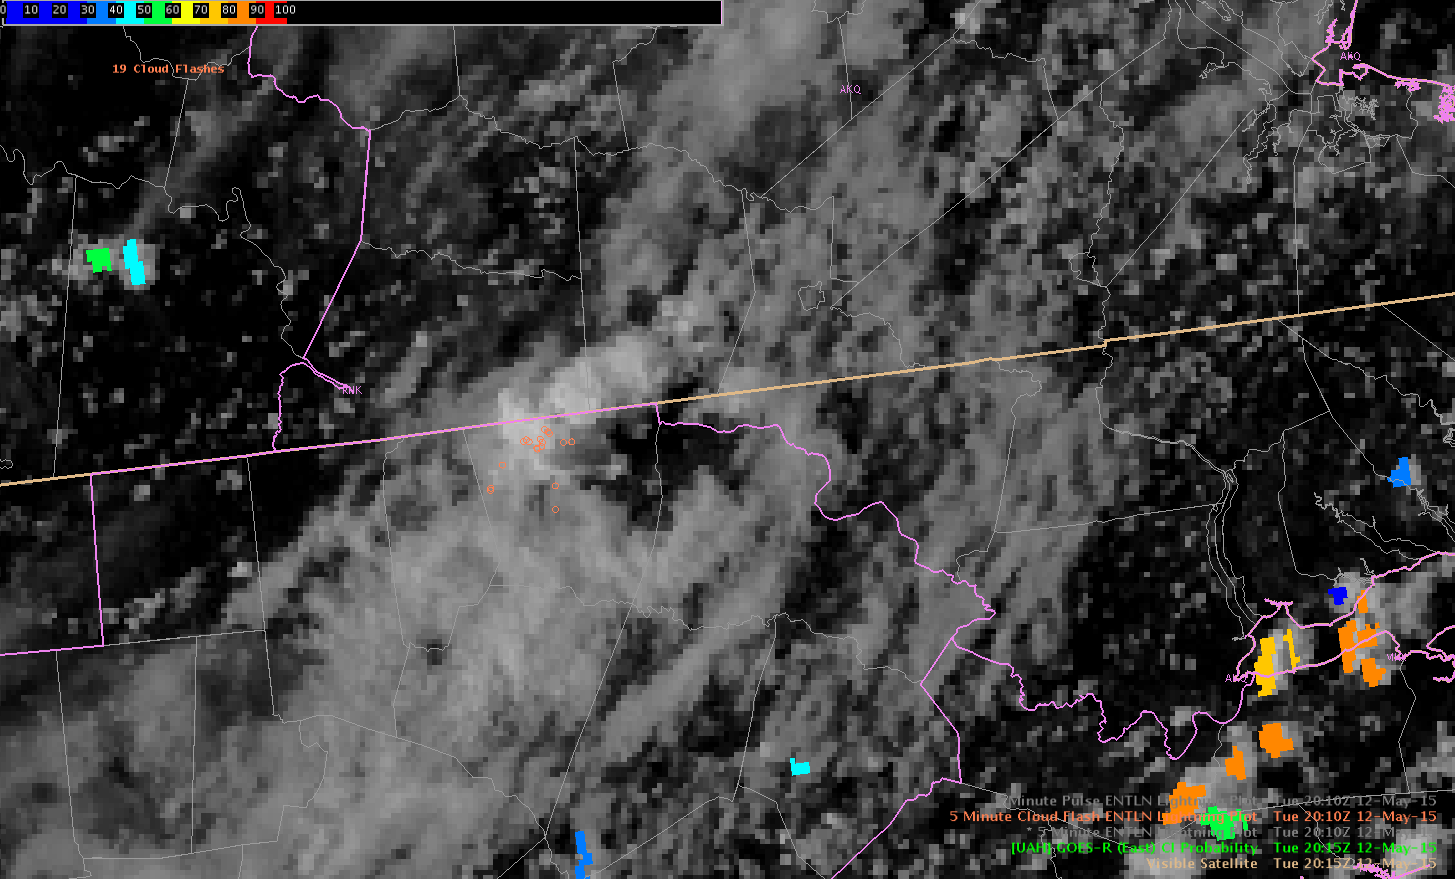
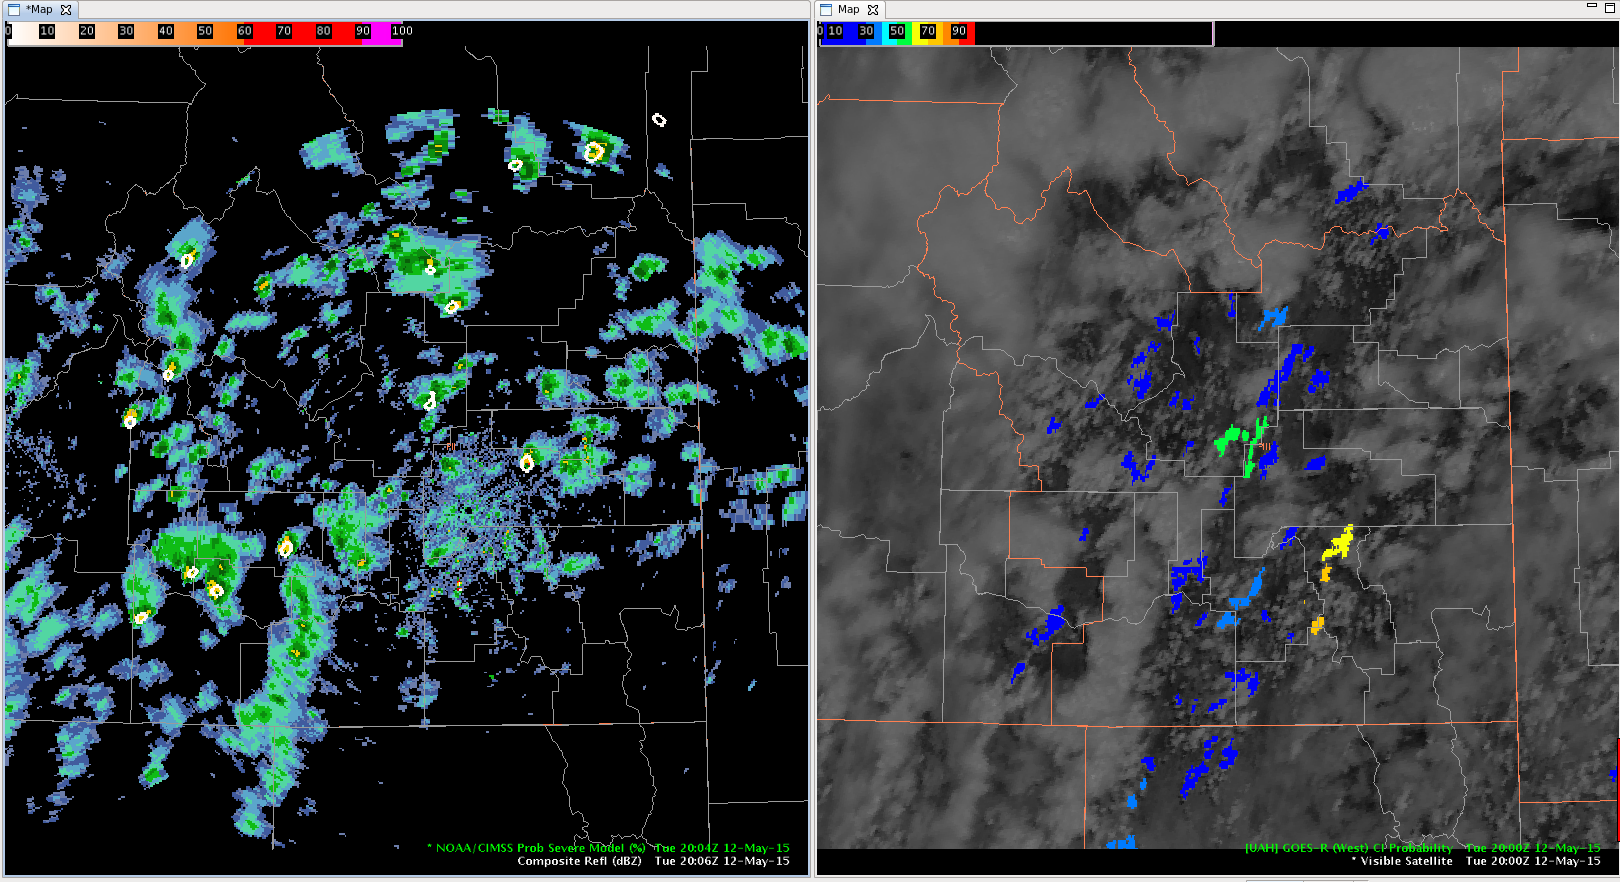
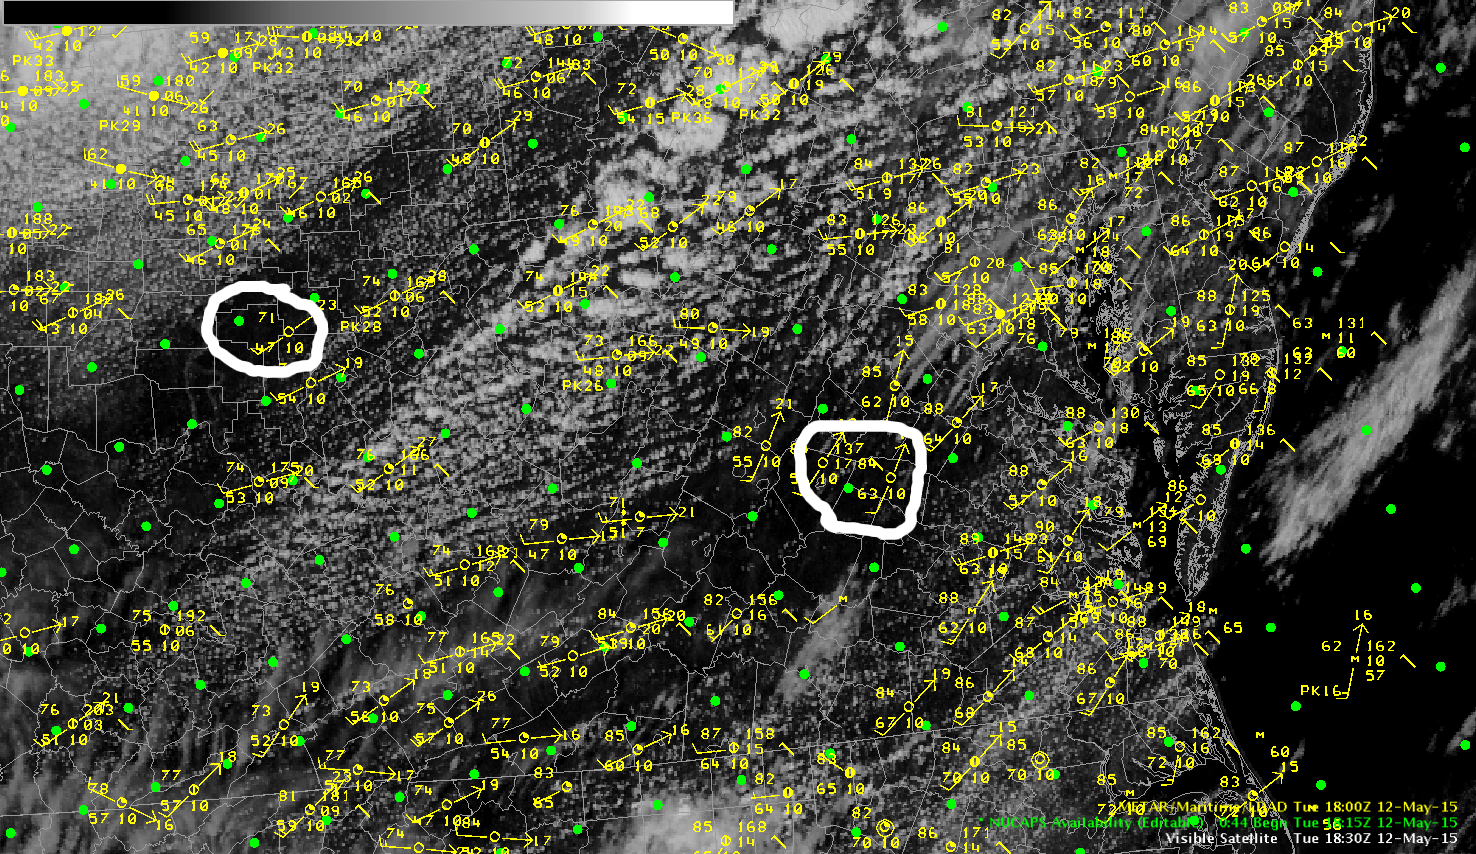
Today, one group was operating in the Sterling CWA where the threat for severe weather was quite low, but a cold front was quickly making its way through the region. The 1815Z NUCAPS pass was timely as participants were able to view atmospheric profiles on both sides of the front (Fig 1).

20150512_NUCAPS_points-DC_edit
Fig 1: NUCAPS sounding points with surface obs and visible satellite imagery overlayed. Centered over Sterling CWA.

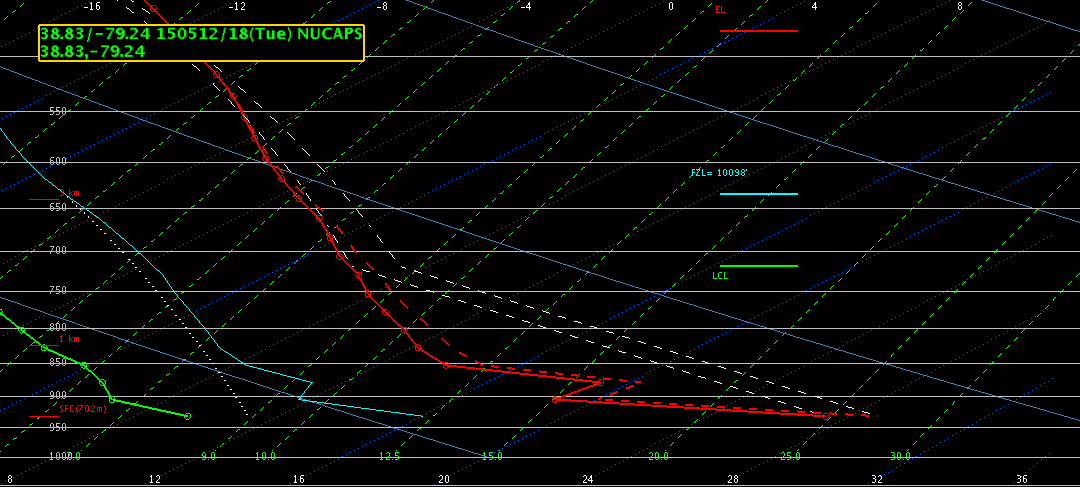
Selecting a sounding ahead of the front, the surface conditions (temperature and DP) needed to be adjusted to match actual surface conditions (Fig. 2). Additionally, the bottom few points of the sounding were smoothed out to make a more realistic profile LL profile. Upon making these changes, instability was still present ahead of the front given decent MUCAPE and SBCAPE. However, MLCAPE was virtually nonexistent, and a possible inversion was apparent between 700 and 850 mb, perhaps the reason for a lack of robust convective activity.

20150512_NUCAPS_points-DC_east_1_crop
Fig 2: Modified NUCAPS sounding ahead of CF.

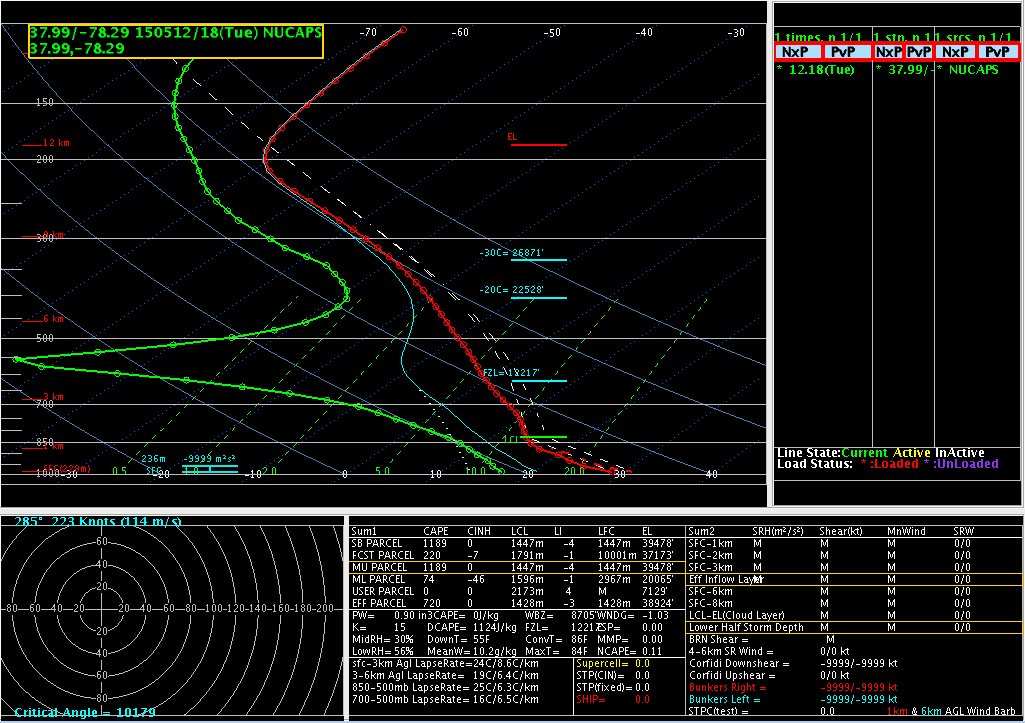
Selecting a profile behind the front and making the necessary changes to the lowest parts, one can certainly tell that the front had passed through the area (Fig 3). With significantly cooler and drier air aloft (in addition to at the surface) the atmosphere is now completely stable.

20150512_NUCAPS_points-DC_east_2_crop
Fig 3: Modified NUCAPS sounding behind CF

This was a good example of how a forecaster can use the timely NUCAPS soundings to identify the existence and locations of boundaries when they might not be so obvious from other guidance.

– Bill Line, SPC/HWT Satellite Liaison

Tags: None

CI Detection of a Thunderstorm

Updated at 430pm.

So the first thing we thought when we started to write this was the CI was having an issue “tracking” the cells because I couldn’t tell which cell actually developed out of all the cells the CI was indicating. This is part of the problem because some cells can get above 35dbz pretty quickly and between 15 min satellite scans.


Here at 1930Z, look at the area of light blue CI on the VA/NC border.

1930CI

Next, at 1945z… it is hard to see because I didn’t circle anything but the dark blue is actually farther north, different cells, than where the previous light blue was indicating.

1945CI

Next, at 20z, all CI probs are gone, indicating the storm likely got to 35dbz or didn’t form. And actually at 20z, a single lightning flash came up on ENI data.

20zCI

Now, at 2015z, there is much more intercloud lightning flashes.

2015CI

Lastly, at 2030z, the ProbSvr is at 13% and there are more lightning flashes with this storm.

2030z


The takeaway? First, it was quite confusing trying to go back and “track” which cloud the CI was tracking. Second, once I figured it out, the CI was less than 20% and for only 30 minutes until the storm developed. There is CI over 50-60% all over the Mid Atlantic right now and none of them are initiating. I found it quite interesting how quickly this one formed and it probably formed between the 15 min satellite scans making it hard to track.

Update::

I continued to follow this storm.

At 2040Z, the ProbSvr increased.

2040ProbSvr

At 2050z, it increased again.

2050ProbSvr

At 2052z, ProbSvr increased significantly. NWS issued a warning at 2054 (not that I am supposed to know that).

2052ProbSvr_Warning2054

I didn’t have Raleigh’s or Wakefield’s radar up on my awips but I did get it at 2108 and there is already a hail spike.

2108hailspike


At 2112z, the NWS received its first 1 inch hail report!


Lauren13

Tags: None

GOES-R Convective Initiation

Trends with the GOES-R Convective Initiation product can be useful to find areas for potential convective initiation.

Here is an example where the concentration and values of convective initiation pixels increased across west central Florida:

CI_Sat1

CI_Sat2

The forcing and shear was very weak, so finding areas where convective initiation was expected was non-trivial.

An hour later, substantial radar echoes developed across that part of Florida:

CI_Radar1

CI_Radar2

This tool could be very useful in weakly forced environments, where there is uncertainty in areas of convective initiation.

Polarimetric Researcher

Tags: None

CI Probability and Ground Clutter

While doing a test of the GOES (West) CI Probability in southeast Idaho it showed probabilities anywhere from 60-70% (yellow shading in the right image).

Screenshot-CAVE:PIH - D2D

The very next update the probabilities dropped to near zero (no yellow in the right image).  However, the corresponding radar showed no storms with dBZ greater than about 25 nearby.  It seems like ground clutter (a few pixels of 55-60 dBZ nearby) caused the CI Probability to improperly drop to near zero.

Screenshot-CAVE:PIH - D2D -2

-Champion


Tags: None

NUCAPS Accuracy

NUCAPS data has come in and it was compared to earlier soundings out of TBW. The two weaknesses of NUCAPS was controlled for by selecting a data point outside the current cloud cover. The data for temperature and dew point had to be modified.  The data was compared well to earlier sounding, demonstrating a similar profile.  Cape grew adequately as expected based on current thunderstorms and afternoon convection taking place.

UFFSU

nucaps sounding

Tags: None

Undo button for Soundings!

A request from a happy clicker- we need an undo button on the soundings! That go for any sounding edit on AWIPS2 but I thought I would put it under the NUCAPS as well. In case you are wondering, the inversion at 875mb is NOT real. ha! That was my happy clicking and the only way to go back is to try and move the line back to where it was before! Point is, can we have an “undo” option for the last point I moved?? Without completely resetting the whole sounding and all my edits!

sounding


Lauren13


Tags: None

Products for use in DSS

Something I have been thinking about Monday and into Tuesday was how I can use these products for Decision Support Services (DSS). Warning! This may be long!!

In NYC, DSS was constant-whether it be onsite at emergency management centers, concerts, 4th of July fireworks or NYE, we always did it. Now, in Huntsville, the DSS may not involve as many “people” but the difference is that almost all of the activities are outdoors (think: bass fishing, dragon boat racing- not joking) AND we can get thunderstorms/tornadoes literally every month of the year. When you are dealing with large outdoor events, a severe thunderstorm or tornado is obviously important and especially one moving towards the event. But in reality, ANY lightning is considered hazardous. When you are dealing with a 20% chance of less or a boundary that may/may not form, it is critical to find a tool that can give you any sort of lead time before the radar shows reflectivity.

So I’ll give you a couple examples of how the GOES-R/ProbSvr have helped or when it could have helped a DSS event.

Back in 2011 (or 2012 I can’t remember) I was working the Black Eyed Peas concert in Central Park with a forecaster (they broke up after that-I promise it wasn’t my forecast). The concert was later and we had some scattered showers during the day but a low chance at night during the concert. But it was middle of the summer and there was a sea breeze so all bets are off at that point. At night, we had no visible satellite and IR probably wasn’t going to get deep enough to tell us much. Long story short, we may not have known anything was happening…until it already was. Sure enough, around 9pm lightning started firing in cloud to the east and within 10 minutes, a line of thunderstorms formed no less than 10 miles to the east of the concert with light rain developing and moving over the concert. So what can help? I definitely think the CI product would have given us a heads up to start. The satellite imagery products of CAPE..etc.. may have showed us where something was increasing. Also, having the total lightning product showing us as soon as the in cloud lightning started or where the density was increasing would have also given us some lead time!

Early this year, Huntsville had a huge arts festival that draws over 100,00 people in a three day period. It is usually around the time of April 26-29 each year which, is peak severe thunderstorm/tornado weekend for Huntsville. We provide onsite DSS to them each day.  On the Saturday this year, the atmosphere was prime for severe thunderstorms. All that was missing was a trigger! But we knew if the cap broke and any boundary snuck down, a thunderstorm could pop up fast…and anywhere. I definitely utilized the Convective Initiation product and seeing those probs stay around 20% kept my faith we would be ok for awhile. I could have also used the satellite based stability products because we didn’t have LAPS data on the computer we had. It would have been the best thing other than the SPC meso analysis to tell us the current conditions.


In the future, these products have significant abilities to help with DSS across the country. I obviously like Convective Initiation the most but I can see the ProbSvr model helping us predict if a storm will collapse. One issue is if a storm is coming for a concert- do you hope it dissipates and risk lives or evacuate thousands of people and the cell collapses? ProbSvr could help us see a trend and that probability as it weakens/strengthens. The same goes for total lightning- the timeseries and tracks can show us if the lightning is lessening or increasing so make a better choice for evacuations.

Lauren13

Tags: None

Earth Networks Lightning Display

The lightning data CAN be helpful. Tracking a developing cell lightning data can help alert a forecaster to a highly charged storm that can impact the public. It is difficult to have faith in the lightning storm alerts when lightning is the only variable considered. The shear environment is weak in western Florida, but there is certainly charge. In the case displayed in the image, Severe Prob did also indicate a higher percentage of becoming severe (>70%). Still, this lightning data might supplement a forecast for developing storms, but it cannot be considered alone. The display is also quite messy. The selected image showers two pink boxes overlapping over one another. A third, larger box alerting to a dangerous thunderstorm is also clouding the display.

051215 earth networks1

UFFSU

Tags: None

ProbSevere Low with SVR MESH & LTG Time Series

Here is an example just outside the PIH CWA that shows a cell with very low ProbSevere (~1%), but with MESH of 1.26 in. It appears the low ProbSevere is a result of Env MUCAPE of only ~350 J/KG. Base radar analysis showed that this cell did strengthen, with a very brief period of 50 dBZ to ~ -25 C.

ProbSevereLowHighMESH

The pulse nature of the cell can also be seen in the total lightning time series. Where a brief period (~10 min) of > 10 flashes per minute was observed, before quickly dissipating.

PulseTimeSeries

Ertel

Tags: None

Sig #2 Using ProbSevere

Another thunderstorm rapidly intensified with ProbSevere increasing from 2% to 90% in 16 minutes:

Florida_Sig2-1 Florida_Sig2-2 Florida_Sig2-3 Florida_Sig2-4

Further integration showed ~60 dBZ at -20C (from MRMS). Therefore, this storm was probably close to severe criteria. I decided to issue a significant weather advisory (polygon on all images) for strong winds of 50 to 55 mph and nickel size hail with the assistance of ProbSevere.

Polarimetric Researcher

Tags: None