HGX First Warning of the Day

Using the PGLM, ProbSevere and KHGX all-tilts, warning decision was made for large hail and wind.

The PGHG flash densities spiked at 66/min at 1906z

HGXwarning4

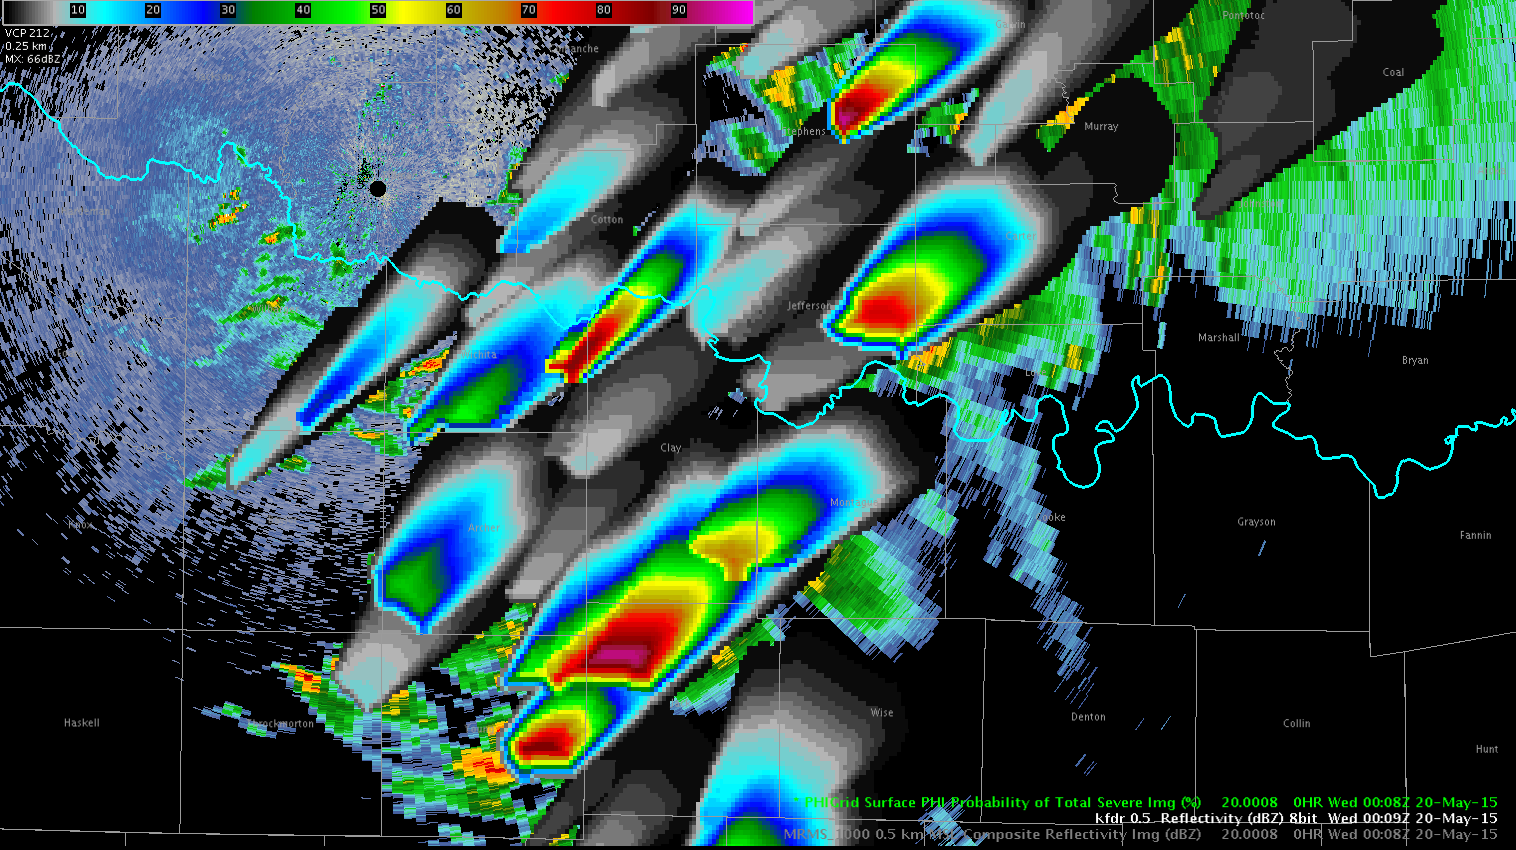
Meanwhile, the ProbSevere also was increasing. After remaining steady at 20%, it jumped to 80 percent then maxed out around 90 percent.

HGX_warning1

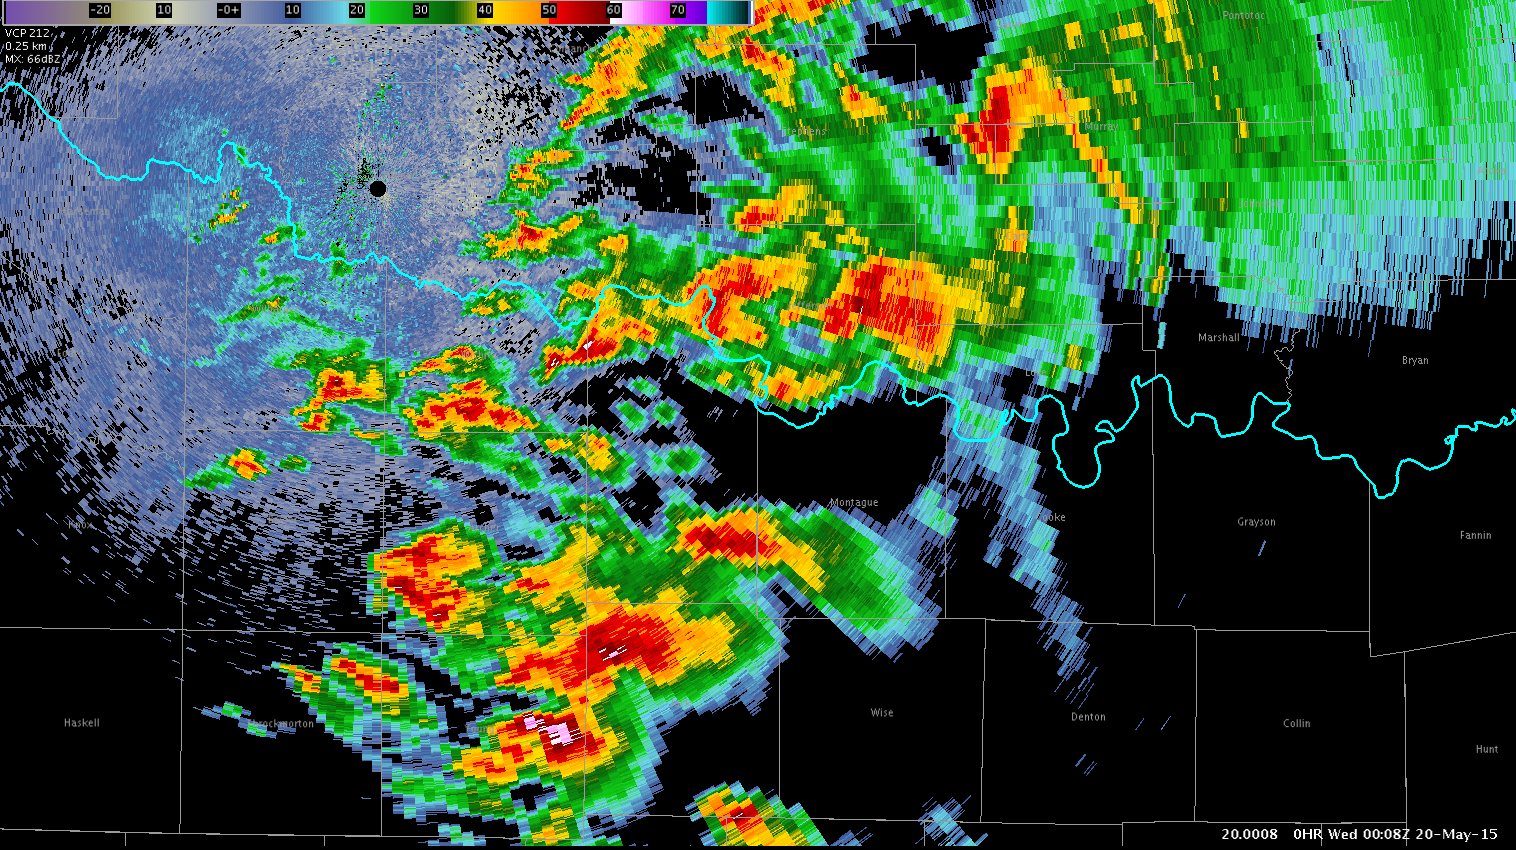
On the other CAVE perspective, the KHGX radar data showed a weak hail spike at the 5.1 degree slice. The Z/CC showed this fairly well.

The combination of the ProbSevere, PGLM lightning densities and the radar data provided enough confidence to go with a warning.

HGXwarning3


George

Tags: None

Rapid Scan Comparison

The top image below is SRSOR Visible at 1820UTC. The second image is regular GOES Visible at 1745UTC. There was a lot of useful information available in the rapid scan in between regular GOES scans (in this case 45 minutes between images in AWIPS). The Rapid Scan showed clearing skies south of a cold front  and west of a weak surface low. Briefly following clearing the rapid scan clearly showed growing cumulus/convective initiation along the lines with scalloped area below.   Details of individual cloud elements (including tops quickly blowing off with initial convection) was very obvious in the rapid scan.

While regular GOES imagery reflected the general trends on a larger scale, it did not reflect the extent of clearing skies or convective growth. Evolution on the storm scale is not evident.

-snowstrm

SRSORVIS GOESVis

Tags: None

PGLM Color Curves HGX

Developing weak convection over HGX area with low flash densities. Comparing two color curves, I prefer the ‘blue to green’ gradients for values less than 10. It was easier to discern the values, especially once values do exceed 10. The other color curve (green to yellow) was harder to distinguish as it went from green to yellow to red back to a yellow color. Granted, this storm is rather weak with low flash densities.


lma_color_1 lma_color_2


George

Tags: None

pGLM color tables in NTX

Example pGLM total lightning color tables in north Texas around 0045Z.

All are layered over radar mosaic.  Aware though that this may not be the way many other users build the map.

Default
Not much resolution in values below <10, but this may or may not be a meaningful feature.  The forecaster needs more information to form an opinion about that.
Drawn to the very distinct separation from the background by starting the table with white (unlike most other layers) and also to the logical flow through the colors.
0519pglmdefault

LMA_1
Something of a compromise between above and below.  Pops above background, and resolves very low values <10.
0519pglm1

LMA_2
Outline not always cleanly separated from background
Ramping from yellow to orange and back to yellow does not seem intuitive to the forecaster at this time.

0519pglm2

-Holaday


Tags: None

LMA ColorTable

Out of the 3 available colortables for LMA data I prefer the “LMA_default” as shown below. It clearly highlights the greatest density. The other colortables have more gradation, highlighting lower values which don’t seem to be meaningful. The colortable with yellows/greens is non-intuitive – in other words, it not clear at a glance which colors represent higher values.

-snowstrm

LMA_ColorTable

Tags: None

ENI Flash Rates and Cell Track Show RM Supercell Change

A right-moving supercell with a tornadic history in srn OK experienced rapidly decreasing flash rates, followed by a sharp turn left. Flash rates dropped from 150, to 50% of their previous values, into the 70-80/min range. Having the Cell DTA rate tracking, the turn to the left, and out of the warning polygon, was clearly seen.

RightMoverChangesDirectionRocky


Phi1 Phi2

Tags: None

West Texas Soundings

First try at comparing modified soundings.

1. 12Z Midland RAOB modified to 30/18, yielding 4250 SBCAPE (3800 with ob at time of earlier NUCAPS)

519mafmod


2. Afternoon NUCAPS nearest LBB (designated CWA today) modified to 26/19, yielding 3900 SBCAPE.

LBB is appx 125 mi N of MAF, but in reasonably similar environment.  Despite other differences, feature at 700 mb appears in both.

519lubmodnucaps

3.  Next, NUCAPS afternoon sounding nearest MAF (in relatively cloudless area).  Not modified.0519mafnucaps

4.  And finally, for comparison, the observed 0Z sounding at KMAF.
SBCAPE at 4200.  The drying of the air at 600-800 mb since 12Z is reflected by intermediate NUCAPS soundings.

0519maf0z

-Holaday

Tags: None

GOES-R LAP Cape Retrievals Underestimated Today

For the afternoon, a more complex cloud regime was seen over northern Texas and into OK. GOES-R LAP algorithm struggled to correctly identify the CAPE gradients and values were roughly 30-50% of model and observational data comparisons. The data was not used to assess the instability.

PWRetr4Panel Screenshot-SPC Hourly Mesoscale Analysis - Mozilla Firefox

Tags: None

LUB boundaries

Overlay of LAP derived CAPE and SRSOR visible imagery at 23Z  shows the key boundaries in and near the LUB CWA.

One, N-S, slowly progressing east.  Another, stationary, oriented NW-SE, the air cooled by earlier convection with a northeasterly surface flow.

0519lubcapevis


-Holaday

Tags: None