Using Single Radar Shear w/ Merged Shear

Here is another example as to where high single-radar Az Shear and Merged shear values remain significantly high while velocity values falsely indicate the storm may be weakening. Using Az Shear coincident with Merged Shear data would result in myself (as an operational forecaster) maintaining focus on what is likely still a significant storm, even though the overall velocity data no longer looked as impressive.

Neighboring Radar’s Az Shear Useful for Situational Awareness

When initially switching Az Shear from KMXX to KEOX, I was surprised as to how strong the Az Shear values were from KEOX well before they increased from KMXX. This got me thinking as to how Az Shear could be used in a situational awareness type of setup.

Given that the storm was >100km from the KEOX radar site, the higher beam height from KEOX was likely picking up on what was going on in the mid levels of the storm (although the beam width was also much greater). A good situational awareness “best practice” could be to have a procedure or display that would display all the single radar Az Shear values  from both the home and surrounding radar sites into a multi-panel display. Noticing that a particular radar was showing higher Az Shear values could lead the operational forecaster to focus more attention on a particular storm, with the idea of the earlier increase in Az Shear potentially leading to a faster lead time down the road.

KEOX single radar AZ Shear is on the left. KMXX single radar AZ Shear is top right, and KMXX velocity data on bottom right.

Single Radar AzShear vs Merged

Single radar AZ Shear would be very beneficial to the field offices. While the merged Az Shear is useful in assisting with various trends (per se) and overall placement of stronger values, having the single radar data provides the fastest information to the forecaster with the best resolution. During a real-time situation, having instant data rather than data that is ~2 to 3 min old can make a significant difference.

This image shows the single radar AZ Shear data on the left, with the merged 0-2km on the bottom right, and merged 3-6km on the top right. The place marker in each image shows where the “area of warning interest” is currently located.

Warning off AZ Shear?

In this example, I would  feel quasi-comfortable issuing a tornado warning before a tight couplet appears on velocity, given the increased Az Shear values that occur about a volume scan before the low level velocity tightens up. The caveat is that the forecaster must fully know the atmospheric setup before focusing purely on Az Shear data.

These images indicate, from top to bottom, the initial enhancement from Az Shear before the velocity couplet really started to tighten up. The following two images are the two subsequent scans.

Low-level AZ Shear continues to do well

The Low-level AzShear Product continues to do well, increasing significantly in areas where tornadoes were reported, and showing value in areas where looking at Doppler Velocity alone may not show the best picture of the vorticity within the storm (which was pretty messy at this time). However, some limitations I was seeing was 1) latency issues with short-lived circulations which I would hope the single-radar product would mitigate and 2) possibly due to SAILS cuts, the same features are often captured multiple times in the same image (i.e. vorticity along gust fronts and low-level rotations).

#ProtectAndDissipate

Lightning Jumps in Action

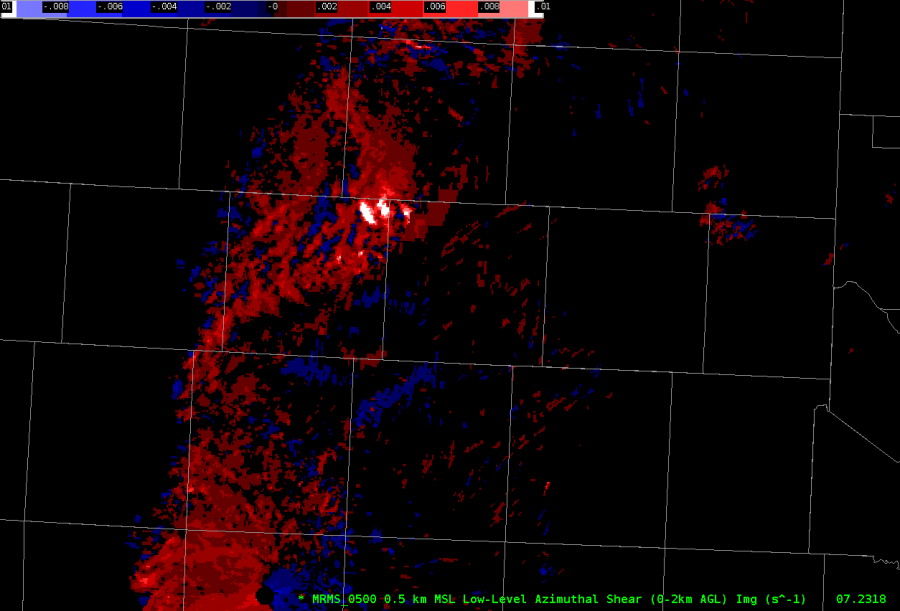
The storm near Tulia is…impressive.  Aside from being a long-tracked supercell, the storm has been extremely active electrically.  There have been several lightning jumps with this storm that appears to coincide with an increase in the strength of the mid-level mesocyclone.  First we will take a look at an hour long loop (TL – Flash Extent Density overlay with Vaisala GLD, TR – Minimum Flash Area, BL –  Optical Energy, BR –  Mid-level Azimuthal Shear (3-6 km AGL) with New Mesocyclone Detection Algorithm Overlay) :

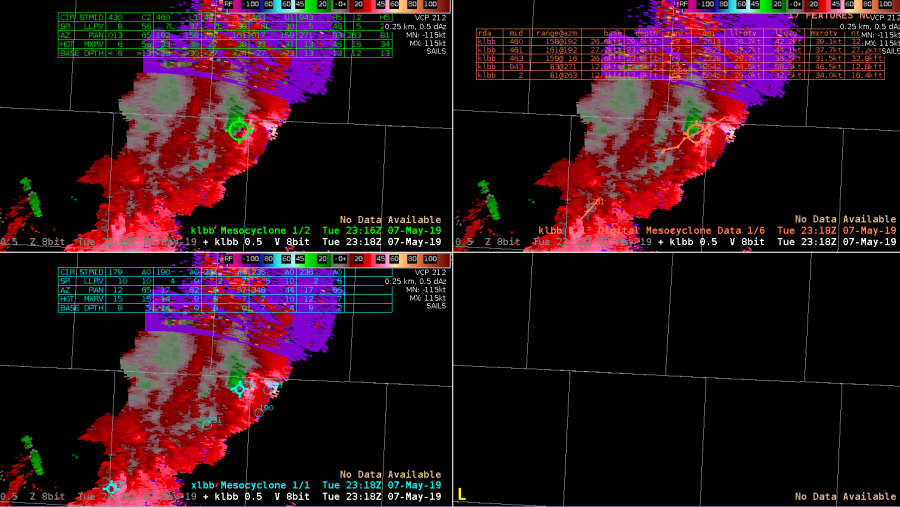
There are two jumps to take a look at, 1) between 21:29 and 21:40, 2) 21:55 – 21:20.  Although the AzShear product doesn’t show a strong mid-level meso developing, the number of positive CG flashes in the GLD data increases and we see continued small area flashes in the core.  The more impressive jump is the second one;  AzShear shows a much more pronounced area of positive shear, a long-lived NMDA indication (the circle with 4 pips on it), and overall smaller flashes in the area of that storm.

Shortly after the last jump (and not shown here), live stormchaser feeds showed a rapid strengthening of low-level features; well defined wall cloud, organized rotation, and frequent CG activity sending a flurry of stormchasers heading east to get out from under the storm…

-Dusty

High AzShear Values Near Areas of Range Folding

When using AzShear forecasters need to watch out for high values near areas of range folding. You can’t just assume that the high values mean something. This is an example to show that you still need to do basic storm interrogation and can’t purely rely on AzShear to issue warnings.

Displacement from damage path

KEOX AzShear shows displacement to the north from the given damage path. This shows up with KMXX AzShear as well. This displacement is also occurring with SRM data, but even more so with AzShear. Circulation is so small that AzShear is quite helpul here, as this could almost be missed with SRM data, and reflectivity looks completely innocuous. Detection of this short-lived tornado would be picked up much better with the use of AzShear.

ZDR_Arcophile