NMDA & NTDA Readouts

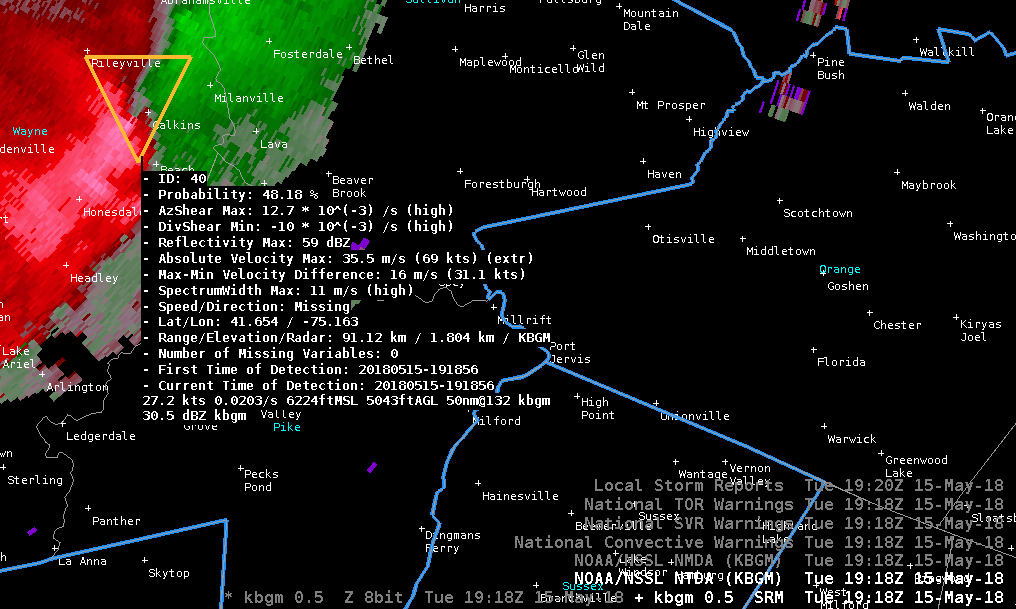
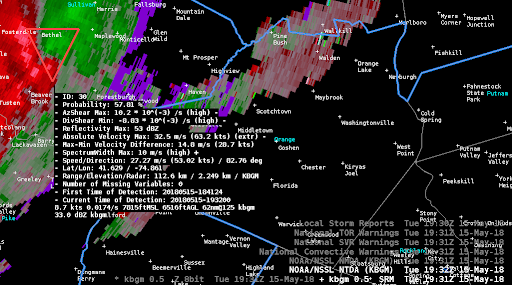
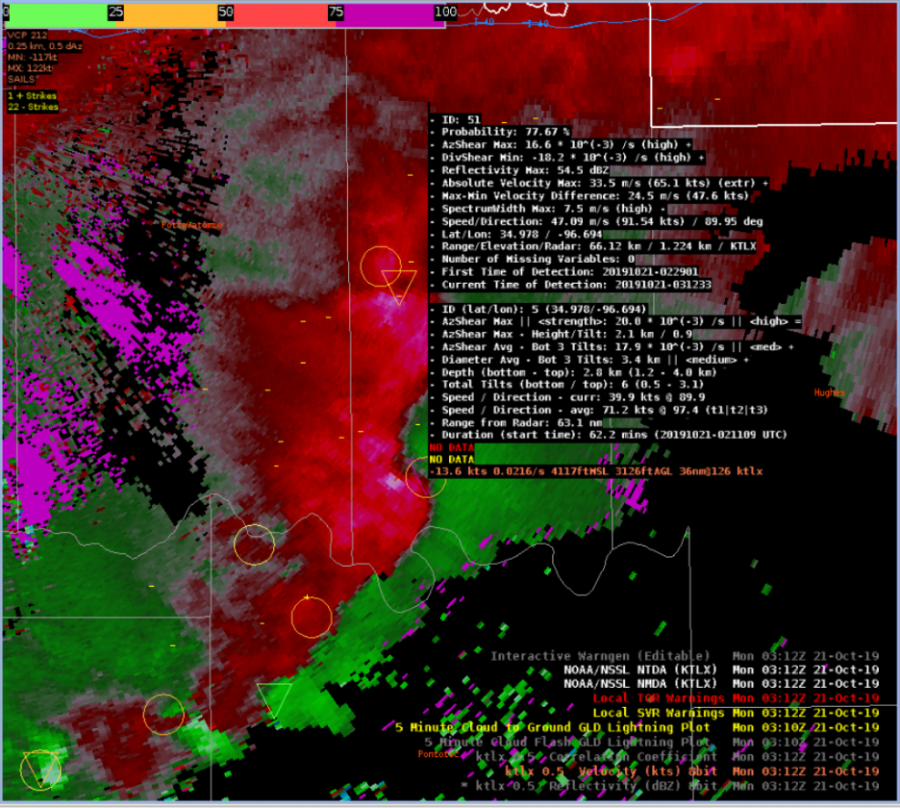
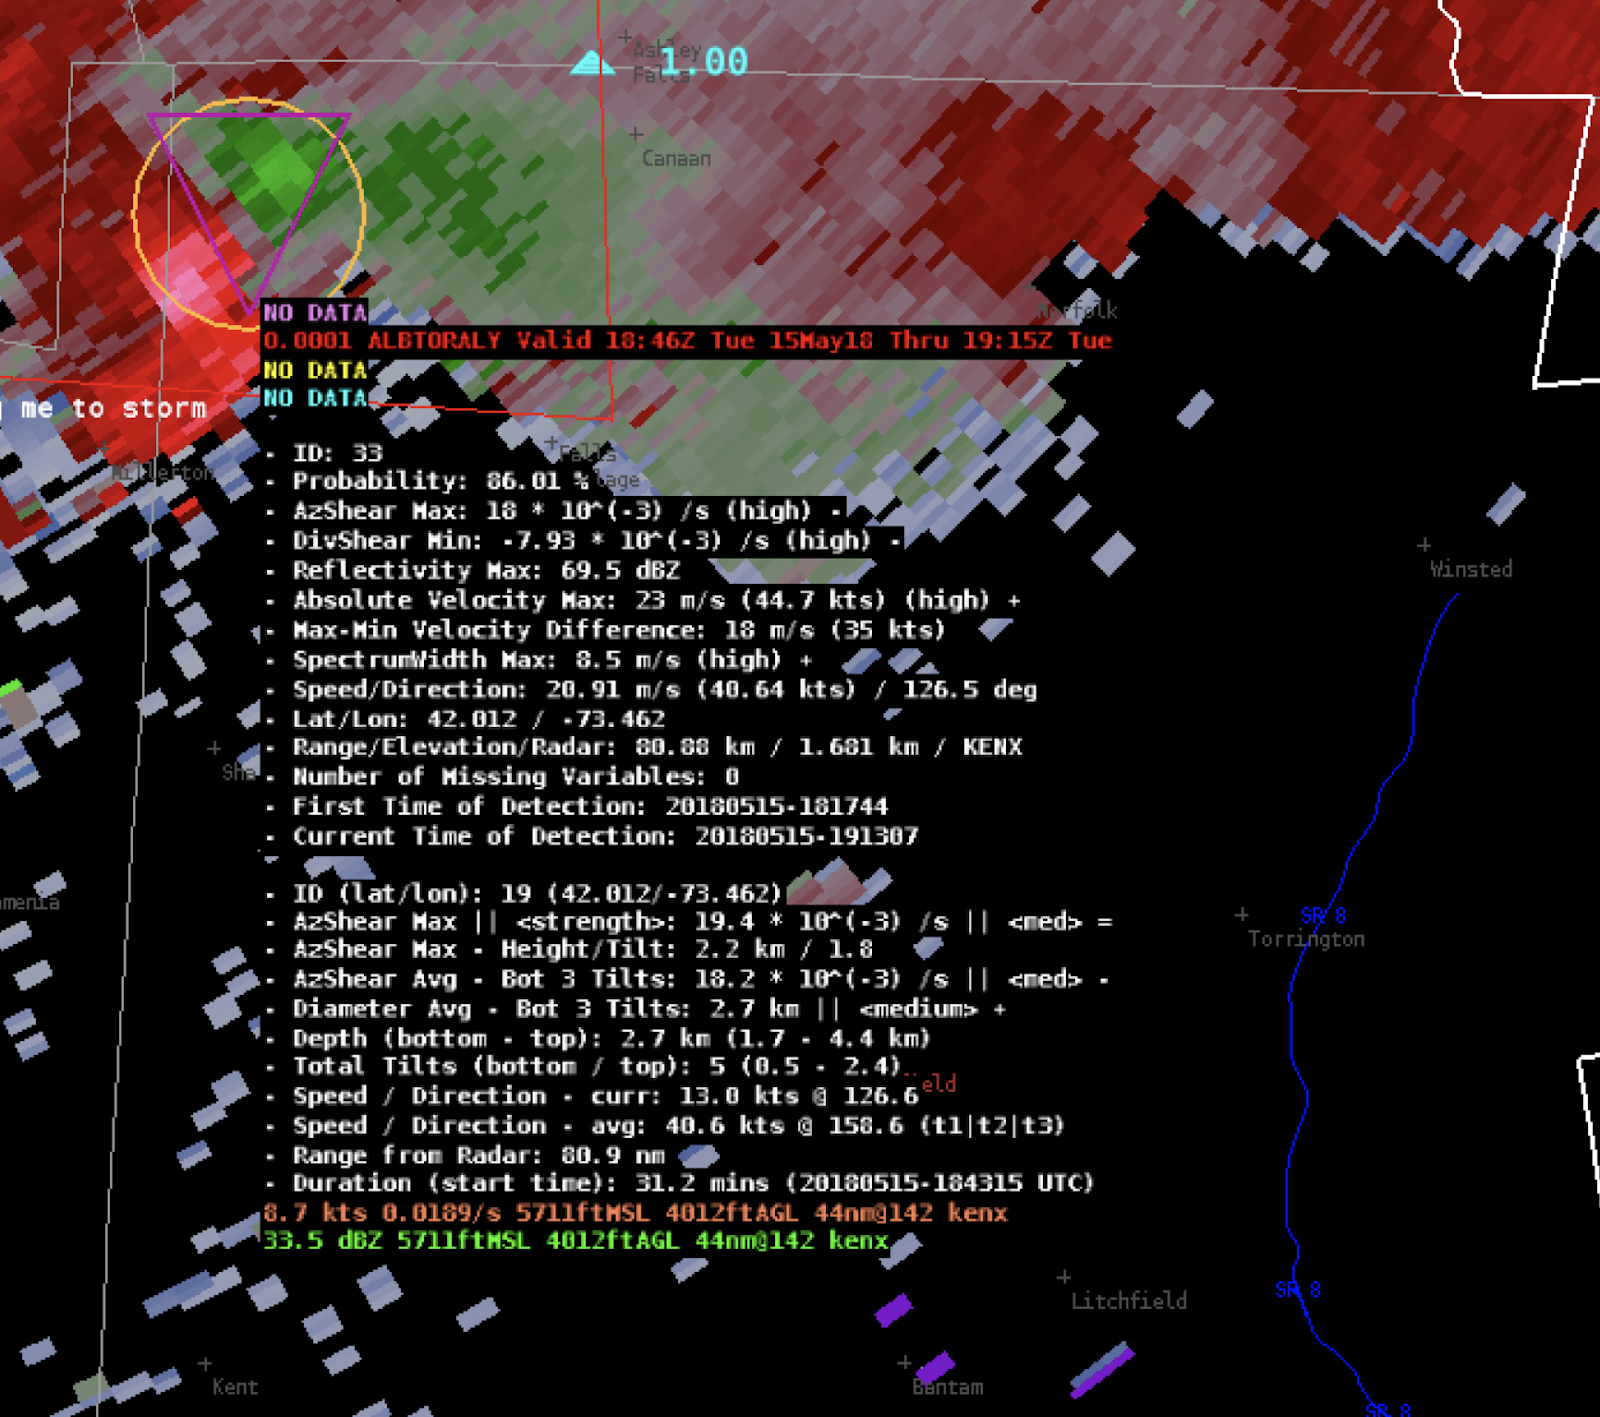
The readouts for the NMDA & NTDA are one of the biggest improvements for these products. It adds the objective analysis I would want out of these products with users ability to (1) pull them up at will thus reducing screen real estate and (2) has them linked to each individual storm/icon so I can easily relate the objective analysis to the storm under investigation. The 1 advantage of a table format highlighting the most intense circulations are solved with color attributes of the icons, which is better in my mind because it relates the severity of the rotational signatures to climatology versus a ranking of storms on any given day.

The drawback of the readouts is that size and the massive amount of information thrown out at once, there is so much in these tables that it’s hard to point out any one thing to follow. In my opinion, each readout should be cut in half to optimize the deluge of information. In addition, the value behind multiple fields should be combined where possible and some organization can help cut down on redundancies between titles thus reducing the amount of space in the product descriptions. For example:

AzShear Max
          Strength: 19.4 * 10(-3)/s || <Med> || ↘
          Diameter: 2.0 km || <Med> || ↗
          Height/Tilt: 2.2km / 1.8 deg
Avg Bottom 3 Tilts
          AzShear: 18.2 * 10(-3)/s || <Med> || ↗
          Diameter: 2.7 km || <Med> || ➝
Meso Depth (bottom – top)
          Distance: 2.7 km (1.7 -4.4 km)
          Tilts: 5 (0.5 – 2.4 deg)
Storm Attributes
          ID (lat/lon): 19 (14.01 / -73.46)
          Speed/Dir: 40.6 kts @ 158
          Duration: 31.2 min (since 18:43Z)

…etc. While I wouldn’t advocate for all these fields, this could be a more organized way to organized the information in the NMDA, that would allow user to find information faster. If awips can handle Unicode, special arrows could also be used as symbols.

KENX @ 19:12Z

#ProtectAnd Dissipate

NTDA Provides Early Detection of QLCS Tornado

A severe QLCS thunderstorm with a history of producing tornadoes developed a “kink” along the leading edge. The NTDA instantly brought the forecast attention to this area, with a 48% probability at 1918 UTC. NTDA continued to track the feature as it developed, and a spotter reported a tornado on the ground at 1930 UTC.

Victor Hedman

NTDA possibly relying on poor data

Looking at the area where the NTDA & the NMDA overlap in the images below, seems to indicate a large hail core where reflectivity is approximately 40 dBZ and higher, and a three-body scatter spike where reflectivity drops to less than 40 dBZ. The NTDA is indicating a probability of around 58% but the storm looks rather messy at this point with several of the highest inbound velocities occurring in areas where velocity is suspect due to the hail spike.

KENX @ 18:43Z
KENX @ 18:43Z
KENX @ 18:43Z

-#ProtectAndDissipate

NTDA/NMDA Possibly Struggling With Storms Featuring TBSS

The NTDA and NMDA for KENX had significant shortcomings for the 15 May 2018 event in the ALY CWA. The algorithms struggled to detect clear mesocyclones in cases where a significant hail spike was present. Could this hail spike be interrupting velocity data and causing unnecessary filtering of the algorithm? Also note that the velocity data appears to be more convergent, possibly due in part to the hail spike.

– Wario

NTDA Jumping from Circulation to Shear Max

During the OUN case today we noticed that both the NMDA and NTDA would occasionally jump in location relative to where we thought that the actual tornadic circulation would be.

Beginning at roughly 300z there was a northeasterly surge in reflectivity along the deep sheare 0-6km axis.  In turn we noticed that a couplet had formed along the northern extent of that reflectivity surge.  The NMDA captured this couplet however the NTDA did not. However, this is the same area that the NTDA had been scanning with the id of 51 which was described by a different blog post highlighting the length of time in which the NTDA and NMDA were able to track features.  Interestingly enough, while the NTDA did not display at 300z, it did the scan before and the scan after with the same ID value.


         .

Example Z at 300z (left) and Storm Relative Velocity (right)

What was particularly interesting about this case is that we started to notice that the NMDA and NTDA would jump from what appeared to be the tornadic circulation to the leading edge of the reflectivity where the azimuthal shear was perhaps maximized.  The following video is a feature following zoom where the feature zoomed in on is the tornadic circulation in question.

spiff_jump_042021_1140_low

– Spaceman Spiff


Clear Air, Low-End TDA probs

Around ~4Z, several NTDAs were being identified in areas of lowered reflectivity or where tornadic activity would not be generally expected. Causes looked to mostly be due to increased AzShear from noise, but at least probabilities remained small, below 20%

KTLX 04:06Z


– #ProtectAndDissipate

Algorithm Performance in QLCS transition

Both algorithms tagged onto the minor circulations within a developing QLCS pretty well with one or the other, or in several instances both, showing locations with increased vertical vorticity in areas that didn’t exhibit obvious bows or kinks in reflectivity. There was some noise and residual circulations in other parts of the storm, so there is room for detection improvement, but overall performance along the leading edge was okay.

Reflectivity at 03:32 KTLX


Velocity at 03:32 KTLX


– #ProtectAndDissipate

Time Durations for TDA & MDA

For a strong circulation that eventually became a tornadic in an occluding mesocyclone, the TDA and NDA did very well tracking the circulation in time. By 03:33Z (a time shown after the image below), the MDA had tracked the same circulation for ID 5 for over 82 minutes, and the TDA was able to track the storm for over 65 minutes. At times though the location of the MDA and TDA were a bit suspect


On a strong tornadic circulation, taken at 03:12Z


– #ProtectAndDissipate